Lincoln City, OR (Oregon) Houses and Residents
| Lincoln City: | $374,545 |
| Oregon: | $475,600 |
Mean price in 2022:
Detached houses: $461,711
Here: $461,711 State: $562,872 In 5-or-more-unit structures: $275,519
Here: $275,519 State: $420,389 Mobile homes: $89,648
Here: $89,648 State: $214,044
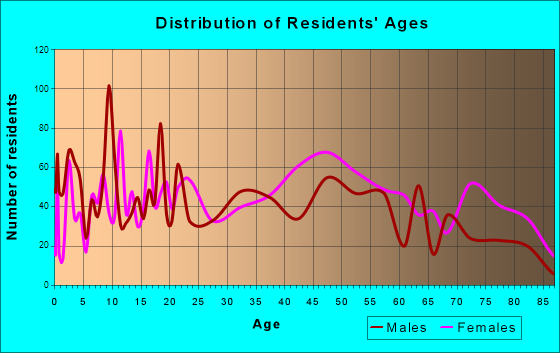
Total population: 8,036 (Urban population: 7,188 (all inside urban clusters), Rural population: 119 (all nonfarm))
Houses: 7,184 (4,387 occupied: 2,639 owner occupied, 1,767 renter occupied)
| % of renters here: | 40% |
| State: | 37% |
Housing density: 1,347 houses/condos per square mile
Median price asked for vacant for-sale houses and condos in 2022: $402,845.
Median contract rent in 2022: $1,022 (lower quartile is $791, upper quartile is $1,295)
Median rent asked for vacant for-rent units in 2022: $1,942
Median gross rent in Lincoln City, OR in 2022: $1,131
Housing units in Lincoln City with a mortgage: 1,435 (151 second mortgage, 10 home equity loan, 111 both second mortgage and home equity loan)
Houses without a mortgage: 18
Median household income for houses/condos with a mortgage: $82,969
Median household income for apartments without a mortgage: $54,724
Median monthly housing costs: $1,059
Compare current foreclosures near Lincoln City, OR:
| Photo | Address | Area | Beds / Baths | Price | Details |
|---|---|---|---|---|---|

|
#1
NW Mast Ave
Lincoln City, OR 97367
|
800 sq. feet
|
1 baths 1 beds |
show details | |

|
#2
SE Heron Loop
Lincoln City, OR 97367
|
1,288 sq. feet
|
2 baths 2 beds |
show details | |

|
#3
SE Port Ave
Lincoln City, OR 97367
|
1,188 sq. feet
|
2 baths 3 beds |
show details | |

|
#4
Seagrove Loop
Lincoln City, OR 97367
|
2,011 sq. feet
|
2 baths 3 beds |
show details | |

|
#5
NW Keel Ave
Lincoln City, OR 97367
|
- sq. feet
|
- baths - beds |
show details | |

|
#6
SE Lee Ave Apt B17
Lincoln City, OR 97367
|
- sq. feet
|
- baths - beds |
show details | |

|
#7
SW Dune Ave
Lincoln City, OR 97367
|
- sq. feet
|
- baths - beds |
show details | |

|
#8
SE Mast Ave Apt 25
Lincoln City, OR 97367
|
- sq. feet
|
- baths - beds |
show details | |

|
#9
El Pino Ave
Lincoln City, OR 97367
|
- sq. feet
|
- baths - beds |
show details | |

|
#10
SW Harbor Ave
Lincoln City, OR 97367
|
- sq. feet
|
- baths - beds |
show details |
| Photo | Address | Area | Beds / Baths | Price | Details |
|---|---|---|---|---|---|

|
#11
NW 20th St
Lincoln City, OR 97367
|
- sq. feet
|
- baths - beds |
show details | |

|
#12
SE Mast Ave Apt 39
Lincoln City, OR 97367
|
- sq. feet
|
- baths - beds |
show details | |

|
#13
S Highway 101
Depoe Bay, OR 97341
|
1,120 sq. feet
|
1 baths 2 beds |
show details | |

|
#14
N Echo Dr
Otis, OR 97368
|
1,080 sq. feet
|
2 baths 3 beds |
show details | |

|
#15
Slab Creek Rd
Neskowin, OR 97149
|
1,805 sq. feet
|
1 baths 3 beds |
show details | |

|
#16
N Sundown Dr
Otis, OR 97368
|
1,064 sq. feet
|
2 baths 2 beds |
show details | |

|
#17
SW Pine Ave
Depoe Bay, OR 97341
|
1,762 sq. feet
|
2 baths 3 beds |
show details | |

|
#18
NE Coos St
Newport, OR 97365
|
1,260 sq. feet
|
1 baths 3 beds |
show details | |

|
#19
Hill Crest Dr
Neskowin, OR 97149
|
- sq. feet
|
- baths - beds |
show details | |

|
Check over 1 million property listings on Foreclosure.com!
|
browse all offers | |||


 | Oregon Coast Condos/Townhouses for rent? (0 replies) |
| Coastal Oregon without Concentration of Homeless? (64 replies) |
| Lincoln City Ocean Terrace Condominiums (4 replies) |
| Ocean front homes. (23 replies) |
| Pacific City, OR--col, housing, quality of life (32 replies) |
| Lincoln City NOT Retiree Friendly (59 replies) |
Median year apartment built: 1987
Household type by relationship:
Households: 9,814- Male householders: 2,179 (584 living alone), Female householders: 2,122 (1,001 living alone)
1,863 spouses (1,812 opposite-sex spouses), 368 unmarried partners, (334 opposite-sex unmarried partners), 2,090 children (1,897 natural, 27 adopted, 165 stepchildren), 132 grandchildren, 184 brothers or sisters, 177 parents, 9 foster children, 138 other relatives, 431 non-relatives
- In group quarters: 117
Size of family households: 1,421 2-persons, 418 3-persons, 417 4-persons, 62 5-persons, 62 6-persons, 19 7-or-more-persons.
Size of nonfamily households: 1,699 1-person, 291 2-persons, 31 3-persons, 2 4-persons, 11 7-or-more-persons.
891 married couples with children.
575 single-parent households (178 men, 397 women).
89.5% of residents of Lincoln City speak English at home.
6.7% of residents speak Spanish at home (43% speak English very well, 21% speak English well, 25% speak English not well, 11% don't speak English at all).
2.1% of residents speak other Indo-European language at home (94% speak English very well, 6% speak English well).
2.1% of residents speak Asian or Pacific Island language at home (33% speak English very well, 52% speak English well, 15% speak English not well).
Foreign born population: 837 (8.5%)
(31.3% of them are naturalized citizens)
| Here: | 5.4 |
| State: | 6.2 |
| Here: | 4.1 |
| State: | 4.0 |

- Bedrooms in owner-occupied houses and condos in Lincoln City, Oregon
- 40no bedroom
- 1911 bedroom
- 6522 bedrooms
- 1,4653 bedrooms
- 2314 bedrooms
- 615+ bedrooms

- Bedrooms in renter-occupied apartments in Lincoln City, Oregon
- 152no bedroom
- 2671 bedroom
- 8672 bedrooms
- 2903 bedrooms
- 274 bedrooms
- 1655+ bedrooms

- Cars and other vehicles available in Lincoln City in owner-occupied houses/condos
- 67no vehicle
- 1,0161 vehicle
- 1,0822 vehicles
- 2993 vehicles
- 874 vehicles
- 895+ vehicles

- Cars and other vehicles available in Lincoln City in renter-occupied apartments
- 161no vehicle
- 9901 vehicle
- 5282 vehicles
- 283 vehicles
- 504 vehicles
- 105+ vehicles

- Rooms in owner-occupied houses in Lincoln City, Oregon
- 371 room
- 602 rooms
- 2363 rooms
- 2904 rooms
- 7535 rooms
- 5916 rooms
- 2827 rooms
- 1368 rooms
- 2569+ rooms

- Rooms in renter-occupied apartments in Lincoln City, Oregon
- 1431 room
- 812 rooms
- 2823 rooms
- 5564 rooms
- 2345 rooms
- 1926 rooms
- 787 rooms
- 728 rooms
- 1299+ rooms


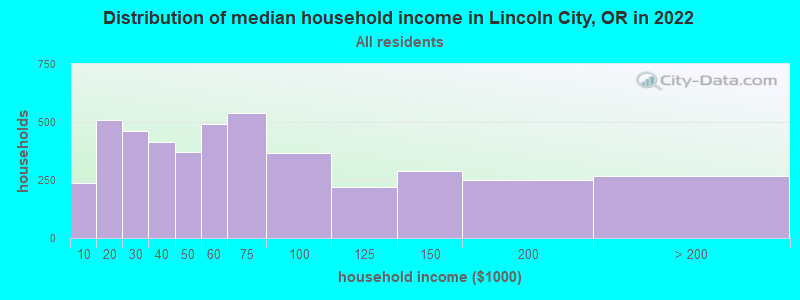
Lincoln City, OR household income distribution

- 237Less than $10,000
- 510$10,000 to $19,999
- 460$20,000 to $29,999
- 414$30,000 to $39,999
- 371$40,000 to $49,999
- 490$50,000 to $59,999
- 537$60,000 to $74,999
- 367$75,000 to $99,999
- 218$100,000 to $124,999
- 289$125,000 to $149,999
- 249$150,000 to $199,999
- 269$200,000 or more
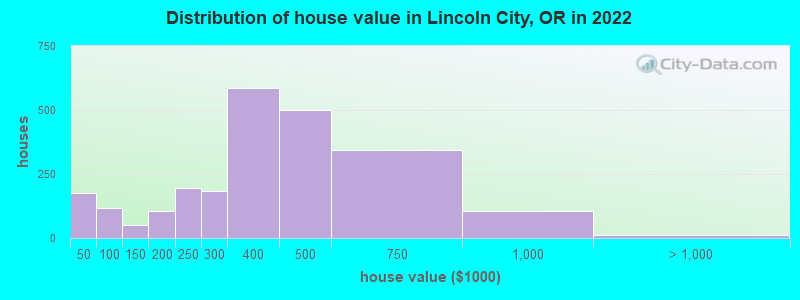
Home value of owner - occupied houses in 2022 in Lincoln City, OR
-
- 119Less than $10,000
- 18$15,000 to $19,999
- 7$30,000 to $34,999
- 30$40,000 to $49,999
- 4$50,000 to $59,999
- 53$60,000 to $69,999
- 14$70,000 to $79,999
- 12$90,000 to $99,999
- 20$100,000 to $124,999
- 29$125,000 to $149,999
- 31$150,000 to $174,999
- 75$175,000 to $199,999
- 194$200,000 to $249,999
- 182$250,000 to $299,999
- 587$300,000 to $399,999
- 500$400,000 to $499,999
- 344$500,000 to $749,999
- 105$750,000 to $999,999
- 13$1,000,000 to $1,499,999
Rent paid by renters in 2022 in Lincoln City, OR
-
- 51Less than $100
- 4$100 to $149
- 3$150 to $199
- 39$200 to $249
- 44$250 to $299
- 19$300 to $349
- 11$350 to $399
- 2$400 to $449
- 44$450 to $499
- 33$550 to $599
- 25$600 to $649
- 12$650 to $699
- 36$700 to $749
- 72$750 to $799
- 135$800 to $899
- 247$900 to $999
- 403$1,000 to $1,249
- 229$1,250 to $1,499
- 156$1,500 to $1,999
- 30$2,000 to $2,499
- 40$2,500 to $2,999
- 9$3,000 to $3,499
- 12$3,500 or more
- 70No cash rent

Percentage of workers working in this county: 96.1%
Number of people working at home: 716 (17.0% of all workers)
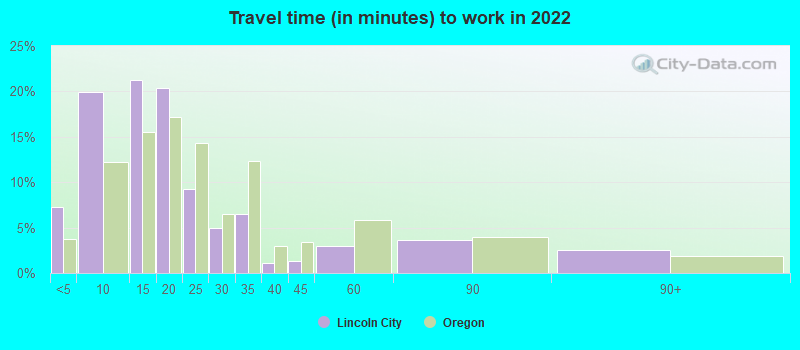
Travel time to work (commute)
- Less than 5 minutes: 337
- 5 to 9 minutes: 969
- 10 to 14 minutes: 943
- 15 to 19 minutes: 526
- 20 to 24 minutes: 190
- 25 to 29 minutes: 57
- 30 to 34 minutes: 167
- 35 to 39 minutes: 0
- 40 to 44 minutes: 30
- 45 to 59 minutes: 120
- 60 to 89 minutes: 116
- 90 or more minutes: 47
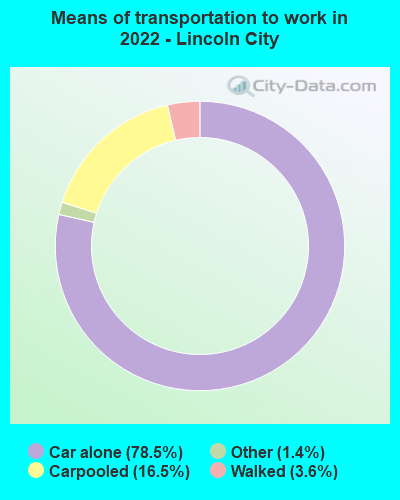
Means of transportation to work:
- Drove a car alone: 3,693 (67.5%)
- Carpooled: 786 (14.4%)
- Bus: 1 (0.0%)
- Taxi: 73 (1.3%)
- Walked: 186 (3.4%)
- Worked at home: 716 (13.1%)
- Unemployment by race in 2022
- Unemployment rate for White non-Hispanic residents
- 1.9%Males
- 2.1%Females
- Unemployment rate for American Indian and Alaska Native residents
- 29.8%Males
- 2.0%Females
- Unemployment rate for Asian residents
- 8.8%Males
- Unemployment rate for other race residents
- 0.5%Males
- Unemployment rate for two or more race residents
- 0.5%Males
- 16.5%Females
- Unemployment rate for Hispanic or Latino residents
- 0.2%Males
- 12.9%Females

- Year of entry for the foreign-born population in Lincoln City, Oregon
- 2192010 or later
- 2612000 to 2009
- 1991990 to 1999
- 641980 to 1989
- 441970 to 1979
- 138Before 1970

First ancestries reported:
- English: 536 (14.4%)
- German: 423 (11.3%)
- European: 238 (6.4%)
- Irish: 230 (6.2%)
- American: 214 (5.7%)
- Scottish: 156 (4.2%)
- Norwegian: 145 (3.9%)
- Italian: 90 (2.4%)
- Polish: 84 (2.2%)
- Scandinavian: 62 (1.7%)
- Armenian: 46 (1.2%)
- British: 38 (1.0%)
- Northern European: 38 (1.0%)
- Danish: 32 (0.9%)
- French Canadian: 29 (0.8%)
- Finnish: 26 (0.7%)
- Swedish: 20 (0.5%)
- Belgian: 13 (0.3%)
- Lithuanian: 11 (0.3%)
- Hungarian: 9 (0.2%)
- Eastern European: 8 (0.2%)
- French: 8 (0.2%)
- Scotch-Irish: 8 (0.2%)
- Czechoslovakian: 7 (0.2%)
- Dutch: 5 (0.1%)
- Portuguese: 4 (0.1%)
- Russian: 3 (0.08%)
Most common places of birth for foreign-born residents (%):
| Lincoln City: | 50.7% (424) |
| Oregon: | 33.9% (140,109) |
| Lincoln City: | 9.4% (79) |
| Oregon: | 0.4% (1,690) |
| Lincoln City: | 8.7% (73) |
| Oregon: | 1.9% (8,005) |
| Lincoln City: | 6.1% (51) |
| Oregon: | 3.5% (14,530) |
| Lincoln City: | 4.3% (36) |
| Oregon: | 1.5% (6,313) |
| Lincoln City: | 4.1% (34) |
| Oregon: | 0.8% (3,190) |
| Lincoln City: | 3.0% (25) |
| Oregon: | 0.2% (866) |
| Lincoln City: | 2.0% (17) |
| Oregon: | 5.2% (21,429) |
Place of birth for U.S.-born residents:
- This state: 3,601
- Other state: 5,272
- Northeast: 445
- Midwest: 1,132
- South: 534
- West: 3,156
83.0% of Lincoln City residents lived in the same house 1 years ago.
Out of people who lived in different houses, 32.6% lived in this county.
Out of people who lived in different counties, 66.6% lived in Oregon.
| Lincoln City: | 83.0% |
| State average: | 85.5% |
Education attainment for males 25 years and older:
- No schooling: 55
- Nursery to 4th grade: 10
- 5th and 6th grade: 62
- 7th and 8th grade: 0
- 9th grade: 21
- 10th grade: 30
- 11th grade: 32
- 12th grade, no diploma: 130
- High school graduate (or equivalency): 927
- Less than 1 year of college: 188
- Some college more than 1 year, no degree: 746
- Associate degree: 334
- Bachelor's degree: 541
- Master's degree: 303
- Professional school degree: 64
- Doctorate degree: 105

Education attainment for females 25 years and older:
- No schooling: 10
- Nursery to 4th grade: 5
- 5th and 6th grade: 73
- 7th and 8th grade: 6
- 9th grade: 13
- 10th grade: 107
- 11th grade: 4
- 12th grade, no diploma: 77
- High school graduate (or equivalency): 1,062
- Less than 1 year of college: 318
- Some college more than 1 year, no degree: 911
- Associate degree: 444
- Bachelor's degree: 820
- Master's degree: 280
- Professional school degree: 72
- Doctorate degree: 82

Housing units in structures:
- One, detached: 5,150
- One, attached: 176
- Two: 51
- 3 or 4: 178
- 5 to 9: 333
- 10 to 19: 276
- 20 to 49: 263
- 50 or more: 203
- Mobile homes: 504
- Boats, RVs, vans, etc.: 46
Housing units lacking complete kitchen facilities in 2022: 0.8%
House/condo owner moved in on average 7 years ago
Renter moved in on average 1 years ago

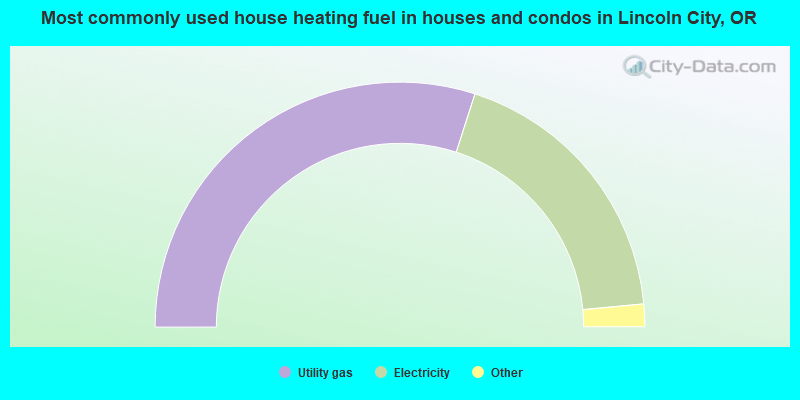
- 60.0%Utility gas
- 37.1%Electricity
- 2.0%Wood
- 0.7%Bottled, tank, or LP gas
- 0.2%Fuel oil, kerosene, etc.
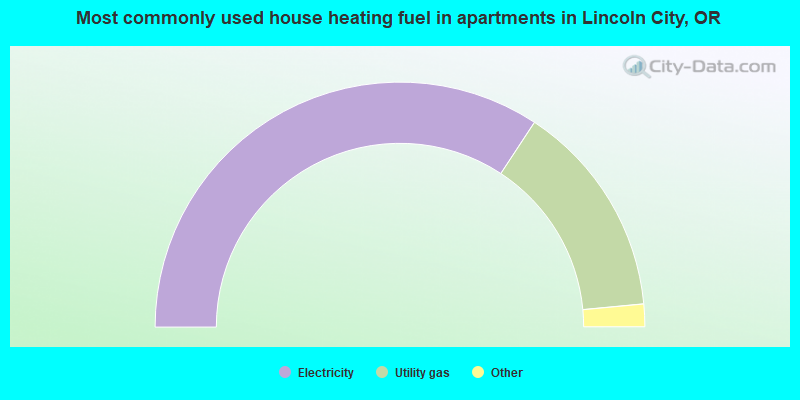
- 68.6%Electricity
- 28.5%Utility gas
- 2.0%Bottled, tank, or LP gas
- 0.6%Other fuel
- 0.2%No fuel used
Private vs. public school enrollment:
| Here: | 13.9% |
| Oregon: | 13.7% |
| Here: | 3.1% |
| Oregon: | 8.8% |
| Here: | 11.7% |
| Oregon: | 17.7% |


