Linton Hall, VA (Virginia) Houses and Residents
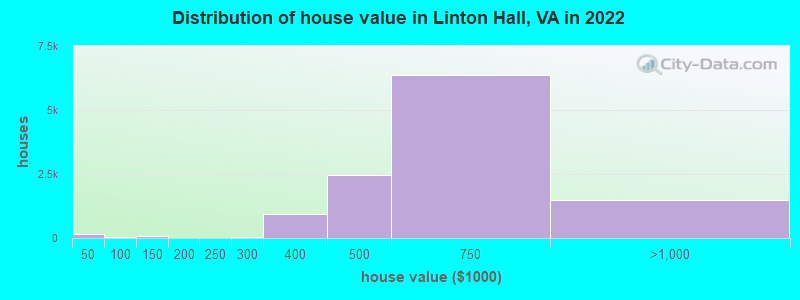
Estimated median house or condo value in 2022: $607,725 (it was $206,400 in 2000 )
Linton Hall:
$607,725Virginia:
$365,700
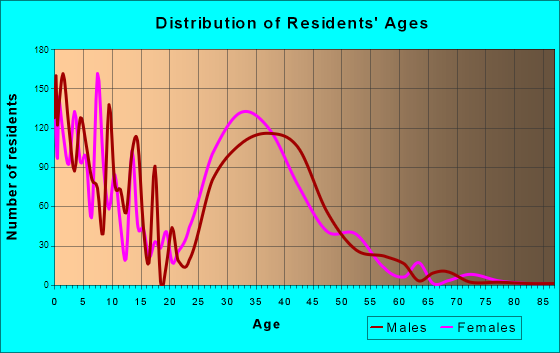
Lower value quartile - upper value quartile: $479,733 - $723,513Total population: 35,725 (Urban population: 7,371, Rural population: 1,378 (all nonfarm) )
Houses: 12,617 (12,416 occupied: 11,136 owner occupied, 1,344 renter occupied )
% of renters here:
11%State:
33%
Housing density: 1,527 houses/condos per square mile
Median price asked for vacant for-sale houses and condos in 2022 in this county: $448,286.
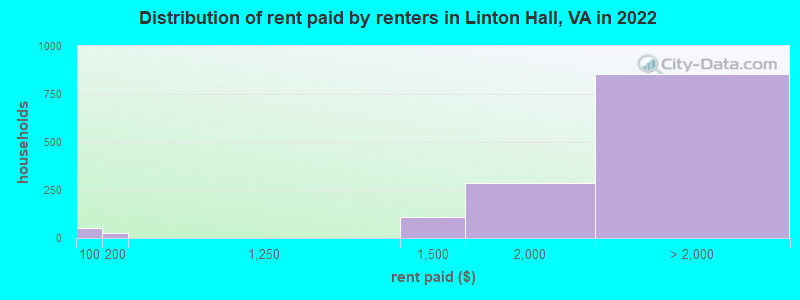
Median contract rent in 2022: over $2,000 (lower quartile is $1,683, upper quartile is over $2,000)
Median rent asked for vacant for-rent units in 2022: $8,619
Median gross rent in Linton Hall, VA in 2022: over $2,000
Housing units in Linton Hall with a mortgage: 9,562 (796 second mortgage, 21 home equity loan, 647 both second mortgage and home equity loan )Houses without a mortgage: 46
Median household income for houses/condos with a mortgage: $176,479
Median household income for apartments without a mortgage: $141,803
Median monthly housing costs: $2,538
Data:
Median house or condo value ($)
Median house or condo value ($ change since 2000)
Median house or condo value ($) - White
Median house or condo value ($) - Black or African American
Median house or condo value ($) - Asian
Median house or condo value ($) - Hispanic or Latino
Median house or condo value ($) - American Indian and Alaska Native
Median house or condo value ($) - Multirace
Median house or condo value ($) - Other Race
Median price asked for mobile homes ($)
Household density (households per square mile)
Mean house or condo value by units in structure - 1, detached ($)
Mean house or condo value by units in structure - 1, attached ($)
Mean house or condo value by units in structure - 2 ($)
Mean house or condo value by units in structure by units in structure - 3 or 4 ($)
Mean house or condo value by units in structure - 5 or more ($)
Mean house or condo value by units in structure - Boat, RV, van, etc. ($)
Mean house or condo value by units in structure - Mobile home ($)
Median contract rent ($)
Median contract rent - Lower quartile ($)
Median contract rent - Upper quartile ($)
Median gross rent ($)
Urban houses (%)
Rural houses (%)
Houses occupied (%)
Houses occupied (% change since 2000)
Houses owner occupied (%)
Houses owner occupied (% change since 2000)
Houses renter occupied (%)
Houses renter occupied (% change since 2000)
Vacant housing units - For rent (%)
Vacant housing units - For rent (% change since 2000)
Vacant housing units - For sale only (%)
Vacant housing units - For sale only (% change since 2000)
Vacant housing units - Rented or sold, not occupied (%)
Vacant housing units - Rented or sold, not occupied (% change since 2000)
Vacant housing units - For seasonal, recreational, or occasional use (%)
Vacant housing units - For seasonal, recreational, or occasional use (% change since 2000)
Vacant housing units - For migrant workers (%)
Vacant housing units - For migrant workers (% change since 2000)
Vacant housing units - Other vacant (%)
Vacant housing units - Other vacant (% change since 2000)
Median monthly housing costs ($)
Median household income for houses/condos with a mortgage ($)
Median household income for houses/condos without a mortgage ($)
Median household income ($)
Median household income ($) - White
Median household income ($) - Black or African American
Median household income ($) - Asian
Median household income ($) - Hispanic or Latino
Median household income ($) - American Indian and Alaska Native
Median household income ($) - Multirace
Median household income ($) - Other Race
Mortgage status - with mortgage (%)
Mortgage status - with second mortgage (%)
Mortgage status - with home equity loan (%)
Mortgage status - with both second mortgage and home equity loan (%)
Mortgage status - without a mortgage (%)
Median year house/condo built
Median year apartment built
Household type by relationship - Male householder living alone (%)
Household type by relationship - Male householder not living alone (%)
Household type by relationship - Female householder living alone (%)
Household type by relationship - Female householder not living alone (%)
Household type by relationship - Opposite-Sex spouse (%)
Household type by relationship - Same-Sex spouse (%)
Household type by relationship - Opposite-Sex unmarried partner (%)
Household type by relationship - Same-Sex unmarried partner (%)
Household type by relationship - In group quarters (%)
Size of family households - 2-person household (%)
Size of family households - 3-person household (%)
Size of family households - 4-person household (%)
Size of family households - 5-person household (%)
Size of family households - 6-person household (%)
Size of family households - 7-or-more-person household (%)
Size of nonfamily households - 1-person household (%)
Size of nonfamily households - 2-person household (%)
Size of nonfamily households - 3-person household (%)
Size of nonfamily households - 4-person household (%)
Size of nonfamily households - 5-person household (%)
Size of nonfamily households - 6-person household (%)
Size of nonfamily households - 7-or-moreperson household (%)
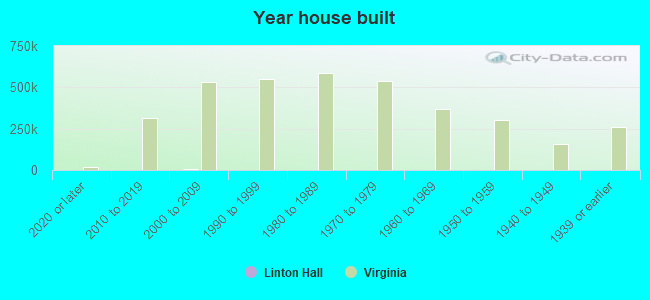
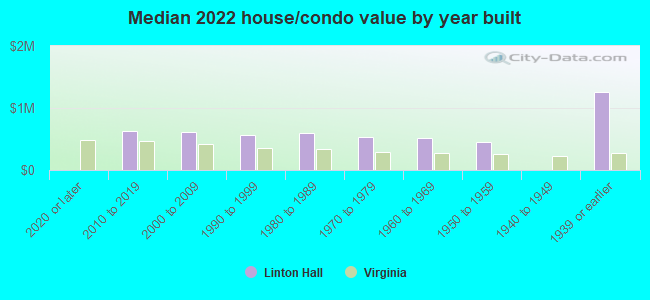
Year house built - Built 2010 or later (%)
Year house built - Built 2000 to 2009 (%)
Year house built - Built 1990 to 1999 (%)
Year house built - Built 1980 to 1989 (%)
Year house built - Built 1970 to 1979 (%)
Year house built - Built 1960 to 1969 (%)
Year house built - Built 1950 to 1959 (%)
Year house built - Built 1940 to 1949 (%)
Year house built - Built 1939 or earlier (%)
Median number of rooms in houses and condos
Median number of rooms in apartments
Median number of bedrooms in owner occupied houses
Mean number of bedrooms in owner occupied houses
Median number of bedrooms in renter occupied houses
Mean number of bedrooms in renter occupied houses
Median number of vehichles in owner occupied houses
Mean number of vehichles in owner occupied houses
Median number of vehichles in renter occupied houses
Mean number of vehichles in renter occupied houses
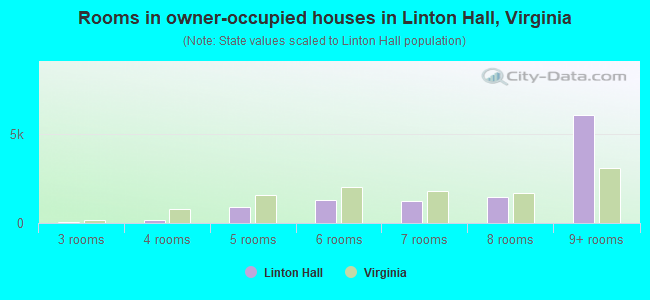
Rooms in owner-occupied houses - 1 room (%)
Rooms in owner-occupied houses - 2 rooms (%)
Rooms in owner-occupied houses - 3 rooms (%)
Rooms in owner-occupied houses - 4 rooms (%)
Rooms in owner-occupied houses - 5 rooms (%)
Rooms in owner-occupied houses - 6 rooms (%)
Rooms in owner-occupied houses - 7 rooms (%)
Rooms in owner-occupied houses - 8 rooms (%)
Rooms in owner-occupied houses - 9+ rooms (%)
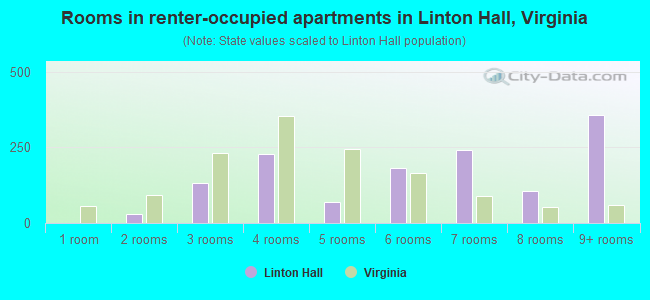
Rooms in renter-occupied houses - 1 room (%)
Rooms in renter-occupied houses - 2 rooms (%)
Rooms in renter-occupied houses - 3 rooms (%)
Rooms in renter-occupied houses - 4 rooms (%)
Rooms in renter-occupied houses - 5 rooms (%)
Rooms in renter-occupied houses - 6 rooms (%)
Rooms in renter-occupied houses - 7 rooms (%)
Rooms in renter-occupied houses - 8 rooms (%)
Rooms in renter-occupied houses - 9+ rooms (%)
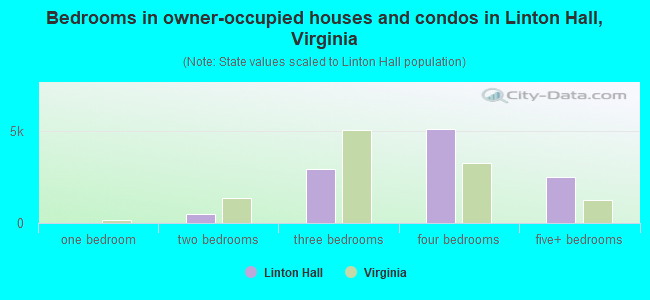
Bedrooms in owner-occupied houses - no bedrooms (%)
Bedrooms in owner-occupied houses - 1 bedroom (%)
Bedrooms in owner-occupied houses - 2 bedrooms (%)
Bedrooms in owner-occupied houses - 3 bedrooms (%)
Bedrooms in owner-occupied houses - 4 bedrooms (%)
Bedrooms in owner-occupied houses - 5+ bedrooms (%)
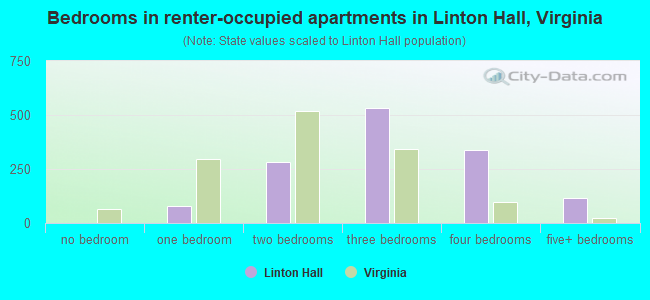
Bedrooms in renter-occupied houses - no bedrooms (%)
Bedrooms in renter-occupied houses - 1 bedroom (%)
Bedrooms in renter-occupied houses - 2 bedrooms (%)
Bedrooms in renter-occupied houses - 3 bedrooms (%)
Bedrooms in renter-occupied houses - 4 bedrooms (%)
Bedrooms in renter-occupied houses - 5+ bedrooms (%)
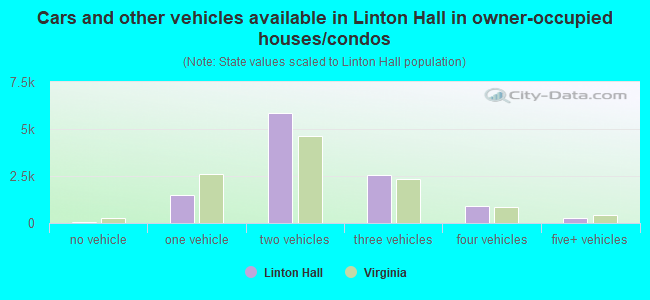
Vehicles available in owner-occupied houses - no vehicle available (%)
Vehicles available in owner-occupied houses - 1 vehicle available(%)
Vehicles available in owner-occupied houses - 2 Vehicles available (%)
Vehicles available in owner-occupied houses - 3 Vehicles available (%)
Vehicles available in owner-occupied houses - 4 Vehicles available (%)
Vehicles available in owner-occupied houses - 5+ Vehicles available (%)
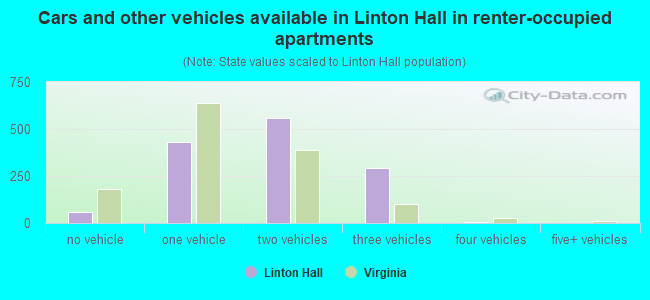
Vehicles available in renter-occupied houses - no vehicle available (%)
Vehicles available in renter-occupied houses - 1 vehicle available (%)
Vehicles available in renter-occupied houses - 2 Vehicles available (%)
Vehicles available in renter-occupied houses - 3 Vehicles available (%)
Vehicles available in renter-occupied houses - 4 Vehicles available (%)
Vehicles available in renter-occupied houses - 5+ Vehicles available (%)
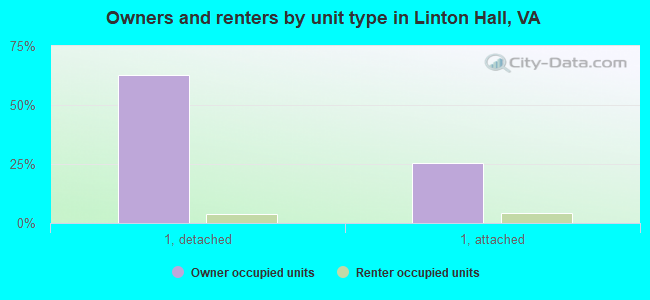
Housing units in structures - 1, detached (%)
Housing units in structures - 1, attached (%)
Housing units in structures - 2 (%)
Housing units in structures - 3 or 4 (%)
Housing units in structures - 5 to 9 (%)
Housing units in structures - 10 to 19 (%)
Housing units in structures - 20 to 49 (%)
Housing units in structures - 50 or more (%)
Housing units in structures - Mobile home (%)
Housing units in structures - Boat, RV, van, etc. (%)
Housing units in structures - Owners - 1, detached (%)
Housing units in structures - Owners - 1, attached (%)
Housing units in structures - Owners - 2 (%)
Housing units in structures - Owners - 3 or 4 (%)
Housing units in structures - Owners - 5 to 9 (%)
Housing units in structures - Owners - 10 to 19 (%)
Housing units in structures - Owners - 20 to 49 (%)
Housing units in structures - Owners - 50 or more (%)
Housing units in structures - Owners - Mobile home (%)
Housing units in structures - Owners - Boat, RV, van, etc. (%)
Housing units in structures - Renters - 1, detached (%)
Housing units in structures - Renters - 1, attached (%)
Housing units in structures - Renters - 2 (%)
Housing units in structures - Renters - 3 or 4 (%)
Housing units in structures - Renters - 5 to 9 (%)
Housing units in structures - Renters - 10 to 19 (%)
Housing units in structures - Renters - 20 to 49 (%)
Housing units in structures - Renters - 50 or more (%)
Housing units in structures - Renters - Mobile home (%)
Housing units in structures - Renters - Boat, RV, van, etc. (%)
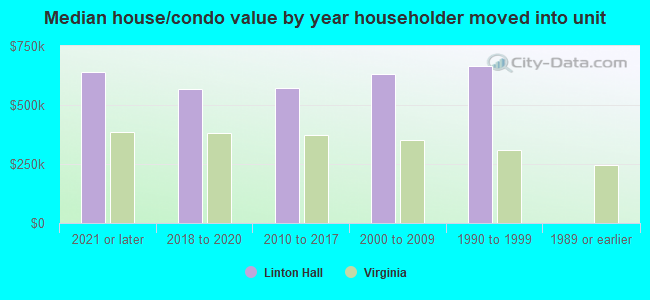
House/condo owner moved in on average (years ago)
Renter moved in on average (years ago)
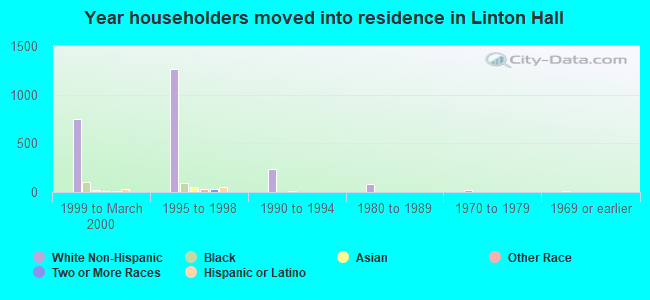
Year householder moved into unit - Moved in 1999 to March 2000 (%)
Year householder moved into unit - Moved in 1999 to March 2000 (%) - White
Year householder moved into unit - Moved in 1999 to March 2000 (%) - Black or African American
Year householder moved into unit - Moved in 1999 to March 2000 (%) - Asian
Year householder moved into unit - Moved in 1999 to March 2000 (%) - Hispanic or Latino
Year householder moved into unit - Moved in 1999 to March 2000 (%) - American Indian and Alaska Native
Year householder moved into unit - Moved in 1999 to March 2000 (%) - Multirace
Year householder moved into unit - Moved in 1999 to March 2000 (%) - Other Race
Year householder moved into unit - Moved in 1995 to 1998 (%)
Year householder moved into unit - Moved in 1995 to 1998 (%) - White
Year householder moved into unit - Moved in 1995 to 1998 (%) - Black or African American
Year householder moved into unit - Moved in 1995 to 1998 (%) - Asian
Year householder moved into unit - Moved in 1995 to 1998 (%) - Hispanic or Latino
Year householder moved into unit - Moved in 1995 to 1998 (%) - American Indian and Alaska Native
Year householder moved into unit - Moved in 1995 to 1998 (%) - Multirace
Year householder moved into unit - Moved in 1995 to 1998 (%) - Other Race
Year householder moved into unit - Moved in 1990 to 1994 (%)
Year householder moved into unit - Moved in 1990 to 1994 (%) - White
Year householder moved into unit - Moved in 1990 to 1994 (%) - Black or African American
Year householder moved into unit - Moved in 1990 to 1994 (%) - Asian
Year householder moved into unit - Moved in 1990 to 1994 (%) - Hispanic or Latino
Year householder moved into unit - Moved in 1990 to 1994 (%) - American Indian and Alaska Native
Year householder moved into unit - Moved in 1990 to 1994 (%) - Multirace
Year householder moved into unit - Moved in 1990 to 1994 (%) - Other Race
Year householder moved into unit - Moved in 1980 to 1989 (%)
Year householder moved into unit - Moved in 1980 to 1989 (%) - White
Year householder moved into unit - Moved in 1980 to 1989 (%) - Black or African American
Year householder moved into unit - Moved in 1980 to 1989 (%) - Asian
Year householder moved into unit - Moved in 1980 to 1989 (%) - Hispanic or Latino
Year householder moved into unit - Moved in 1980 to 1989 (%) - American Indian and Alaska Native
Year householder moved into unit - Moved in 1980 to 1989 (%) - Multirace
Year householder moved into unit - Moved in 1980 to 1989 (%) - Other Race
Year householder moved into unit - Moved in 1970 to 1979 (%)
Year householder moved into unit - Moved in 1970 to 1979 (%) - White
Year householder moved into unit - Moved in 1970 to 1979 (%) - Black or African American
Year householder moved into unit - Moved in 1970 to 1979 (%) - Asian
Year householder moved into unit - Moved in 1970 to 1979 (%) - Hispanic or Latino
Year householder moved into unit - Moved in 1970 to 1979 (%) - American Indian and Alaska Native
Year householder moved into unit - Moved in 1970 to 1979 (%) - Multirace
Year householder moved into unit - Moved in 1970 to 1979 (%) - Other Race
Year householder moved into unit - Moved in 1969 or earlier (%)
Year householder moved into unit - Moved in 1969 or earlier (%) - White
Year householder moved into unit - Moved in 1969 or earlier (%) - Black or African American
Year householder moved into unit - Moved in 1969 or earlier (%) - Asian
Year householder moved into unit - Moved in 1969 or earlier (%) - Hispanic or Latino
Year householder moved into unit - Moved in 1969 or earlier (%) - American Indian and Alaska Native
Year householder moved into unit - Moved in 1969 or earlier (%) - Multirace
Year householder moved into unit - Moved in 1969 or earlier (%) - Other Race
Housing units lacking complete plumbing facilities (%)
Housing units lacking complete kitchen facilities (%)
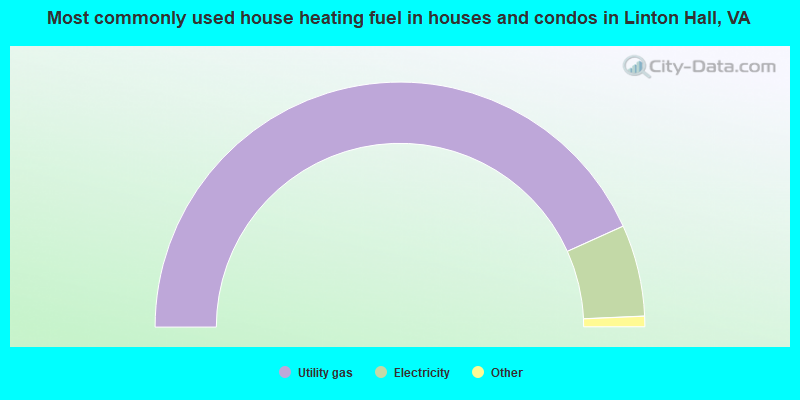
House heating fuel used in houses and condos - Utility gas (%)
House heating fuel used in houses and condos - Bottled, tank, or LP gas (%)
House heating fuel used in houses and condos - Electricity (%)
House heating fuel used in houses and condos - Fuel oil, kerosene, etc. (%)
House heating fuel used in houses and condos - Coal or coke (%)
House heating fuel used in houses and condos - Wood (%)
House heating fuel used in houses and condos - Solar energy (%)
House heating fuel used in houses and condos - Other fuel (%)
House heating fuel used in houses and condos - No fuel used (%)
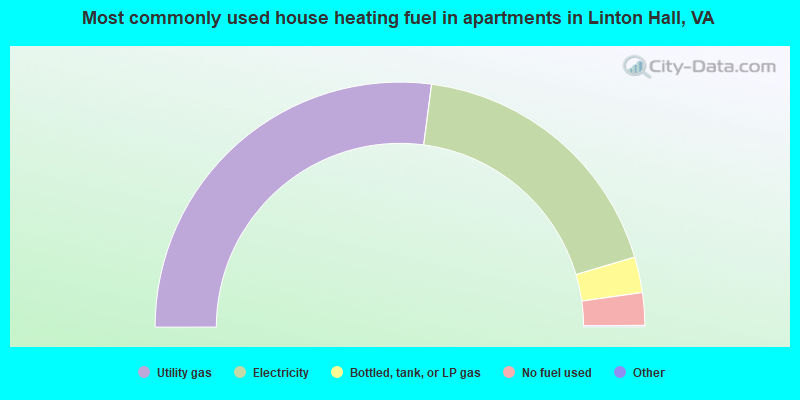
House heating fuel used in apartments - Utility gas (%)
House heating fuel used in apartments - Bottled, tank, or LP gas (%)
House heating fuel used in apartments - Electricity (%)
House heating fuel used in apartments - Fuel oil, kerosene, etc. (%)
House heating fuel used in apartments - Coal or coke (%)
House heating fuel used in apartments - Wood (%)
House heating fuel used in apartments - Solar energy (%)
House heating fuel used in apartments - Other fuel (%)
House heating fuel used in apartments - No fuel used (%)
Median year house/condo built: 2005Median year apartment built: 2007Household type by relationship:
Households: 43,219
Male householders: 6,585 (608 living alone ), Female householders: 5,714 (595 living alone )9,422 spouses (9,373 opposite-sex spouses ), 545 unmarried partners , (540 opposite-sex unmarried partners ), 17,095 children (16,231 natural , 297 adopted , 566 stepchildren ), 581 grandchildren , 231 brothers or sisters , 1,198 parents , 0 foster children , 965 other relatives , 733 non-relatives In group quarters: 143
Size of family households: 2,589 2-persons , 2,643 3-persons , 2,935 4-persons , 1,428 5-persons , 813 6-persons , 245 7-or-more-persons .
Size of nonfamily households: 1,271 1-person , 361 2-persons , 40 3-persons , 54 4-persons .
11,405 married couples with children. single-parent households (242 men , 908 women ).
74.5% of residents of Linton Hall speak English at home. of residents speak Spanish at home (72% speak English very well , 16% speak English well , 12% speak English not well , 1% don't speak English at all ).of residents speak other Indo-European language at home (73% speak English very well , 22% speak English well , 4% speak English not well , 1% don't speak English at all ).of residents speak Asian or Pacific Island language at home (58% speak English very well , 28% speak English well , 14% speak English not well ).of residents speak other language at home (64% speak English very well , 30% speak English well , 5% speak English not well , 1% don't speak English at all ).
Foreign born population: 7,373 (17.1%)of them are naturalized citizens )
Median number of rooms in houses and condos:
Median number of rooms in apartments
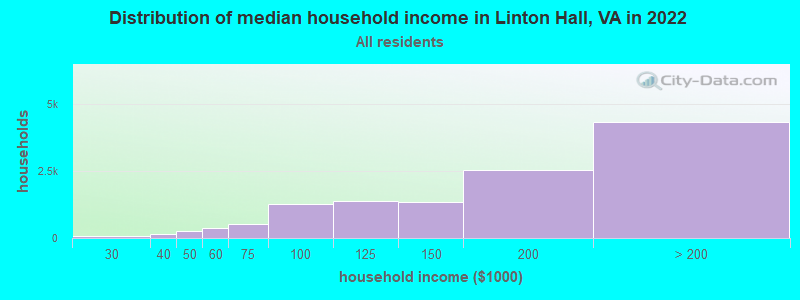
Linton Hall, VA household income distribution 32 Less than $10,00027 $10,000 to $19,99980 $20,000 to $29,999165 $30,000 to $39,999251 $40,000 to $49,999369 $50,000 to $59,999534 $60,000 to $74,9991,276 $75,000 to $99,9991,391 $100,000 to $124,9991,347 $125,000 to $149,9992,539 $150,000 to $199,9994,327 $200,000 or more
Home value of owner - occupied houses in 2022 in Linton Hall, VA 66 Less than $10,00048 $35,000 to $39,99926 $40,000 to $49,99941 $100,000 to $124,99917 $125,000 to $149,99912 $150,000 to $174,9995 $175,000 to $199,9999 $200,000 to $249,99949 $250,000 to $299,999919 $300,000 to $399,9992,456 $400,000 to $499,9996,357 $500,000 to $749,9991,390 $750,000 to $999,99981 $1,000,000 to $1,499,99925 $2,000,000 or moreRent paid by renters in 2022 in Linton Hall, VA 49 Less than $10025 $100 to $149110 $1,250 to $1,499284 $1,500 to $1,999537 $2,000 to $2,499150 $2,500 to $2,999116 $3,000 to $3,49937 $3,500 or more13 No cash rent
Percentage of workers working in this county: 56.3%Number of people working at home: 6,088 (27.2% of all workers )
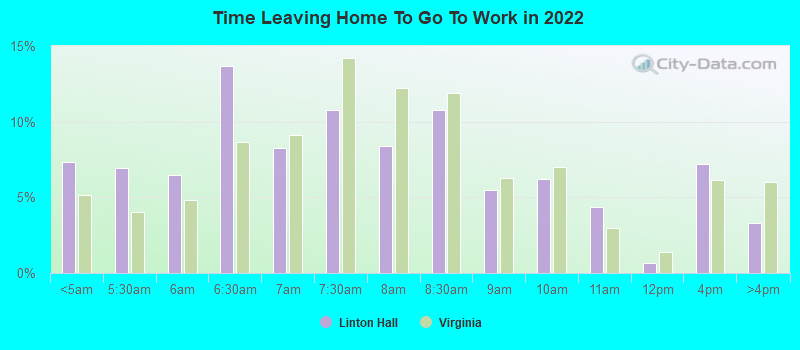
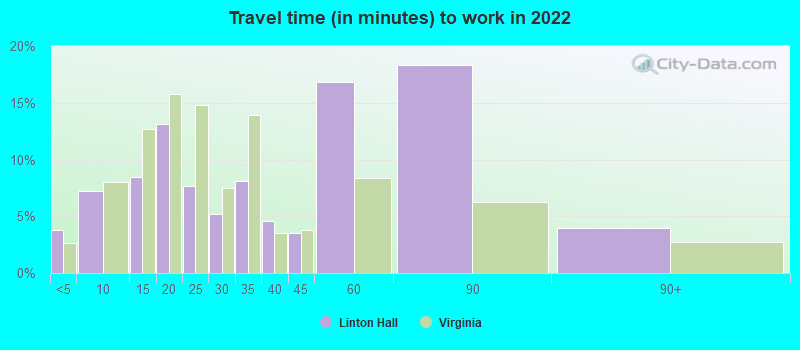
Travel time to work (commute)
Less than 5 minutes: 1555 to 9 minutes: 1,18510 to 14 minutes: 1,61415 to 19 minutes: 1,94720 to 24 minutes: 1,31525 to 29 minutes: 64330 to 34 minutes: 1,56735 to 39 minutes: 66840 to 44 minutes: 95145 to 59 minutes: 2,49560 to 89 minutes: 3,35990 or more minutes: 733
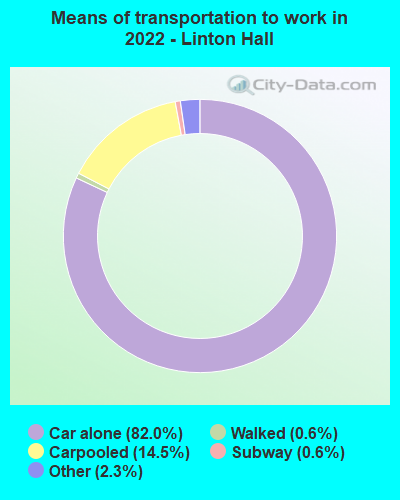
Means of transportation to work:
Drove a car alone: 3,817 (38.5%)Carpooled: 671 (6.8%)Long-distance train or commuter rail : 51 (0.5%)Taxi: 152 (1.5%)Walked: 27 (0.3%)Worked at home: 6,088 (61.5%)
Unemployment by race in 2022
Unemployment rate for White non-Hispanic residents 3.5% Males2.7% FemalesUnemployment rate for Black residents 4.6% Males2.8% FemalesUnemployment rate for Asian residents 5.2% MalesUnemployment rate for other race residents 4.4% Males5.0% FemalesUnemployment rate for two or more race residents 1.6% Males1.0% FemalesUnemployment rate for Hispanic or Latino residents 2.4% Males3.3% Females
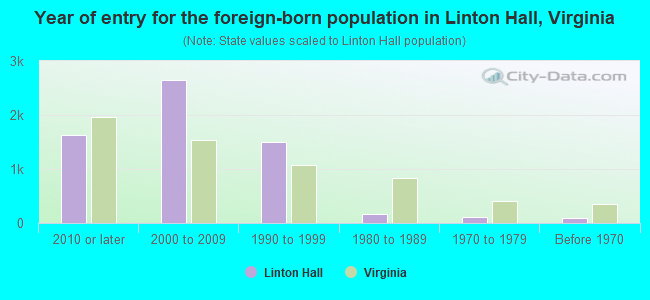
Year of entry for the foreign-born population in Linton Hall, Virginia
1,633 2010 or later 2,648 2000 to 2009 1,507 1990 to 1999 163 1980 to 1989 118 1970 to 1979 87 Before 1970
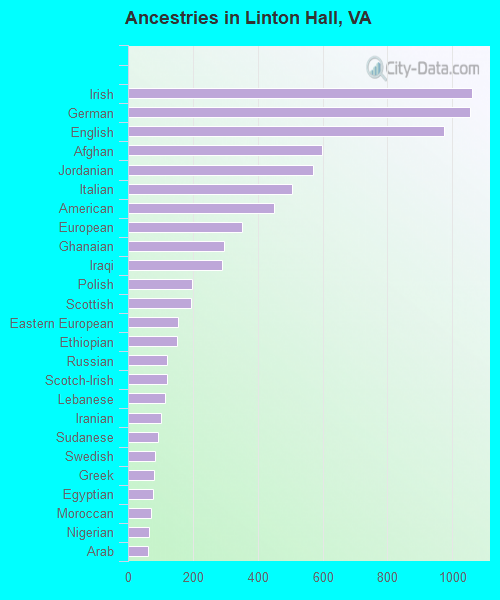
First ancestries reported:
Irish: 1,060 (5.7%)
German: 1,054 (5.7%)
English: 975 (5.3%)
Afghan: 598 (3.2%)
Jordanian: 569 (3.1%)
Italian: 505 (2.7%)
American: 451 (2.4%)
European: 353 (1.9%)
Ghanaian: 297 (1.6%)
Iraqi: 291 (1.6%)
Polish: 196 (1.1%)
Scottish: 194 (1.1%)
Eastern European: 155 (0.8%)
Ethiopian: 152 (0.8%)
Russian: 121 (0.7%)
Scotch-Irish: 119 (0.6%)
Lebanese: 115 (0.6%)
Iranian: 103 (0.6%)
Sudanese: 92 (0.5%)
Swedish: 84 (0.5%)
Greek: 79 (0.4%)
Egyptian: 78 (0.4%)
Moroccan: 71 (0.4%)
Nigerian: 64 (0.3%)
Arab: 63 (0.3%)
Dutch: 63 (0.3%)
Kenyan: 59 (0.3%)
Turkish: 52 (0.3%)
French: 51 (0.3%)
Portuguese: 48 (0.3%)
Lithuanian: 45 (0.2%)
Norwegian: 44 (0.2%)
Ukrainian: 44 (0.2%)
Liberian: 41 (0.2%)
Albanian: 41 (0.2%)
Romanian: 39 (0.2%)
Hungarian: 35 (0.2%)
Jamaican: 35 (0.2%)
Northern European: 31 (0.2%)
Slovene: 30 (0.2%)
Palestinian: 29 (0.2%)
Croatian: 27 (0.1%)
African: 25 (0.1%)
Czechoslovakian: 22 (0.1%)
British: 20 (0.1%)
Czech: 19 (0.1%)
Scandinavian: 18 (0.10%)
Belgian: 18 (0.10%)
Austrian: 18 (0.10%)
French Canadian: 11 (0.06%)
Haitian: 11 (0.06%)
British West Indian: 7 (0.04%)
Welsh: 6 (0.03%)
West Indian: 5 (0.03%)
Most common places of birth for foreign-born residents (%): El Salvador Linton Hall:
10.1% (773)Virginia:
9.9% (107,534)
India Linton Hall:
6.8% (518)Virginia:
9.0% (97,830)
Afghanistan Linton Hall:
6.3% (479)Virginia:
1.8% (19,426)
Pakistan Linton Hall:
5.7% (438)Virginia:
2.3% (24,582)
Vietnam Linton Hall:
5.7% (436)Virginia:
4.2% (45,750)
Korea Linton Hall:
5.5% (418)Virginia:
4.9% (52,857)
Peru Linton Hall:
5.0% (382)Virginia:
2.4% (26,366)
China, excluding Hong Kong and Taiwan Linton Hall:
3.9% (296)Virginia:
3.9% (42,989)
Jordan Linton Hall:
3.9% (296)Virginia:
0.3% (3,022)
Ethiopia Linton Hall:
3.3% (252)Virginia:
2.9% (32,082)
Iraq Linton Hall:
3.0% (227)Virginia:
0.9% (9,351)
Philippines Linton Hall:
2.6% (198)Virginia:
4.8% (52,629)
Ghana Linton Hall:
2.6% (196)Virginia:
1.6% (17,346)
Nepal Linton Hall:
2.0% (149)Virginia:
0.9% (9,695)
Bolivia Linton Hall:
1.9% (146)Virginia:
2.4% (25,722)
Morocco Linton Hall:
1.8% (134)Virginia:
0.7% (7,733)
Thailand Linton Hall:
1.6% (126)Virginia:
0.7% (7,672)
Guatemala Linton Hall:
1.6% (124)Virginia:
3.3% (35,938)
Mexico Linton Hall:
1.6% (124)Virginia:
5.3% (57,498)
Iran Linton Hall:
1.6% (122)Virginia:
1.3% (14,417)
Place of birth for U.S.-born residents:
This state: 18,487Other state: 16,097Northeast: 4,782Midwest: 3,443South: 5,635West: 2,323 89.5% of Linton Hall residents lived in the same house 1 years ago.
Out of people who lived in different houses, 33.4% lived in this county.
Out of people who lived in different counties, 73.5% lived in Virginia.
Linton Hall:
89.5%State average:
86.6%
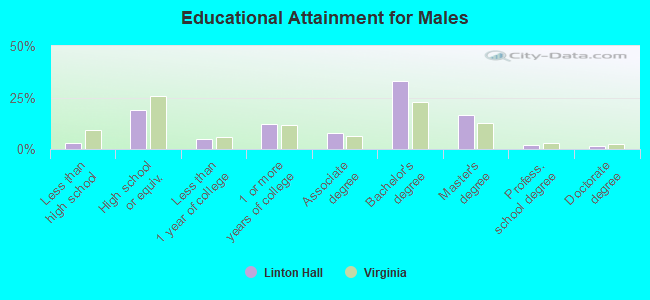
Education attainment for males 25 years and older:
No schooling: 58Nursery to 4th grade: 05th and 6th grade: 07th and 8th grade: 09th grade: 2410th grade: 1411th grade: 4812th grade, no diploma: 231High school graduate (or equivalency): 2,395Less than 1 year of college: 619Some college more than 1 year, no degree: 1,557Associate degree: 996Bachelor's degree: 4,224Master's degree: 2,117Professional school degree: 232Doctorate degree: 207
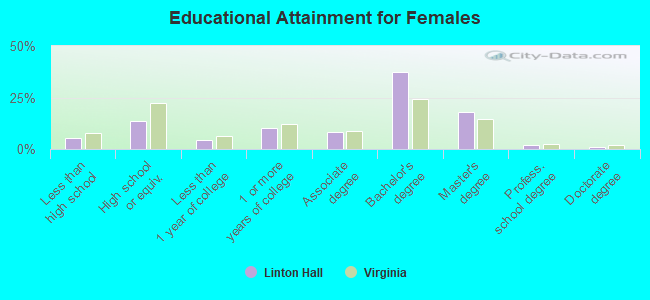
Education attainment for females 25 years and older:
No schooling: 368Nursery to 4th grade: 215th and 6th grade: 07th and 8th grade: 769th grade: 3610th grade: 811th grade: 3512th grade, no diploma: 150High school graduate (or equivalency): 1,846Less than 1 year of college: 587Some college more than 1 year, no degree: 1,348Associate degree: 1,101Bachelor's degree: 5,010Master's degree: 2,429Professional school degree: 229Doctorate degree: 105
Housing units in structures:
One, detached: 8,562One, attached: 3,6853 or 4: 805 to 9: 1010 to 19: 8920 to 49: 9250 or more: 72Mobile homes: 23House/condo owner moved in on average 9 years ago
Renter moved in on average 0 years ago
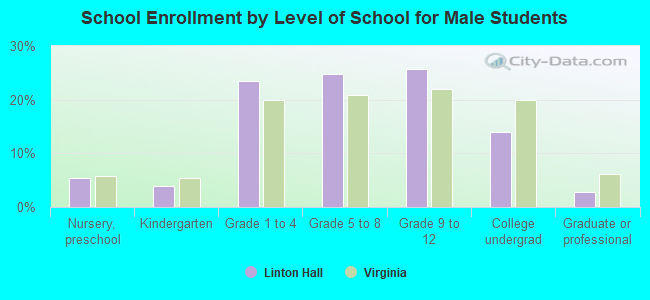
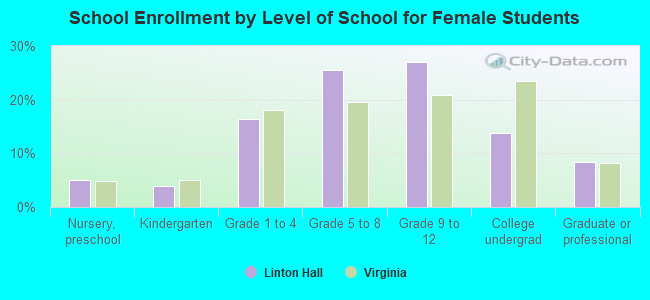
Private vs. public school enrollment:
Students in private schools in grades 1 to 8 (elementary and middle school): 597 Students in private schools in grades 9 to 12 (high school): 137 Students in private undergraduate colleges: 151