Linwood, NJ (New Jersey) Houses and Residents
Estimated median house or condo value in 2022: $385,486 (it was $160,800 in 2000 )
Linwood:
$385,486New Jersey:
$428,900
Lower value quartile - upper value quartile: $277,690 - $511,348Mean price in 2022: Detached houses: $442,063 Here:
$442,063State:
$537,591
Townhouses or other attached units: $355,237 Here:
$355,237State:
$381,113
In 2-unit structures: $141,782 Here:
$141,782State:
$444,476
In 3-to-4-unit structures: $182,983 Here:
$182,983State:
$457,463
In 5-or-more-unit structures: $216,440 Here:
$216,440State:
$368,745
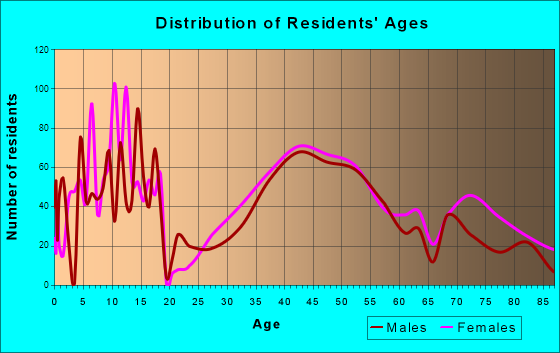
Total population: 7,052 (All urban)
Houses: 2,895 (2,662 occupied: 2,401 owner occupied, 261 renter occupied )
% of renters here:
10%State:
35%
Housing density: 756 houses/condos per square mile
Median price asked for vacant for-sale houses and condos in 2022: $329,256.
Median contract rent in 2022: $1,729 (lower quartile is $1,366, upper quartile is $1,967)
Median rent asked for vacant for-rent units in 2022: $1,770
Median gross rent in Linwood, NJ in 2022: $1,829
Housing units in Linwood with a mortgage: 1,516 (122 second mortgage, 18 home equity loan, 117 both second mortgage and home equity loan )Houses without a mortgage: 24
Median household income for houses/condos with a mortgage: $154,796
Median household income for apartments without a mortgage: $110,773
Median monthly housing costs: $2,104
Data:
Median house or condo value ($)
Median house or condo value ($ change since 2000)
Median house or condo value ($) - White
Median house or condo value ($) - Black or African American
Median house or condo value ($) - Asian
Median house or condo value ($) - Hispanic or Latino
Median house or condo value ($) - American Indian and Alaska Native
Median house or condo value ($) - Multirace
Median house or condo value ($) - Other Race
Median price asked for mobile homes ($)
Household density (households per square mile)
Mean house or condo value by units in structure - 1, detached ($)
Mean house or condo value by units in structure - 1, attached ($)
Mean house or condo value by units in structure - 2 ($)
Mean house or condo value by units in structure by units in structure - 3 or 4 ($)
Mean house or condo value by units in structure - 5 or more ($)
Mean house or condo value by units in structure - Boat, RV, van, etc. ($)
Mean house or condo value by units in structure - Mobile home ($)
Median contract rent ($)
Median contract rent - Lower quartile ($)
Median contract rent - Upper quartile ($)
Median gross rent ($)
Urban houses (%)
Rural houses (%)
Houses occupied (%)
Houses occupied (% change since 2000)
Houses owner occupied (%)
Houses owner occupied (% change since 2000)
Houses renter occupied (%)
Houses renter occupied (% change since 2000)
Vacant housing units - For rent (%)
Vacant housing units - For rent (% change since 2000)
Vacant housing units - For sale only (%)
Vacant housing units - For sale only (% change since 2000)
Vacant housing units - Rented or sold, not occupied (%)
Vacant housing units - Rented or sold, not occupied (% change since 2000)
Vacant housing units - For seasonal, recreational, or occasional use (%)
Vacant housing units - For seasonal, recreational, or occasional use (% change since 2000)
Vacant housing units - For migrant workers (%)
Vacant housing units - For migrant workers (% change since 2000)
Vacant housing units - Other vacant (%)
Vacant housing units - Other vacant (% change since 2000)
Median monthly housing costs ($)
Median household income for houses/condos with a mortgage ($)
Median household income for houses/condos without a mortgage ($)
Median household income ($)
Median household income ($) - White
Median household income ($) - Black or African American
Median household income ($) - Asian
Median household income ($) - Hispanic or Latino
Median household income ($) - American Indian and Alaska Native
Median household income ($) - Multirace
Median household income ($) - Other Race
Mortgage status - with mortgage (%)
Mortgage status - with second mortgage (%)
Mortgage status - with home equity loan (%)
Mortgage status - with both second mortgage and home equity loan (%)
Mortgage status - without a mortgage (%)
Median year house/condo built
Median year apartment built
Household type by relationship - Male householder living alone (%)
Household type by relationship - Male householder not living alone (%)
Household type by relationship - Female householder living alone (%)
Household type by relationship - Female householder not living alone (%)
Household type by relationship - Opposite-Sex spouse (%)
Household type by relationship - Same-Sex spouse (%)
Household type by relationship - Opposite-Sex unmarried partner (%)
Household type by relationship - Same-Sex unmarried partner (%)
Household type by relationship - In group quarters (%)
Size of family households - 2-person household (%)
Size of family households - 3-person household (%)
Size of family households - 4-person household (%)
Size of family households - 5-person household (%)
Size of family households - 6-person household (%)
Size of family households - 7-or-more-person household (%)
Size of nonfamily households - 1-person household (%)
Size of nonfamily households - 2-person household (%)
Size of nonfamily households - 3-person household (%)
Size of nonfamily households - 4-person household (%)
Size of nonfamily households - 5-person household (%)
Size of nonfamily households - 6-person household (%)
Size of nonfamily households - 7-or-moreperson household (%)
Year house built - Built 2010 or later (%)
Year house built - Built 2000 to 2009 (%)
Year house built - Built 1990 to 1999 (%)
Year house built - Built 1980 to 1989 (%)
Year house built - Built 1970 to 1979 (%)
Year house built - Built 1960 to 1969 (%)
Year house built - Built 1950 to 1959 (%)
Year house built - Built 1940 to 1949 (%)
Year house built - Built 1939 or earlier (%)
Median number of rooms in houses and condos
Median number of rooms in apartments
Median number of bedrooms in owner occupied houses
Mean number of bedrooms in owner occupied houses
Median number of bedrooms in renter occupied houses
Mean number of bedrooms in renter occupied houses
Median number of vehichles in owner occupied houses
Mean number of vehichles in owner occupied houses
Median number of vehichles in renter occupied houses
Mean number of vehichles in renter occupied houses
Rooms in owner-occupied houses - 1 room (%)
Rooms in owner-occupied houses - 2 rooms (%)
Rooms in owner-occupied houses - 3 rooms (%)
Rooms in owner-occupied houses - 4 rooms (%)
Rooms in owner-occupied houses - 5 rooms (%)
Rooms in owner-occupied houses - 6 rooms (%)
Rooms in owner-occupied houses - 7 rooms (%)
Rooms in owner-occupied houses - 8 rooms (%)
Rooms in owner-occupied houses - 9+ rooms (%)
Rooms in renter-occupied houses - 1 room (%)
Rooms in renter-occupied houses - 2 rooms (%)
Rooms in renter-occupied houses - 3 rooms (%)
Rooms in renter-occupied houses - 4 rooms (%)
Rooms in renter-occupied houses - 5 rooms (%)
Rooms in renter-occupied houses - 6 rooms (%)
Rooms in renter-occupied houses - 7 rooms (%)
Rooms in renter-occupied houses - 8 rooms (%)
Rooms in renter-occupied houses - 9+ rooms (%)
Bedrooms in owner-occupied houses - no bedrooms (%)
Bedrooms in owner-occupied houses - 1 bedroom (%)
Bedrooms in owner-occupied houses - 2 bedrooms (%)
Bedrooms in owner-occupied houses - 3 bedrooms (%)
Bedrooms in owner-occupied houses - 4 bedrooms (%)
Bedrooms in owner-occupied houses - 5+ bedrooms (%)
Bedrooms in renter-occupied houses - no bedrooms (%)
Bedrooms in renter-occupied houses - 1 bedroom (%)
Bedrooms in renter-occupied houses - 2 bedrooms (%)
Bedrooms in renter-occupied houses - 3 bedrooms (%)
Bedrooms in renter-occupied houses - 4 bedrooms (%)
Bedrooms in renter-occupied houses - 5+ bedrooms (%)
Vehicles available in owner-occupied houses - no vehicle available (%)
Vehicles available in owner-occupied houses - 1 vehicle available(%)
Vehicles available in owner-occupied houses - 2 Vehicles available (%)
Vehicles available in owner-occupied houses - 3 Vehicles available (%)
Vehicles available in owner-occupied houses - 4 Vehicles available (%)
Vehicles available in owner-occupied houses - 5+ Vehicles available (%)
Vehicles available in renter-occupied houses - no vehicle available (%)
Vehicles available in renter-occupied houses - 1 vehicle available (%)
Vehicles available in renter-occupied houses - 2 Vehicles available (%)
Vehicles available in renter-occupied houses - 3 Vehicles available (%)
Vehicles available in renter-occupied houses - 4 Vehicles available (%)
Vehicles available in renter-occupied houses - 5+ Vehicles available (%)
Housing units in structures - 1, detached (%)
Housing units in structures - 1, attached (%)
Housing units in structures - 2 (%)
Housing units in structures - 3 or 4 (%)
Housing units in structures - 5 to 9 (%)
Housing units in structures - 10 to 19 (%)
Housing units in structures - 20 to 49 (%)
Housing units in structures - 50 or more (%)
Housing units in structures - Mobile home (%)
Housing units in structures - Boat, RV, van, etc. (%)
Housing units in structures - Owners - 1, detached (%)
Housing units in structures - Owners - 1, attached (%)
Housing units in structures - Owners - 2 (%)
Housing units in structures - Owners - 3 or 4 (%)
Housing units in structures - Owners - 5 to 9 (%)
Housing units in structures - Owners - 10 to 19 (%)
Housing units in structures - Owners - 20 to 49 (%)
Housing units in structures - Owners - 50 or more (%)
Housing units in structures - Owners - Mobile home (%)
Housing units in structures - Owners - Boat, RV, van, etc. (%)
Housing units in structures - Renters - 1, detached (%)
Housing units in structures - Renters - 1, attached (%)
Housing units in structures - Renters - 2 (%)
Housing units in structures - Renters - 3 or 4 (%)
Housing units in structures - Renters - 5 to 9 (%)
Housing units in structures - Renters - 10 to 19 (%)
Housing units in structures - Renters - 20 to 49 (%)
Housing units in structures - Renters - 50 or more (%)
Housing units in structures - Renters - Mobile home (%)
Housing units in structures - Renters - Boat, RV, van, etc. (%)
House/condo owner moved in on average (years ago)
Renter moved in on average (years ago)
Year householder moved into unit - Moved in 1999 to March 2000 (%)
Year householder moved into unit - Moved in 1999 to March 2000 (%) - White
Year householder moved into unit - Moved in 1999 to March 2000 (%) - Black or African American
Year householder moved into unit - Moved in 1999 to March 2000 (%) - Asian
Year householder moved into unit - Moved in 1999 to March 2000 (%) - Hispanic or Latino
Year householder moved into unit - Moved in 1999 to March 2000 (%) - American Indian and Alaska Native
Year householder moved into unit - Moved in 1999 to March 2000 (%) - Multirace
Year householder moved into unit - Moved in 1999 to March 2000 (%) - Other Race
Year householder moved into unit - Moved in 1995 to 1998 (%)
Year householder moved into unit - Moved in 1995 to 1998 (%) - White
Year householder moved into unit - Moved in 1995 to 1998 (%) - Black or African American
Year householder moved into unit - Moved in 1995 to 1998 (%) - Asian
Year householder moved into unit - Moved in 1995 to 1998 (%) - Hispanic or Latino
Year householder moved into unit - Moved in 1995 to 1998 (%) - American Indian and Alaska Native
Year householder moved into unit - Moved in 1995 to 1998 (%) - Multirace
Year householder moved into unit - Moved in 1995 to 1998 (%) - Other Race
Year householder moved into unit - Moved in 1990 to 1994 (%)
Year householder moved into unit - Moved in 1990 to 1994 (%) - White
Year householder moved into unit - Moved in 1990 to 1994 (%) - Black or African American
Year householder moved into unit - Moved in 1990 to 1994 (%) - Asian
Year householder moved into unit - Moved in 1990 to 1994 (%) - Hispanic or Latino
Year householder moved into unit - Moved in 1990 to 1994 (%) - American Indian and Alaska Native
Year householder moved into unit - Moved in 1990 to 1994 (%) - Multirace
Year householder moved into unit - Moved in 1990 to 1994 (%) - Other Race
Year householder moved into unit - Moved in 1980 to 1989 (%)
Year householder moved into unit - Moved in 1980 to 1989 (%) - White
Year householder moved into unit - Moved in 1980 to 1989 (%) - Black or African American
Year householder moved into unit - Moved in 1980 to 1989 (%) - Asian
Year householder moved into unit - Moved in 1980 to 1989 (%) - Hispanic or Latino
Year householder moved into unit - Moved in 1980 to 1989 (%) - American Indian and Alaska Native
Year householder moved into unit - Moved in 1980 to 1989 (%) - Multirace
Year householder moved into unit - Moved in 1980 to 1989 (%) - Other Race
Year householder moved into unit - Moved in 1970 to 1979 (%)
Year householder moved into unit - Moved in 1970 to 1979 (%) - White
Year householder moved into unit - Moved in 1970 to 1979 (%) - Black or African American
Year householder moved into unit - Moved in 1970 to 1979 (%) - Asian
Year householder moved into unit - Moved in 1970 to 1979 (%) - Hispanic or Latino
Year householder moved into unit - Moved in 1970 to 1979 (%) - American Indian and Alaska Native
Year householder moved into unit - Moved in 1970 to 1979 (%) - Multirace
Year householder moved into unit - Moved in 1970 to 1979 (%) - Other Race
Year householder moved into unit - Moved in 1969 or earlier (%)
Year householder moved into unit - Moved in 1969 or earlier (%) - White
Year householder moved into unit - Moved in 1969 or earlier (%) - Black or African American
Year householder moved into unit - Moved in 1969 or earlier (%) - Asian
Year householder moved into unit - Moved in 1969 or earlier (%) - Hispanic or Latino
Year householder moved into unit - Moved in 1969 or earlier (%) - American Indian and Alaska Native
Year householder moved into unit - Moved in 1969 or earlier (%) - Multirace
Year householder moved into unit - Moved in 1969 or earlier (%) - Other Race
Housing units lacking complete plumbing facilities (%)
Housing units lacking complete kitchen facilities (%)
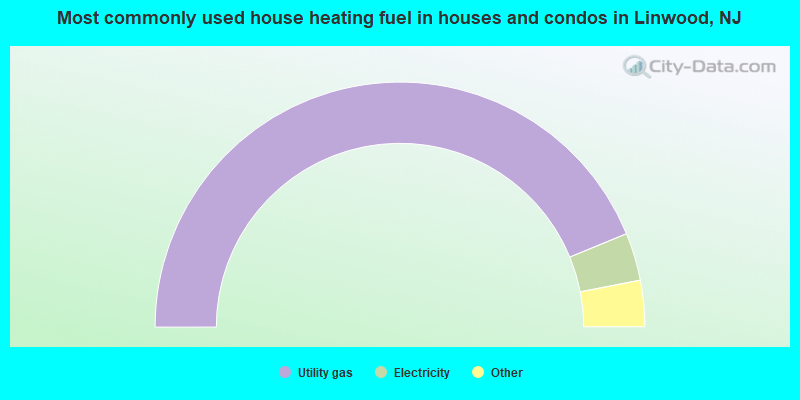
House heating fuel used in houses and condos - Utility gas (%)
House heating fuel used in houses and condos - Bottled, tank, or LP gas (%)
House heating fuel used in houses and condos - Electricity (%)
House heating fuel used in houses and condos - Fuel oil, kerosene, etc. (%)
House heating fuel used in houses and condos - Coal or coke (%)
House heating fuel used in houses and condos - Wood (%)
House heating fuel used in houses and condos - Solar energy (%)
House heating fuel used in houses and condos - Other fuel (%)
House heating fuel used in houses and condos - No fuel used (%)
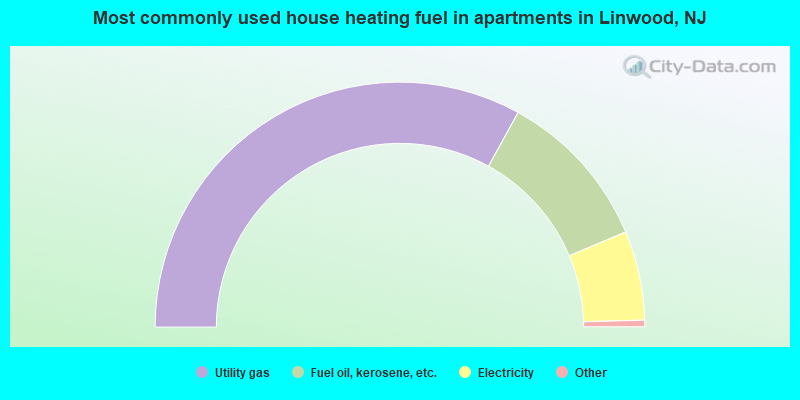
House heating fuel used in apartments - Utility gas (%)
House heating fuel used in apartments - Bottled, tank, or LP gas (%)
House heating fuel used in apartments - Electricity (%)
House heating fuel used in apartments - Fuel oil, kerosene, etc. (%)
House heating fuel used in apartments - Coal or coke (%)
House heating fuel used in apartments - Wood (%)
House heating fuel used in apartments - Solar energy (%)
House heating fuel used in apartments - Other fuel (%)
House heating fuel used in apartments - No fuel used (%)
Latest news about housing in Linwood, NJ collected exclusively by city-data.com from local newspapers, TV, and radio stations
Median year house/condo built: 1969Median year apartment built: 1969Household type by relationship:
Households: 6,984
Male householders: 1,239 (155 living alone ), Female householders: 1,427 (466 living alone )1,715 spouses (1,715 opposite-sex spouses ), 84 unmarried partners , (79 opposite-sex unmarried partners ), 2,045 children (1,975 natural , 32 adopted , 38 stepchildren ), 103 grandchildren , 9 brothers or sisters , 106 parents , 0 foster children , 63 other relatives , 46 non-relatives In group quarters: 143
Size of family households: 975 2-persons , 428 3-persons , 398 4-persons , 172 5-persons , 31 6-persons , 9 7-or-more-persons .
Size of nonfamily households: 602 1-person , 54 2-persons , 4 3-persons , 5 4-persons .
1,231 married couples with children. single-parent households (50 men , 97 women ).
88.7% of residents of Linwood speak English at home. of residents speak Spanish at home (48% speak English very well , 35% speak English well , 16% speak English not well , 2% don't speak English at all ).of residents speak other Indo-European language at home (76% speak English very well , 18% speak English well , 5% speak English not well ).of residents speak Asian or Pacific Island language at home (46% speak English very well , 37% speak English well , 13% speak English not well , 5% don't speak English at all ).of residents speak other language at home (100% speak English very well ).
Foreign born population: 615 (8.8%)of them are naturalized citizens )
Median number of rooms in houses and condos:
Median number of rooms in apartments
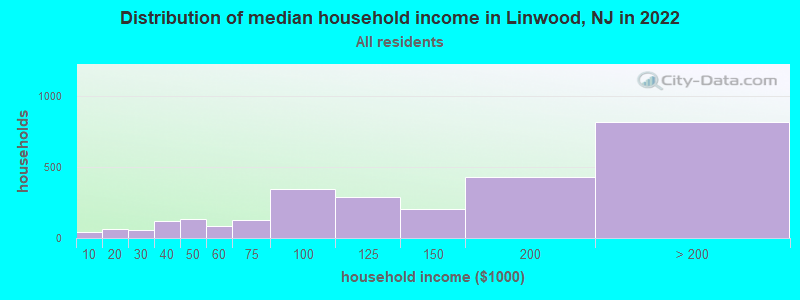
Linwood, NJ household income distribution 39 Less than $10,00066 $10,000 to $19,99955 $20,000 to $29,999118 $30,000 to $39,999131 $40,000 to $49,99986 $50,000 to $59,999125 $60,000 to $74,999346 $75,000 to $99,999289 $100,000 to $124,999203 $125,000 to $149,999428 $150,000 to $199,999819 $200,000 or more
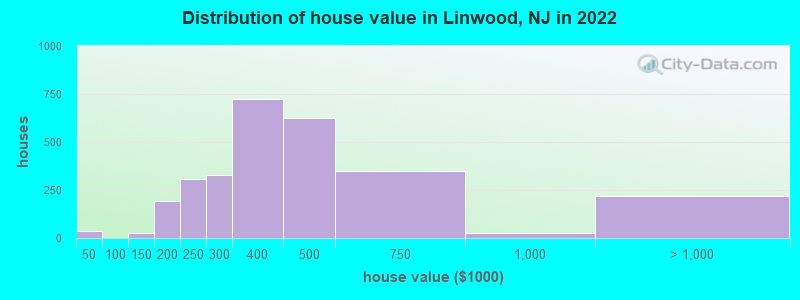
Home value of owner - occupied houses in 2022 in Linwood, NJ 19 Less than $10,00017 $25,000 to $29,9996 $100,000 to $124,99917 $125,000 to $149,99986 $150,000 to $174,999108 $175,000 to $199,999306 $200,000 to $249,999326 $250,000 to $299,999724 $300,000 to $399,999625 $400,000 to $499,999347 $500,000 to $749,99927 $750,000 to $999,999189 $1,000,000 to $1,499,9999 $1,500,000 to $1,999,99917 $2,000,000 or moreRent paid by renters in 2022 in Linwood, NJ 7 $200 to $24912 $250 to $29910 $900 to $99916 $1,000 to $1,24913 $1,250 to $1,499103 $1,500 to $1,99934 $2,000 to $2,49911 $2,500 to $2,9996 $3,500 or more18 No cash rent
Percentage of workers working in this county: 83.0%Number of people working at home: 593 (16.8% of all workers )
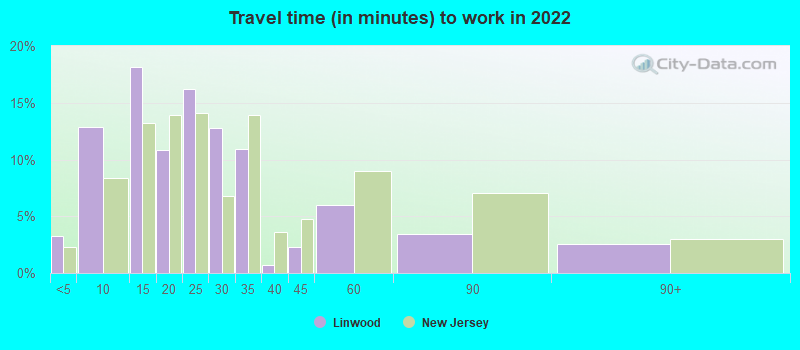
Travel time to work (commute)
Less than 5 minutes: 485 to 9 minutes: 42410 to 14 minutes: 34215 to 19 minutes: 47720 to 24 minutes: 85825 to 29 minutes: 25630 to 34 minutes: 34935 to 39 minutes: 1840 to 44 minutes: 2545 to 59 minutes: 3360 to 89 minutes: 5990 or more minutes: 83
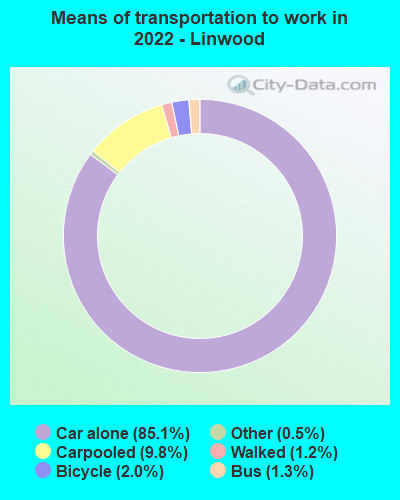
Means of transportation to work:
Drove a car alone: 1,799 (67.7%)Carpooled: 234 (8.8%)Bus : 25 (0.9%)Taxi: 11 (0.4%)Bicycle: 43 (1.6%)Walked: 28 (1.1%)Worked at home: 593 (22.3%)
Unemployment by race in 2022
Unemployment rate for White non-Hispanic residents 5.6% Males1.7% FemalesUnemployment rate for Asian residents 2.1% Males5.7% FemalesUnemployment rate for other race residents 8.6% FemalesUnemployment rate for two or more race residents 17.2% MalesUnemployment rate for Hispanic or Latino residents 9.1% Females
Year of entry for the foreign-born population in Linwood, New Jersey
41 2010 or later 180 2000 to 2009 153 1990 to 1999 75 1980 to 1989 64 1970 to 1979 117 Before 1970
First ancestries reported:
Italian: 482 (16.1%)
Irish: 353 (11.8%)
Russian: 261 (8.7%)
English: 210 (7.0%)
German: 183 (6.1%)
Polish: 149 (5.0%)
American: 148 (4.9%)
Eastern European: 86 (2.9%)
Greek: 81 (2.7%)
European: 54 (1.8%)
Trinidadian and Tobagonian: 32 (1.1%)
Hungarian: 25 (0.8%)
Scotch-Irish: 21 (0.7%)
Iranian: 20 (0.7%)
Lebanese: 19 (0.6%)
Egyptian: 18 (0.6%)
Scottish: 18 (0.6%)
Latvian: 14 (0.5%)
Bulgarian: 13 (0.4%)
Czechoslovakian: 13 (0.4%)
Serbian: 13 (0.4%)
Slovak: 13 (0.4%)
Cypriot: 10 (0.3%)
Ukrainian: 6 (0.2%)
Haitian: 2 (0.07%)
Jamaican: 2 (0.07%) Most common places of birth for foreign-born residents (%): Mexico Linwood:
13.3% (90)New Jersey:
4.8% (102,527)
Trinidad and Tobago Linwood:
7.8% (53)New Jersey:
0.7% (15,533)
India Linwood:
7.0% (47)New Jersey:
12.8% (274,609)
Dominican Republic Linwood:
5.3% (36)New Jersey:
9.7% (209,055)
Korea Linwood:
5.2% (35)New Jersey:
3.3% (70,512)
Taiwan Linwood:
5.2% (35)New Jersey:
0.7% (15,548)
Pakistan Linwood:
4.9% (33)New Jersey:
1.3% (27,580)
Poland Linwood:
4.3% (29)New Jersey:
2.3% (48,811)
Peru Linwood:
4.3% (29)New Jersey:
2.7% (58,563)
China, excluding Hong Kong and Taiwan Linwood:
3.6% (24)New Jersey:
3.7% (78,969)
Italy Linwood:
3.6% (24)New Jersey:
1.5% (33,198)
Greece Linwood:
3.0% (20)New Jersey:
0.3% (7,501)
Vietnam Linwood:
2.8% (19)New Jersey:
0.7% (15,644)
Philippines Linwood:
2.5% (17)New Jersey:
4.0% (85,934)
Egypt Linwood:
2.4% (16)New Jersey:
1.6% (33,678)
Oceania, n.e.c. Linwood:
2.4% (16)New Jersey:
0.0% (156)
England Linwood:
2.2% (15)New Jersey:
0.5% (10,886)
Malaysia Linwood:
2.1% (14)New Jersey:
0.1% (2,031)
Brazil Linwood:
1.9% (13)New Jersey:
2.1% (46,020)
Bulgaria Linwood:
1.6% (11)New Jersey:
0.2% (3,249)
Latvia Linwood:
1.6% (11)New Jersey:
0.1% (1,789)
Place of birth for U.S.-born residents:
This state: 4,197Other state: 2,184Northeast: 1,663Midwest: 169South: 246West: 75 93.7% of Linwood residents lived in the same house 1 years ago.
Out of people who lived in different houses, 45.2% lived in this county.
Out of people who lived in different counties, 47.5% lived in New Jersey.
Linwood:
93.7%State average:
90.4%
Education attainment for males 25 years and older:
No schooling: 33Nursery to 4th grade: 115th and 6th grade: 07th and 8th grade: 99th grade: 710th grade: 2011th grade: 1412th grade, no diploma: 19High school graduate (or equivalency): 304Less than 1 year of college: 97Some college more than 1 year, no degree: 188Associate degree: 136Bachelor's degree: 734Master's degree: 511Professional school degree: 278Doctorate degree: 24
Education attainment for females 25 years and older:
No schooling: 15Nursery to 4th grade: 05th and 6th grade: 347th and 8th grade: 09th grade: 810th grade: 1711th grade: 1512th grade, no diploma: 20High school graduate (or equivalency): 457Less than 1 year of college: 167Some college more than 1 year, no degree: 209Associate degree: 283Bachelor's degree: 864Master's degree: 502Professional school degree: 147Doctorate degree: 114
Housing units in structures:
One, detached: 2,497One, attached: 137Two: 293 or 4: 945 to 9: 1410 to 19: 3220 to 49: 2050 or more: 70Housing units lacking complete plumbing facilities in 2022: 0.2%Housing units lacking complete kitchen facilities in 2022: 1.5%House/condo owner moved in on average 17 years ago
Renter moved in on average 6 years ago
Private vs. public school enrollment:
Students in private schools in grades 1 to 8 (elementary and middle school): 34 Here:
5.1%New Jersey:
12.3%
Students in private schools in grades 9 to 12 (high school): 37 Here:
10.5%New Jersey:
13.1%
Students in private undergraduate colleges: 66 Here:
30.6%New Jersey:
33.2%