Lomita, CA (California) Houses and Residents
| Lomita: | $802,849 |
| California: | $715,900 |
Mean price in 2022:
Detached houses: $1,221,382
Here: $1,221,382 State: $988,808 Townhouses or other attached units: $872,908
Here: $872,908 State: $838,546 In 3-to-4-unit structures: $1,012,268
Here: $1,012,268 State: $824,253 In 5-or-more-unit structures: $587,533
Here: $587,533 State: $730,996 Mobile homes: $73,534
Here: $73,534 State: $184,506 Occupied boats, RVs, vans, etc.: $9,608
Here: $9,608 State: $204,957
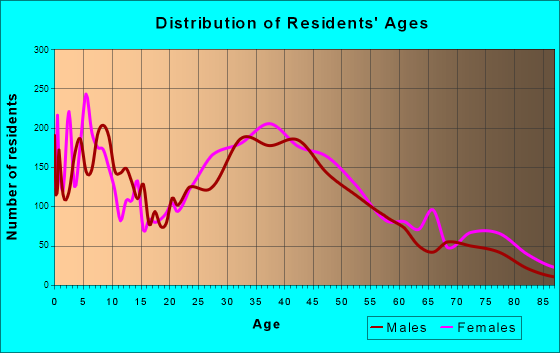
Total population: 20,768 (Urban population: 19,984, Rural population: 0)
Houses: 8,343 (7,982 occupied: 3,693 owner occupied, 4,319 renter occupied)
| % of renters here: | 54% |
| State: | 44% |
Housing density: 4,400 houses/condos per square mile
Median price asked for vacant for-sale houses and condos in 2022 in this county: $1,291,802.
Median contract rent in 2022: $1,697 (lower quartile is $1,258, upper quartile is over $2,000)
Median rent asked for vacant for-rent units in 2022: $1,839
Median gross rent in Lomita, CA in 2022: $1,788
Housing units in Lomita with a mortgage: 2,335 (238 second mortgage, 0 home equity loan, 126 both second mortgage and home equity loan)
Houses without a mortgage: 81
Median household income for houses/condos with a mortgage: $154,195
Median household income for apartments without a mortgage: $70,713
Median monthly housing costs: $1,833
Compare current foreclosures near Lomita, CA:
| Photo | Address | Area | Beds / Baths | Price | Details |
|---|---|---|---|---|---|

|
#1
246th Pl
Lomita, CA 90717
|
960 sq. feet
|
1 baths 2 beds |
show details | |

|
#2
247th St
Lomita, CA 90717
|
576 sq. feet
|
1 baths 2 beds |
show details | |

|
#3
Oak S 6
Lomita, CA 90717
|
1,496 sq. feet
|
3 baths 3 beds |
show details | |

|
#4
248th St
Lomita, CA 90717
|
- sq. feet
|
- baths - beds |
show details | |

|
#5
Narbonne Ave Apt 5
Lomita, CA 90717
|
- sq. feet
|
- baths - beds |
show details | |

|
#6
Avocado St
Lomita, CA 90717
|
- sq. feet
|
- baths - beds |
show details | |

|
#7
Western Ave
Lomita, CA 90717
|
- sq. feet
|
- baths - beds |
show details | |

|
#8
Oak St
Lomita, CA 90717
|
- sq. feet
|
- baths - beds |
show details | |

|
#9
Walnut St
Lomita, CA 90717
|
- sq. feet
|
- baths - beds |
show details | |

|
#10
257th St
Lomita, CA 90717
|
- sq. feet
|
- baths - beds |
show details |
| Photo | Address | Area | Beds / Baths | Price | Details |
|---|---|---|---|---|---|

|
#11
Pacific Coast Hwy Ste 203
Lomita, CA 90717
|
- sq. feet
|
- baths - beds |
show details | |

|
#12
Western Ave # 200
Lomita, CA 90717
|
- sq. feet
|
- baths - beds |
show details | |

|
#13
E 60th St
Los Angeles, CA 90001
|
1,883 sq. feet
|
3 baths 5 beds |
show details | |

|
#14
Redondo Avenue, Units 5-8
Long Beach, CA 90804
|
3,360 sq. feet
|
4 baths 8 beds |
show details | |

|
#15
Mira Mar Ave
Long Beach, CA 90814
|
1,902 sq. feet
|
2 baths 4 beds |
show details | |

|
#16
Dunrobin Ave
Downey, CA 90242
|
3,000 sq. feet
|
4 baths 8 beds |
show details | |

|
#17
Marina City Dr Unit 116
Marina Del Rey, CA 90292
|
1,722 sq. feet
|
2 baths 3 beds |
show details | |

|
#18
6th Ave
Venice, CA 90291
|
3,192 sq. feet
|
3 baths 6 beds |
show details | |

|
#19
Elburg St Unit A
Paramount, CA 90723
|
1,131 sq. feet
|
2 baths 3 beds |
show details | |

|
#20
W Arbor St # 57
Long Beach, CA 90805
|
1,585 sq. feet
|
2 baths 3 beds |
show details |
| Photo | Address | Area | Beds / Baths | Price | Details |
|---|---|---|---|---|---|

|
#21
W 110th St
Inglewood, CA 90303
|
3,481 sq. feet
|
4 baths 6 beds |
show details | |

|
#22
Norwalk Blvd Apt
Hawaiian Gardens, CA 90716
|
800 sq. feet
|
2 baths 1 beds |
show details | |

|
#23
W 82nd St
Los Angeles, CA 90047
|
1,384 sq. feet
|
2 baths 3 beds |
show details | |

|
#24
5th Ave
Los Angeles, CA 90043
|
1,315 sq. feet
|
2 baths 3 beds |
show details | |

|
#25
Brookshire Ave
Downey, CA 90240
|
3,506 sq. feet
|
3 baths 4 beds |
show details | |

|
#26
Cook St
Los Angeles, CA 90061
|
1,204 sq. feet
|
2 baths 4 beds |
show details | |

|
#27
Elderhall Ave
Lakewood, CA 90712
|
1,638 sq. feet
|
2 baths 3 beds |
show details | |

|
#28
Montemalaga Dr
Rancho Palos Verdes, CA 90275
|
2,350 sq. feet
|
3 baths 4 beds |
show details | |

|
#29
S Cabrillo Ave
San Pedro, CA 90731
|
1,682 sq. feet
|
2 baths 4 beds |
show details | |

|
#30
Marbella Ave
Carson, CA 90745
|
1,348 sq. feet
|
2 baths 3 beds |
show details |
| Photo | Address | Area | Beds / Baths | Price | Details |
|---|---|---|---|---|---|

|
#31
Strongs Dr
Venice, CA 90291
|
1,723 sq. feet
|
2 baths 2 beds |
show details | |

|
#32
S Gramercy Pl
Los Angeles, CA 90047
|
1,800 sq. feet
|
2 baths 3 beds |
show details | |

|
#33
E Hatchway St
Compton, CA 90222
|
634 sq. feet
|
1 baths 2 beds |
show details | |

|
#34
W 94th St
Los Angeles, CA 90044
|
1,322 sq. feet
|
2 baths 3 beds |
show details | |

|
#35
Hawaiian Ave
Lakewood, CA 90715
|
1,048 sq. feet
|
1 baths 3 beds |
show details | |

|
#36
E 33rd St
Los Angeles, CA 90011
|
887 sq. feet
|
2 baths 4 beds |
show details | |

|
#37
Ibbetson Ave
Lakewood, CA 90713
|
1,044 sq. feet
|
1 baths 3 beds |
show details | |

|
#38
E Stockwell St
Compton, CA 90222
|
848 sq. feet
|
2 baths 4 beds |
show details | |

|
#39
1829 W 51st St
Los Angeles, CA 90062
|
2,060 sq. feet
|
2 baths 4 beds |
show details | |

|
#40
S Hobart Blvd
Los Angeles, CA 90047
|
1,322 sq. feet
|
1 baths 3 beds |
show details |
| Photo | Address | Area | Beds / Baths | Price | Details |
|---|---|---|---|---|---|

|
#41
Stevens Ave
Culver City, CA 90230
|
1,638 sq. feet
|
2 baths 4 beds |
show details | |

|
#42
S Broadway
Los Angeles, CA 90061
|
1,620 sq. feet
|
3 baths 4 beds |
show details | |

|
#43
N Chester Ave
Compton, CA 90221
|
895 sq. feet
|
1 baths 2 beds |
show details | |

|
#44
E 7th St
Long Beach, CA 90813
|
2,456 sq. feet
|
4 baths 6 beds |
show details | |

|
#45
Playa Vista Dr Apt 15
Los Angeles, CA 90094
|
1,920 sq. feet
|
3 baths 1 beds |
show details | |

|
#46
Sunlight Pl
Los Angeles, CA 90016
|
1,932 sq. feet
|
2 baths 3 beds |
show details | |

|
#47
Josephine St
Lynwood, CA 90262
|
1,414 sq. feet
|
1 baths 3 beds |
show details | |

|
#48
Molette St
Norwalk, CA 90650
|
1,082 sq. feet
|
1 baths 4 beds |
show details | |

|
#49
Lees Ave
Long Beach, CA 90808
|
887 sq. feet
|
1 baths 2 beds |
show details | |

|
Check over 1 million property listings on Foreclosure.com!
|
browse all offers | |||

Latest news about housing in Lomita, CA collected exclusively by city-data.com from local newspapers, TV, and radio stations


Median year apartment built: 1965
Household type by relationship:
Households: 20,213- Male householders: 4,068 (1,025 living alone), Female householders: 3,650 (1,131 living alone)
3,604 spouses (3,572 opposite-sex spouses), 464 unmarried partners, (464 opposite-sex unmarried partners), 5,414 children (5,096 natural, 207 adopted, 111 stepchildren), 320 grandchildren, 360 brothers or sisters, 731 parents, 7 foster children, 631 other relatives, 756 non-relatives
- In group quarters: 201
Size of family households: 2,289 2-persons, 1,178 3-persons, 1,070 4-persons, 564 5-persons, 111 6-persons, 38 7-or-more-persons.
Size of nonfamily households: 2,313 1-person, 382 2-persons, 37 3-persons, 54 4-persons, 5 6-persons.
2,346 married couples with children.
1,005 single-parent households (229 men, 776 women).
62.5% of residents of Lomita speak English at home.
21.4% of residents speak Spanish at home (64% speak English very well, 14% speak English well, 14% speak English not well, 8% don't speak English at all).
4.6% of residents speak other Indo-European language at home (73% speak English very well, 18% speak English well, 8% speak English not well).
10.5% of residents speak Asian or Pacific Island language at home (62% speak English very well, 25% speak English well, 12% speak English not well).
1.5% of residents speak other language at home (53% speak English very well, 30% speak English well, 16% speak English not well).
Foreign born population: 5,485 (27.1%)
(59.9% of them are naturalized citizens)
| Here: | 5.5 |
| State: | 6.0 |
| Here: | 4.0 |
| State: | 3.9 |

- Bedrooms in owner-occupied houses and condos in Lomita, California
- 115no bedroom
- 2021 bedroom
- 8452 bedrooms
- 1,8963 bedrooms
- 5904 bedrooms
- 465+ bedrooms

- Bedrooms in renter-occupied apartments in Lomita, California
- 193no bedroom
- 9841 bedroom
- 2,1322 bedrooms
- 8723 bedrooms
- 1074 bedrooms
- 315+ bedrooms

- Cars and other vehicles available in Lomita in owner-occupied houses/condos
- 108no vehicle
- 9311 vehicle
- 1,5992 vehicles
- 6153 vehicles
- 2724 vehicles
- 1695+ vehicles

- Cars and other vehicles available in Lomita in renter-occupied apartments
- 368no vehicle
- 1,8611 vehicle
- 1,3942 vehicles
- 5503 vehicles
- 1334 vehicles
- 135+ vehicles

- Rooms in owner-occupied houses in Lomita, California
- 941 room
- 1352 rooms
- 2583 rooms
- 6574 rooms
- 5785 rooms
- 9146 rooms
- 5287 rooms
- 3348 rooms
- 1959+ rooms

- Rooms in renter-occupied apartments in Lomita, California
- 1861 room
- 3072 rooms
- 9363 rooms
- 1,5454 rooms
- 9645 rooms
- 1616 rooms
- 827 rooms
- 1068 rooms
- 339+ rooms


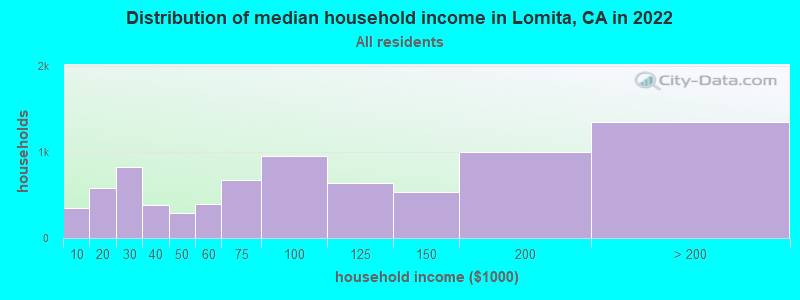
Lomita, CA household income distribution

- 353Less than $10,000
- 578$10,000 to $19,999
- 828$20,000 to $29,999
- 390$30,000 to $39,999
- 287$40,000 to $49,999
- 392$50,000 to $59,999
- 676$60,000 to $74,999
- 952$75,000 to $99,999
- 639$100,000 to $124,999
- 539$125,000 to $149,999
- 1,005$150,000 to $199,999
- 1,351$200,000 or more
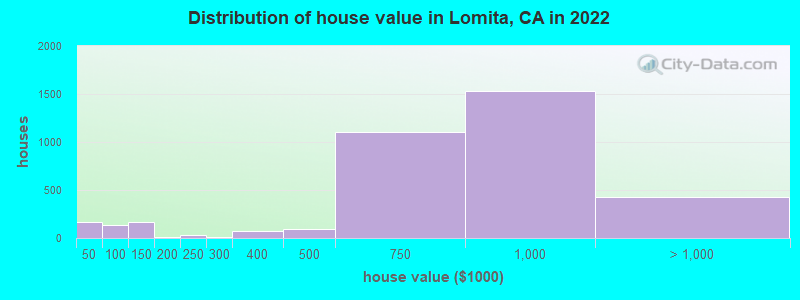
Home value of owner - occupied houses in 2022 in Lomita, CA
-
- 108Less than $10,000
- 53$25,000 to $29,999
- 6$40,000 to $49,999
- 22$50,000 to $59,999
- 27$70,000 to $79,999
- 31$80,000 to $89,999
- 46$90,000 to $99,999
- 167$100,000 to $124,999
- 4$150,000 to $174,999
- 4$175,000 to $199,999
- 34$200,000 to $249,999
- 5$250,000 to $299,999
- 68$300,000 to $399,999
- 89$400,000 to $499,999
- 1,103$500,000 to $749,999
- 1,531$750,000 to $999,999
- 360$1,000,000 to $1,499,999
- 65$1,500,000 to $1,999,999
Rent paid by renters in 2022 in Lomita, CA
-
- 11Less than $100
- 3$100 to $149
- 81$150 to $199
- 45$200 to $249
- 120$250 to $299
- 6$300 to $349
- 16$350 to $399
- 52$400 to $449
- 38$450 to $499
- 9$500 to $549
- 97$550 to $599
- 55$600 to $649
- 7$700 to $749
- 21$750 to $799
- 52$800 to $899
- 88$900 to $999
- 294$1,000 to $1,249
- 486$1,250 to $1,499
- 1,568$1,500 to $1,999
- 741$2,000 to $2,499
- 248$2,500 to $2,999
- 62$3,000 to $3,499
- 99$3,500 or more
- 145No cash rent


Percentage of workers working in this county: 96.8%
Number of people working at home: 1,597 (15.0% of all workers)
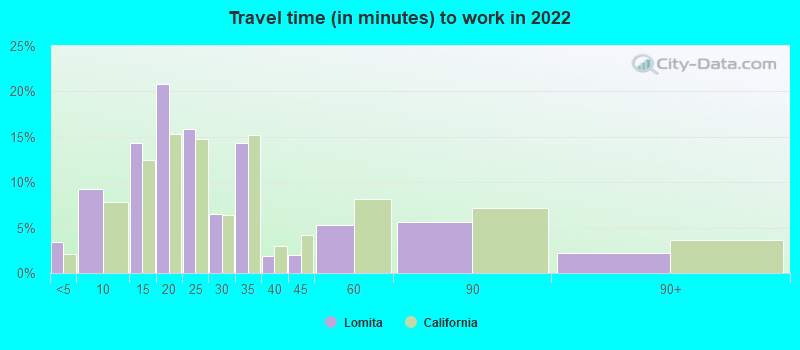
Travel time to work (commute)
- Less than 5 minutes: 391
- 5 to 9 minutes: 883
- 10 to 14 minutes: 1,009
- 15 to 19 minutes: 1,501
- 20 to 24 minutes: 1,608
- 25 to 29 minutes: 431
- 30 to 34 minutes: 1,163
- 35 to 39 minutes: 284
- 40 to 44 minutes: 339
- 45 to 59 minutes: 651
- 60 to 89 minutes: 509
- 90 or more minutes: 309
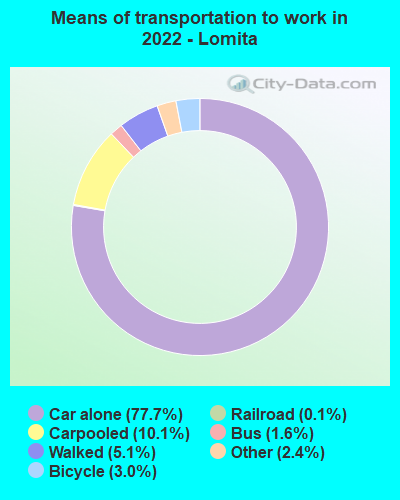
Means of transportation to work:
- Drove a car alone: 3,334 (57.9%)
- Carpooled: 480 (8.3%)
- Bus: 61 (1.1%)
- Light rail, streetcar or trolley: 2 (0.0%)
- Taxi: 114 (2.0%)
- Bicycle: 133 (2.3%)
- Walked: 235 (4.1%)
- Worked at home: 1,597 (27.7%)

- Unemployment by race in 2022
- Unemployment rate for White non-Hispanic residents
- 2.7%Males
- 3.2%Females
- Unemployment rate for Black residents
- 12.2%Males
- Unemployment rate for Asian residents
- 1.3%Males
- 3.1%Females
- Unemployment rate for other race residents
- 0.3%Males
- 3.6%Females
- Unemployment rate for two or more race residents
- 2.2%Males
- 6.4%Females
- Unemployment rate for Hispanic or Latino residents
- 2.5%Males
- 3.9%Females

- Year of entry for the foreign-born population in Lomita, California
- 1,1882010 or later
- 1,0862000 to 2009
- 1,1281990 to 1999
- 1,3491980 to 1989
- 8331970 to 1979
- 608Before 1970

First ancestries reported:
- English: 382 (3.2%)
- Irish: 330 (2.8%)
- German: 309 (2.6%)
- Italian: 302 (2.5%)
- Polish: 264 (2.2%)
- Assyrian: 229 (1.9%)
- American: 148 (1.2%)
- Scottish: 129 (1.1%)
- Croatian: 111 (0.9%)
- Norwegian: 81 (0.7%)
- Russian: 65 (0.5%)
- Canadian: 59 (0.5%)
- Dutch: 54 (0.5%)
- European: 48 (0.4%)
- African: 45 (0.4%)
- Nigerian: 34 (0.3%)
- Northern European: 32 (0.3%)
- South African: 31 (0.3%)
- Finnish: 29 (0.2%)
- Greek: 24 (0.2%)
- Turkish: 24 (0.2%)
- French: 21 (0.2%)
- Welsh: 19 (0.2%)
- Serbian: 18 (0.2%)
- Swedish: 18 (0.2%)
- Moroccan: 14 (0.1%)
- Czech: 14 (0.1%)
- Austrian: 12 (0.1%)
- Romanian: 12 (0.1%)
- Egyptian: 7 (0.06%)
- French Canadian: 6 (0.05%)
- Iranian: 4 (0.03%)
- Yugoslavian: 3 (0.03%)
- Hungarian: 2 (0.02%)
- British: 1 (0.01%)
Most common places of birth for foreign-born residents (%):
| Lomita: | 30.9% (1,696) |
| California: | 37.2% (3,881,193) |
| Lomita: | 12.1% (661) |
| California: | 7.8% (818,297) |
| Lomita: | 7.9% (434) |
| California: | 1.0% (103,575) |
| Lomita: | 6.4% (352) |
| California: | 3.0% (315,248) |
| Lomita: | 5.7% (314) |
| California: | 5.2% (539,184) |
| Lomita: | 3.4% (188) |
| California: | 0.7% (74,025) |
| Lomita: | 3.0% (165) |
| California: | 2.0% (206,004) |
| Lomita: | 2.8% (155) |
| California: | 1.2% (127,477) |
| Lomita: | 2.2% (118) |
| California: | 0.2% (20,614) |
| Lomita: | 1.8% (98) |
| California: | 0.5% (55,249) |
| Lomita: | 1.7% (94) |
| California: | 6.6% (684,672) |
| Lomita: | 1.6% (89) |
| California: | 0.5% (51,974) |
Place of birth for U.S.-born residents:
- This state: 11,638
- Other state: 2,745
- Northeast: 822
- Midwest: 822
- South: 574
- West: 511
92.6% of Lomita residents lived in the same house 1 years ago.
Out of people who lived in different houses, 44.3% lived in this county.
Out of people who lived in different counties, 77.9% lived in California.
| Lomita: | 92.6% |
| State average: | 88.9% |
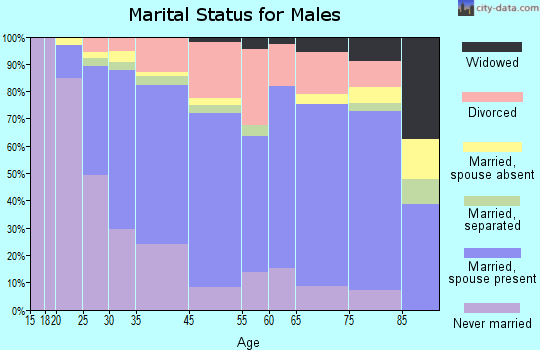
Education attainment for males 25 years and older:
- No schooling: 149
- Nursery to 4th grade: 0
- 5th and 6th grade: 203
- 7th and 8th grade: 93
- 9th grade: 158
- 10th grade: 64
- 11th grade: 54
- 12th grade, no diploma: 281
- High school graduate (or equivalency): 1,621
- Less than 1 year of college: 255
- Some college more than 1 year, no degree: 995
- Associate degree: 622
- Bachelor's degree: 1,769
- Master's degree: 616
- Professional school degree: 156
- Doctorate degree: 103

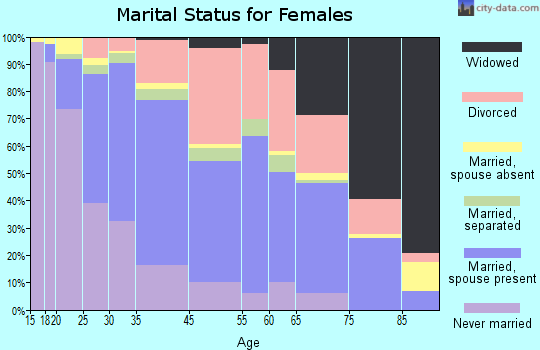
Education attainment for females 25 years and older:
- No schooling: 141
- Nursery to 4th grade: 151
- 5th and 6th grade: 96
- 7th and 8th grade: 92
- 9th grade: 0
- 10th grade: 38
- 11th grade: 61
- 12th grade, no diploma: 152
- High school graduate (or equivalency): 1,541
- Less than 1 year of college: 367
- Some college more than 1 year, no degree: 1,072
- Associate degree: 578
- Bachelor's degree: 2,208
- Master's degree: 812
- Professional school degree: 251
- Doctorate degree: 24

Housing units in structures:
- One, detached: 4,480
- One, attached: 526
- Two: 100
- 3 or 4: 379
- 5 to 9: 636
- 10 to 19: 395
- 20 to 49: 783
- 50 or more: 578
- Mobile homes: 361
- Boats, RVs, vans, etc.: 102
Median worth of mobile homes: $100,030
Housing units lacking complete kitchen facilities in 2022: 2.8%
House/condo owner moved in on average 13 years ago
Renter moved in on average 6 years ago

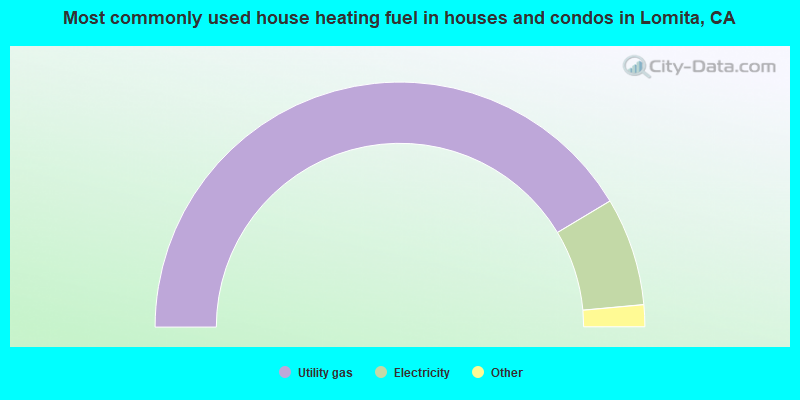
- 82.9%Utility gas
- 14.3%Electricity
- 2.0%No fuel used
- 0.5%Bottled, tank, or LP gas
- 0.2%Fuel oil, kerosene, etc.
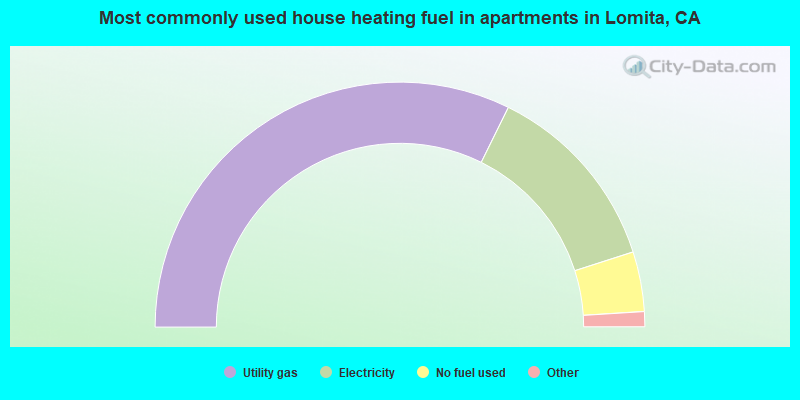
- 64.6%Utility gas
- 25.5%Electricity
- 7.9%No fuel used
- 1.0%Bottled, tank, or LP gas
- 0.6%Other fuel
- 0.3%Wood
Private vs. public school enrollment:
| Here: | 18.2% |
| California: | 10.5% |
| Here: | 17.0% |
| California: | 8.5% |
| Here: | 23.9% |
| California: | 15.9% |


