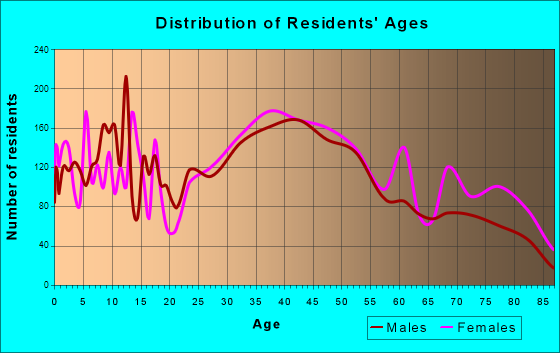
Lynbrook, NY (New York) Houses and Residents
| Lynbrook: | $606,058 |
| New York: | $400,400 |
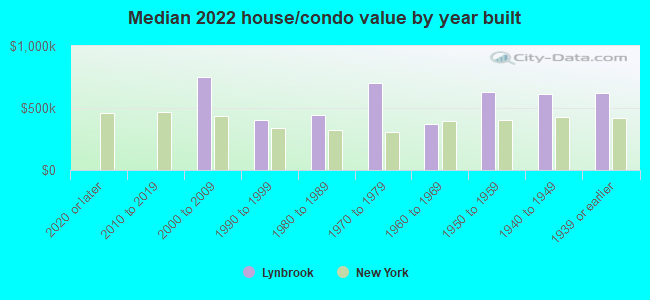
Mean price in 2022:
Detached houses: $639,399
Here: $639,399 State: $476,719 Townhouses or other attached units: $459,593
Here: $459,593 State: $699,270 In 2-unit structures: $648,768
Here: $648,768 State: $713,077 In 3-to-4-unit structures: $367,566
Here: $367,566 State: $764,568 In 5-or-more-unit structures: $430,112
Here: $430,112 State: $912,009
Total population: 19,558 (All urban)
Houses: 7,459 (7,064 occupied: 5,215 owner occupied, 1,836 renter occupied)
| % of renters here: | 26% |
| State: | 46% |
Housing density: 3,731 houses/condos per square mile
Median price asked for vacant for-sale houses and condos in 2022: $377,307.
Median contract rent in 2022: $1,795 (lower quartile is $1,408, upper quartile is over $2,000)
Median rent asked for vacant for-rent units in 2022: $3,876
Median gross rent in Lynbrook, NY in 2022: $1,895
Housing units in Lynbrook with a mortgage: 3,342 (335 second mortgage, 0 home equity loan, 269 both second mortgage and home equity loan)
Houses without a mortgage: 51
Median household income for houses/condos with a mortgage: $176,132
Median household income for apartments without a mortgage: $101,053
Median monthly housing costs: $2,314
Compare current foreclosures near Lynbrook, NY:
| Photo | Address | Area | Beds / Baths | Price | Details |
|---|---|---|---|---|---|

|
#1
Hudson Ct
Lynbrook, NY 11563
|
1,389 sq. feet
|
2 baths 3 beds |
$549,900
|
show details |

|
#2
Lewis Pl
Lynbrook, NY 11563
|
1,693 sq. feet
|
2 baths 3 beds |
show details | |

|
#3
2nd St
Lynbrook, NY 11563
|
2,419 sq. feet
|
2 baths 3 beds |
show details | |

|
#4
Peninsula Blvd
Lynbrook, NY 11563
|
1,387 sq. feet
|
2 baths - beds |
show details | |

|
#5
Peterson Pl
Lynbrook, NY 11563
|
2,278 sq. feet
|
1 baths - beds |
show details | |

|
#6
Starks Pl
Lynbrook, NY 11563
|
1,442 sq. feet
|
1 baths - beds |
show details | |

|
#7
Atlantic Ave
Lynbrook, NY 11563
|
1,100 sq. feet
|
2 baths - beds |
show details | |

|
#8
Washington Ave
Lynbrook, NY 11563
|
1,938 sq. feet
|
1 baths - beds |
show details | |

|
#9
Peninsula Blvd
Lynbrook, NY 11563
|
1,418 sq. feet
|
2 baths - beds |
show details | |

|
#10
Piccadilly Dwns
Lynbrook, NY 11563
|
1,301 sq. feet
|
1 baths - beds |
show details |
| Photo | Address | Area | Beds / Baths | Price | Details |
|---|---|---|---|---|---|

|
#11
Clinton Ave
Lynbrook, NY 11563
|
2,901 sq. feet
|
2 baths - beds |
show details | |

|
#12
Wright Ave
Lynbrook, NY 11563
|
2,153 sq. feet
|
3 baths - beds |
show details | |

|
#13
Forest Ave # 2d
Lynbrook, NY 11563
|
2,125 sq. feet
|
2 baths - beds |
show details | |

|
#14
Carol Ct
Lynbrook, NY 11563
|
1,517 sq. feet
|
2 baths - beds |
show details | |

|
#15
Norwich Ave
Lynbrook, NY 11563
|
1,568 sq. feet
|
1 baths - beds |
show details | |

|
#16
Farnum S A
Lynbrook, NY 11563
|
- sq. feet
|
- baths - beds |
show details | |

|
#17
Atlantic Ave Apt C6
Lynbrook, NY 11563
|
- sq. feet
|
- baths - beds |
show details | |

|
#18
Oliver Pl
Lynbrook, NY 11563
|
- sq. feet
|
- baths - beds |
show details | |

|
#19
Sunrise Hwy
Lynbrook, NY 11563
|
- sq. feet
|
- baths - beds |
show details | |

|
#20
Broadway Apt B19
Lynbrook, NY 11563
|
- sq. feet
|
- baths - beds |
show details |
| Photo | Address | Area | Beds / Baths | Price | Details |
|---|---|---|---|---|---|

|
#21
Duryea Pl Apt 2c
Lynbrook, NY 11563
|
- sq. feet
|
- baths - beds |
show details | |

|
#22
Hempstead Ave Apt 3h
Lynbrook, NY 11563
|
- sq. feet
|
- baths - beds |
show details | |

|
#23
Merrick Rd
Lynbrook, NY 11563
|
- sq. feet
|
- baths - beds |
show details | |

|
#24
Charles St Apt 1
Lynbrook, NY 11563
|
- sq. feet
|
- baths - beds |
show details | |

|
#25
Union Ave
Lynbrook, NY 11563
|
- sq. feet
|
- baths - beds |
show details | |

|
#26
Franklin St
Elmont, NY 11003
|
1,116 sq. feet
|
2 baths 2 beds |
$679,900
|
show details |

|
#27
2nd Ave # 5c
New York, NY 10029
|
550 sq. feet
|
1 baths 1 beds |
$448,900
|
show details |

|
#28
Tulip Ave # Gl2
Floral Park, NY 11001
|
1,200 sq. feet
|
1 baths 2 beds |
$409,900
|
show details |

|
#29
Merle Ave
Oceanside, NY 11572
|
885 sq. feet
|
1 baths 2 beds |
$450,000
|
show details |

|
#30
E 32nd St Apt C7
Brooklyn, NY 11210
|
670 sq. feet
|
1 baths 1 beds |
$299,900
|
show details |
| Photo | Address | Area | Beds / Baths | Price | Details |
|---|---|---|---|---|---|

|
#31
Norcross St
Rockville Centre, NY 11570
|
1,612 sq. feet
|
1 baths 3 beds |
$707,200
|
show details |

|
#32
Dartmouth St
Westbury, NY 11590
|
1,772 sq. feet
|
1 baths 4 beds |
$499,200
|
show details |

|
#33
Curtis Ave
Carle Place, NY 11514
|
1,623 sq. feet
|
1 baths 3 beds |
$674,900
|
show details |

|
#34
Hawthorne Ave
Uniondale, NY 11553
|
1,371 sq. feet
|
2 baths 4 beds |
$499,900
|
show details |

|
#35
96th St
Ozone Park, NY 11417
|
1,520 sq. feet
|
2 baths 3 beds |
$729,900
|
show details |

|
#36
Oceanside Pkwy
Oceanside, NY 11572
|
1,650 sq. feet
|
2 baths 2 beds |
$545,000
|
show details |

|
#37
177th St
Jamaica, NY 11433
|
1,156 sq. feet
|
1 baths 3 beds |
$450,000
|
show details |

|
#38
Evans Ave
Elmont, NY 11003
|
1,352 sq. feet
|
2 baths 3 beds |
$719,900
|
show details |

|
#39
E 73rd St
New York, NY 10021
|
1,253 sq. feet
|
2 baths 2 beds |
$715,000
|
show details |

|
#40
Martin Ave
Hempstead, NY 11550
|
1,479 sq. feet
|
2 baths 4 beds |
$669,900
|
show details |
| Photo | Address | Area | Beds / Baths | Price | Details |
|---|---|---|---|---|---|

|
#41
Wendell St Apt 19f
Hempstead, NY 11550
|
1,125 sq. feet
|
2 baths 2 beds |
$294,500
|
show details |

|
#42
Bellport Ave
Wantagh, NY 11793
|
1,785 sq. feet
|
3 baths 5 beds |
$739,900
|
show details |

|
#43
237th Street
Elmont, NY 11003
|
1,323 sq. feet
|
2 baths 4 beds |
$468,000
|
show details |

|
#44
E Marshall St
Hempstead, NY 11550
|
1,210 sq. feet
|
2 baths 4 beds |
$479,900
|
show details |

|
#45
90th St Apt 5d
Jackson Heights, NY 11372
|
1,000 sq. feet
|
1 baths 2 beds |
$289,900
|
show details |

|
#46
17th Ave 1st Floor
Whitestone, NY 11357
|
610 sq. feet
|
1 baths 1 beds |
$229,900
|
show details |

|
#47
A Somers St
Brooklyn, NY 11233
|
1,830 sq. feet
|
2 baths 4 beds |
$749,900
|
show details |

|
#48
Sandy Hill Rd
Oyster Bay, NY 11771
|
9,672 sq. feet
|
6 baths 9 beds |
$1,394,900
|
show details |

|
#49
Cedar Rd
Inwood, NY 11096
|
- sq. feet
|
2 baths 4 beds |
$699,000
|
show details |

|
Check over 1 million property listings on Foreclosure.com!
|
browse all offers | |||

Latest news about housing in Lynbrook, NY collected exclusively by city-data.com from local newspapers, TV, and radio stations


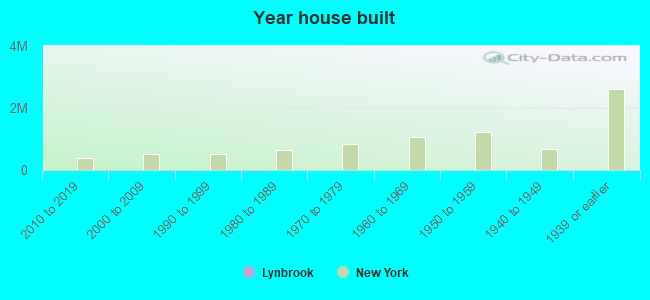
Median year apartment built: 1960
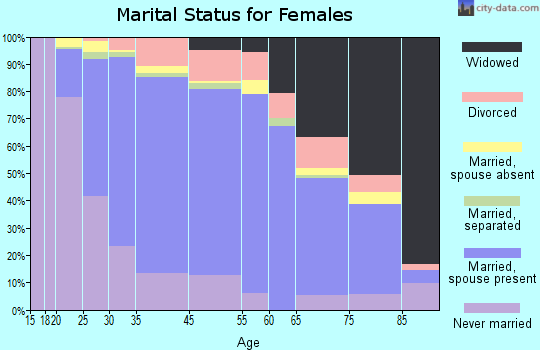
Household type by relationship:
Households: 20,219- Male householders: 3,688 (651 living alone), Female householders: 3,314 (1,008 living alone)
4,126 spouses (4,109 opposite-sex spouses), 244 unmarried partners, (230 opposite-sex unmarried partners), 6,378 children (6,036 natural, 84 adopted, 257 stepchildren), 242 grandchildren, 264 brothers or sisters, 716 parents, 0 foster children, 663 other relatives, 502 non-relatives
- In group quarters: 77
Size of family households: 1,764 2-persons, 1,374 3-persons, 1,076 4-persons, 547 5-persons, 312 6-persons, 83 7-or-more-persons.
Size of nonfamily households: 1,730 1-person, 132 2-persons, 5 3-persons, 17 4-persons.
2,977 married couples with children.
620 single-parent households (92 men, 528 women).
73.6% of residents of Lynbrook speak English at home.
13.1% of residents speak Spanish at home (77% speak English very well, 9% speak English well, 10% speak English not well, 4% don't speak English at all).
10.0% of residents speak other Indo-European language at home (51% speak English very well, 13% speak English well, 14% speak English not well, 22% don't speak English at all).
2.5% of residents speak Asian or Pacific Island language at home (74% speak English very well, 19% speak English well, 7% speak English not well).
1.0% of residents speak other language at home (71% speak English very well, 8% speak English well, 21% speak English not well).
Foreign born population: 3,597 (17.8%)
(70.7% of them are naturalized citizens)
| Here: | 6.7 |
| State: | 6.3 |
| Here: | 4.0 |
| State: | 3.8 |
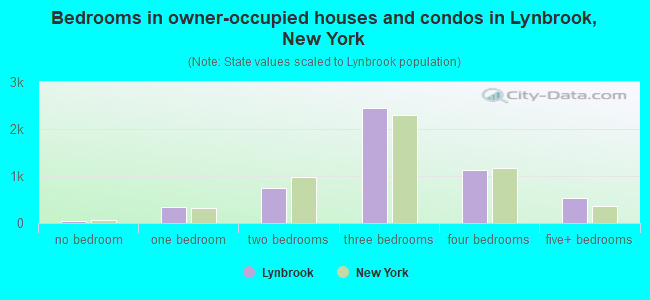
- Bedrooms in owner-occupied houses and condos in Lynbrook, New York
- 32no bedroom
- 3421 bedroom
- 7492 bedrooms
- 2,4403 bedrooms
- 1,1244 bedrooms
- 5285+ bedrooms
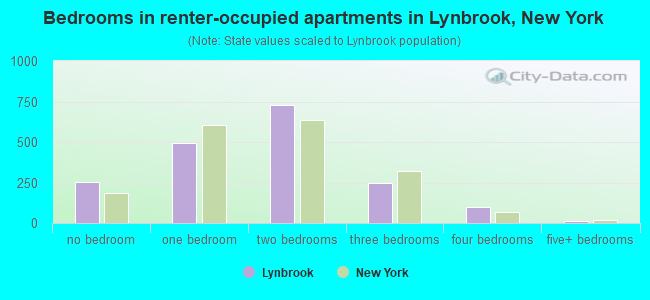
- Bedrooms in renter-occupied apartments in Lynbrook, New York
- 252no bedroom
- 4941 bedroom
- 7302 bedrooms
- 2503 bedrooms
- 994 bedrooms
- 115+ bedrooms
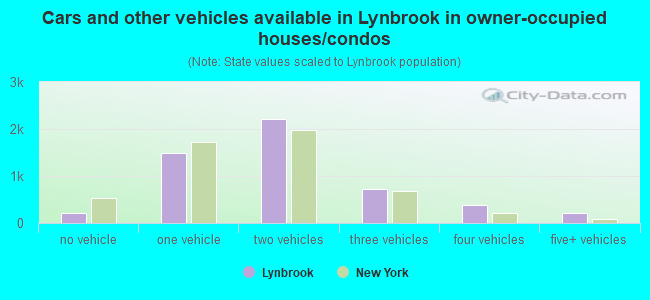
- Cars and other vehicles available in Lynbrook in owner-occupied houses/condos
- 205no vehicle
- 1,4801 vehicle
- 2,2212 vehicles
- 7143 vehicles
- 3874 vehicles
- 2095+ vehicles
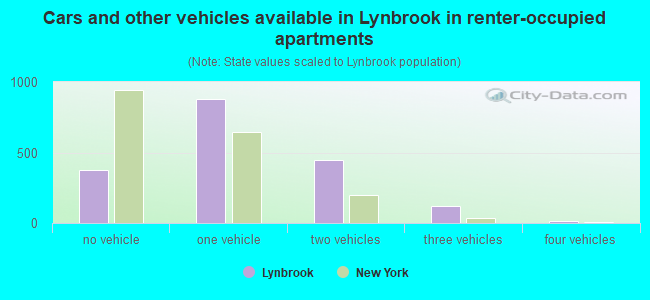
- Cars and other vehicles available in Lynbrook in renter-occupied apartments
- 378no vehicle
- 8771 vehicle
- 4482 vehicles
- 1203 vehicles
- 134 vehicles
- 05+ vehicles
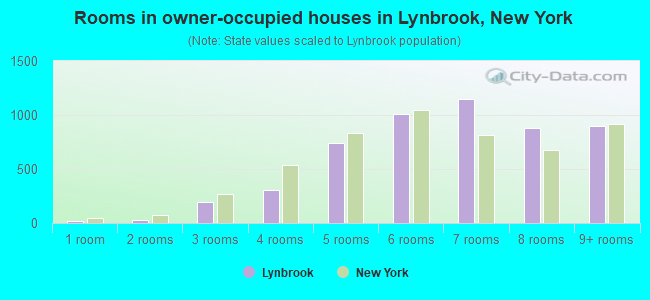
- Rooms in owner-occupied houses in Lynbrook, New York
- 191 room
- 272 rooms
- 1953 rooms
- 3014 rooms
- 7405 rooms
- 1,0106 rooms
- 1,1507 rooms
- 8768 rooms
- 8989+ rooms
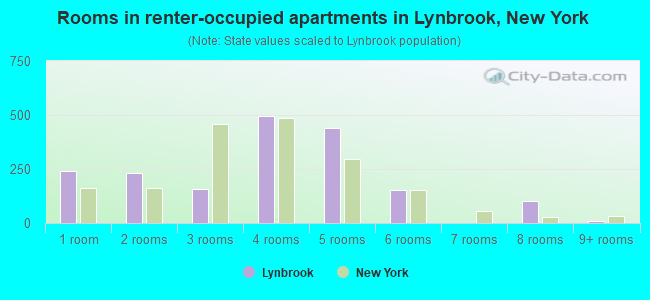
- Rooms in renter-occupied apartments in Lynbrook, New York
- 2421 room
- 2322 rooms
- 1563 rooms
- 4964 rooms
- 4425 rooms
- 1546 rooms
- 07 rooms
- 1028 rooms
- 119+ rooms
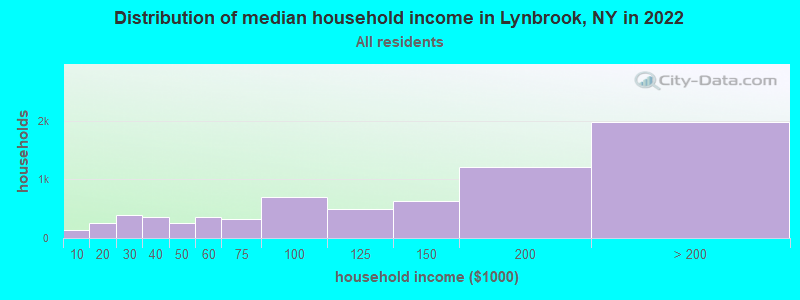
Lynbrook, NY household income distribution

- 137Less than $10,000
- 248$10,000 to $19,999
- 384$20,000 to $29,999
- 357$30,000 to $39,999
- 260$40,000 to $49,999
- 355$50,000 to $59,999
- 325$60,000 to $74,999
- 700$75,000 to $99,999
- 491$100,000 to $124,999
- 629$125,000 to $149,999
- 1,203$150,000 to $199,999
- 1,975$200,000 or more
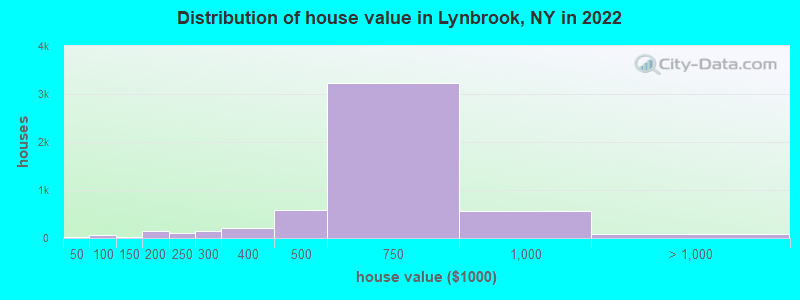
Home value of owner - occupied houses in 2022 in Lynbrook, NY
-
- 24Less than $10,000
- 7$25,000 to $29,999
- 1$50,000 to $59,999
- 33$60,000 to $69,999
- 11$70,000 to $79,999
- 9$80,000 to $89,999
- 1$100,000 to $124,999
- 18$125,000 to $149,999
- 27$150,000 to $174,999
- 110$175,000 to $199,999
- 97$200,000 to $249,999
- 140$250,000 to $299,999
- 198$300,000 to $399,999
- 588$400,000 to $499,999
- 3,228$500,000 to $749,999
- 567$750,000 to $999,999
- 20$1,000,000 to $1,499,999
- 72$2,000,000 or more
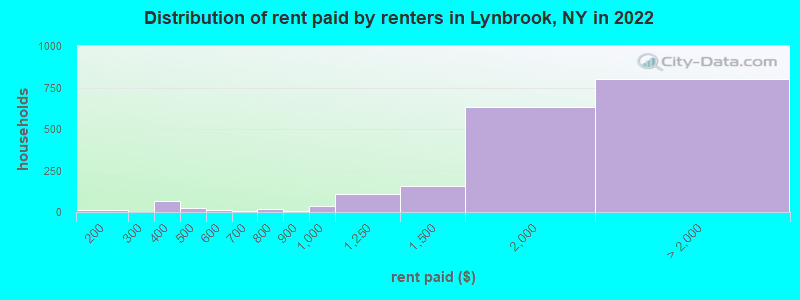
Rent paid by renters in 2022 in Lynbrook, NY
-
- 9$150 to $199
- 13$300 to $349
- 54$350 to $399
- 26$400 to $449
- 15$550 to $599
- 5$650 to $699
- 21$700 to $749
- 8$800 to $899
- 36$900 to $999
- 109$1,000 to $1,249
- 154$1,250 to $1,499
- 634$1,500 to $1,999
- 296$2,000 to $2,499
- 272$2,500 to $2,999
- 108$3,500 or more
- 124No cash rent
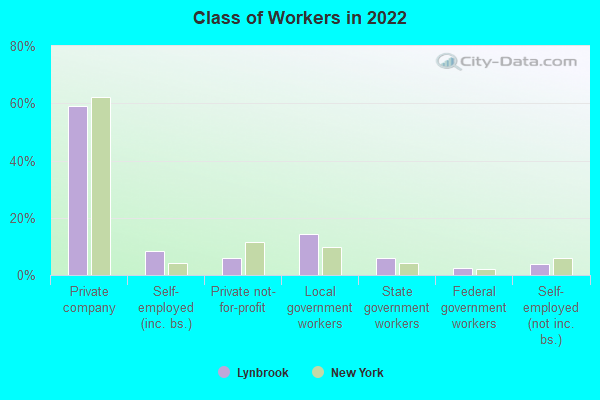
Percentage of workers working in this county: 58.5%
Number of people working at home: 1,683 (16.0% of all workers)
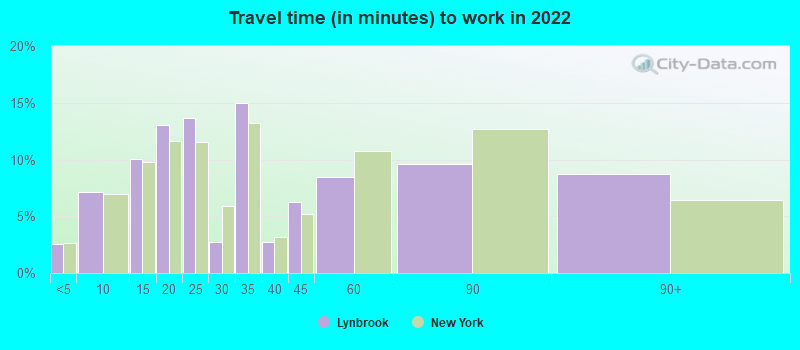
Travel time to work (commute)
- Less than 5 minutes: 101
- 5 to 9 minutes: 403
- 10 to 14 minutes: 881
- 15 to 19 minutes: 926
- 20 to 24 minutes: 1,025
- 25 to 29 minutes: 463
- 30 to 34 minutes: 1,097
- 35 to 39 minutes: 209
- 40 to 44 minutes: 201
- 45 to 59 minutes: 1,220
- 60 to 89 minutes: 1,624
- 90 or more minutes: 743
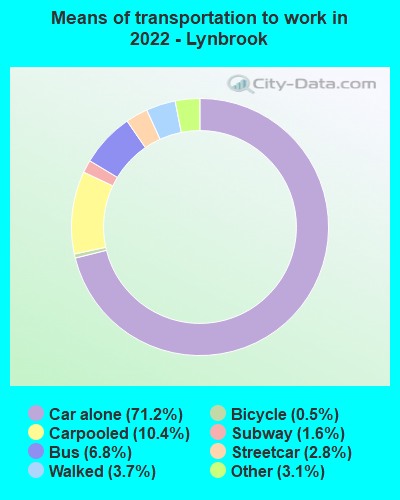
Means of transportation to work:
- Drove a car alone: 5,010 (57.5%)
- Carpooled: 713 (8.2%)
- Bus: 462 (5.3%)
- Subway or elevated rail: 171 (2.0%)
- Long-distance train or commuter rail: 97 (1.1%)
- Taxi: 317 (3.6%)
- Bicycle: 52 (0.6%)
- Walked: 279 (3.2%)
- Worked at home: 1,683 (19.3%)
- Unemployment by race in 2022
- Unemployment rate for White non-Hispanic residents
- 2.4%Males
- 6.5%Females
- Unemployment rate for Black residents
- 2.0%Females
- Unemployment rate for Asian residents
- 3.5%Males
- Unemployment rate for two or more race residents
- 8.3%Females
- Unemployment rate for Hispanic or Latino residents
- 3.1%Females
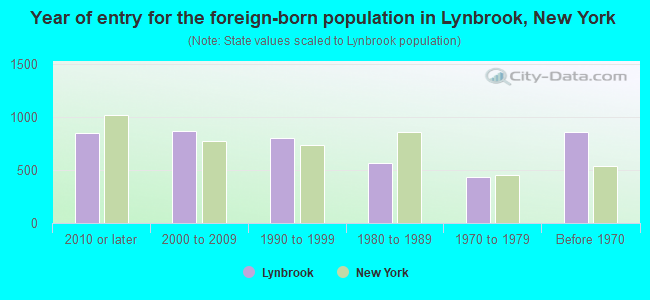
- Year of entry for the foreign-born population in Lynbrook, New York
- 8532010 or later
- 8712000 to 2009
- 8041990 to 1999
- 5701980 to 1989
- 4311970 to 1979
- 862Before 1970
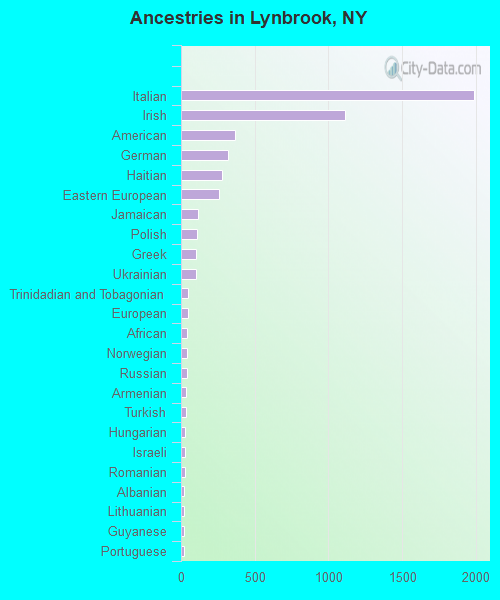
First ancestries reported:
- Italian: 1,990 (21.5%)
- Irish: 1,112 (12.0%)
- American: 364 (3.9%)
- German: 316 (3.4%)
- Haitian: 277 (3.0%)
- Eastern European: 261 (2.8%)
- Jamaican: 116 (1.3%)
- Polish: 110 (1.2%)
- Greek: 103 (1.1%)
- Ukrainian: 99 (1.1%)
- Trinidadian and Tobagonian: 50 (0.5%)
- European: 46 (0.5%)
- African: 44 (0.5%)
- Norwegian: 39 (0.4%)
- Russian: 38 (0.4%)
- Armenian: 34 (0.4%)
- Turkish: 34 (0.4%)
- Hungarian: 29 (0.3%)
- Israeli: 28 (0.3%)
- Romanian: 26 (0.3%)
- Albanian: 21 (0.2%)
- Lithuanian: 20 (0.2%)
- Guyanese: 19 (0.2%)
- Portuguese: 19 (0.2%)
- Finnish: 13 (0.1%)
- Belizean: 9 (0.10%)
- Austrian: 7 (0.08%)
- British: 5 (0.05%)
- Czech: 5 (0.05%)
Most common places of birth for foreign-born residents (%):
| Lynbrook: | 17.9% (623) |
| New York: | 1.4% (62,442) |
| Lynbrook: | 7.8% (272) |
| New York: | 1.8% (81,374) |
| Lynbrook: | 6.5% (227) |
| New York: | 1.2% (54,759) |
| Lynbrook: | 5.3% (184) |
| New York: | 0.1% (5,566) |
| Lynbrook: | 4.9% (171) |
| New York: | 0.3% (11,831) |
| Lynbrook: | 4.8% (166) |
| New York: | 2.8% (126,936) |
| Lynbrook: | 4.7% (162) |
| New York: | 2.0% (91,070) |
| Lynbrook: | 3.1% (107) |
| New York: | 3.5% (158,432) |
| Lynbrook: | 2.9% (100) |
| New York: | 2.5% (111,920) |
| Lynbrook: | 2.8% (99) |
| New York: | 0.6% (26,772) |
| Lynbrook: | 2.8% (98) |
| New York: | 0.2% (8,010) |
| Lynbrook: | 2.7% (95) |
| New York: | 9.1% (410,910) |
| Lynbrook: | 2.7% (94) |
| New York: | 2.0% (91,428) |
| Lynbrook: | 2.1% (72) |
| New York: | 3.9% (177,448) |
| Lynbrook: | 2.0% (70) |
| New York: | 1.4% (65,102) |
| Lynbrook: | 1.9% (65) |
| New York: | 1.2% (55,571) |
| Lynbrook: | 1.6% (54) |
| New York: | 5.0% (227,557) |
Place of birth for U.S.-born residents:
- This state: 14,966
- Other state: 1,046
- Northeast: 332
- Midwest: 206
- South: 285
- West: 233
89.7% of Lynbrook residents lived in the same house 1 years ago.
Out of people who lived in different houses, 22.2% lived in this county.
Out of people who lived in different counties, 87.4% lived in New York.
| Lynbrook: | 89.7% |
| State average: | 89.6% |
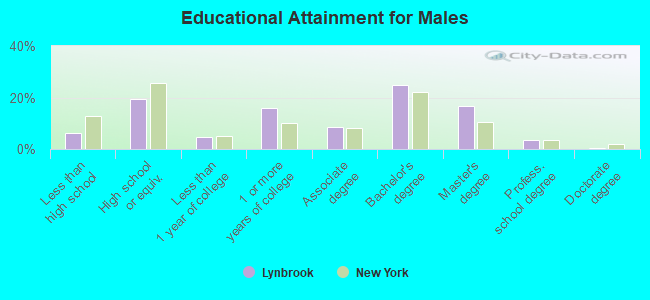
Education attainment for males 25 years and older:
- No schooling: 75
- Nursery to 4th grade: 135
- 5th and 6th grade: 59
- 7th and 8th grade: 31
- 9th grade: 16
- 10th grade: 25
- 11th grade: 17
- 12th grade, no diploma: 75
- High school graduate (or equivalency): 1,344
- Less than 1 year of college: 310
- Some college more than 1 year, no degree: 1,086
- Associate degree: 601
- Bachelor's degree: 1,727
- Master's degree: 1,150
- Professional school degree: 234
- Doctorate degree: 17
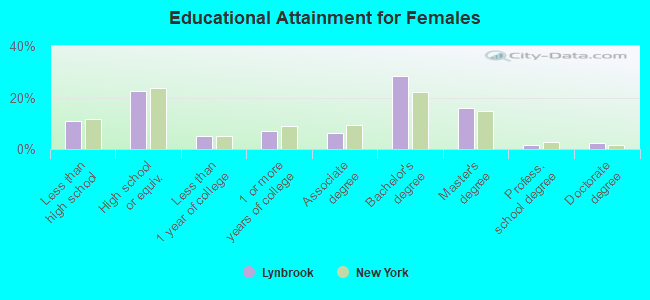
Education attainment for females 25 years and older:
- No schooling: 343
- Nursery to 4th grade: 30
- 5th and 6th grade: 33
- 7th and 8th grade: 48
- 9th grade: 0
- 10th grade: 0
- 11th grade: 125
- 12th grade, no diploma: 294
- High school graduate (or equivalency): 1,786
- Less than 1 year of college: 388
- Some college more than 1 year, no degree: 543
- Associate degree: 485
- Bachelor's degree: 2,259
- Master's degree: 1,276
- Professional school degree: 138
- Doctorate degree: 174
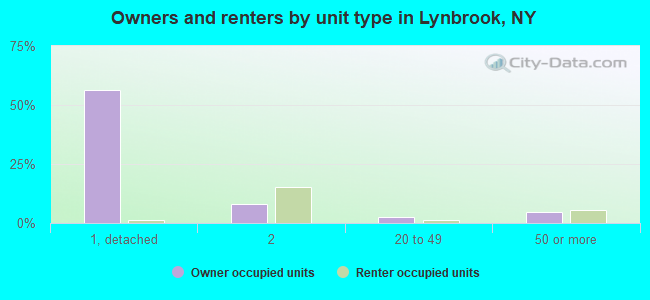
Housing units in structures:
- One, detached: 4,267
- One, attached: 192
- Two: 1,625
- 3 or 4: 99
- 5 to 9: 80
- 10 to 19: 114
- 20 to 49: 209
- 50 or more: 848
- Mobile homes: 21
Housing units lacking complete kitchen facilities in 2022: 5.1%
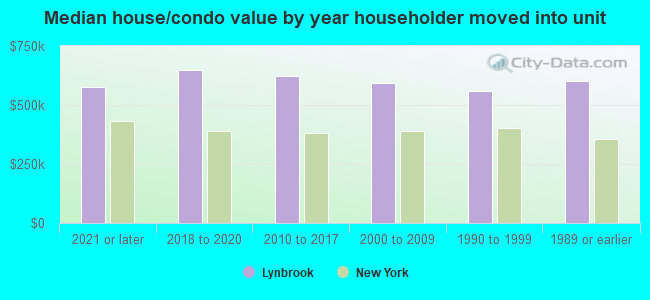
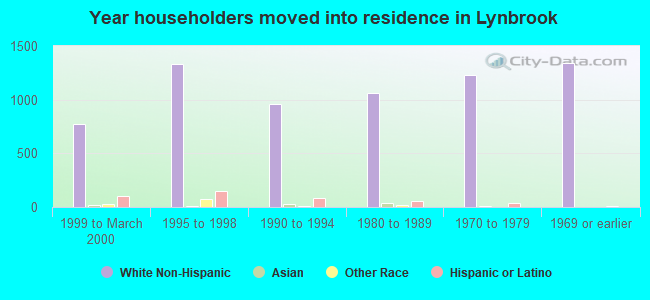
House/condo owner moved in on average 14 years ago
Renter moved in on average 3 years ago
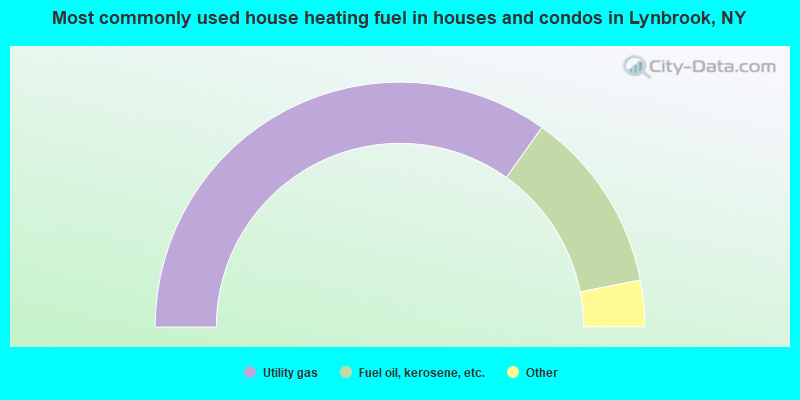
- 69.7%Utility gas
- 24.2%Fuel oil, kerosene, etc.
- 3.6%Electricity
- 1.3%Bottled, tank, or LP gas
- 0.7%No fuel used
- 0.3%Wood
- 0.3%Other fuel
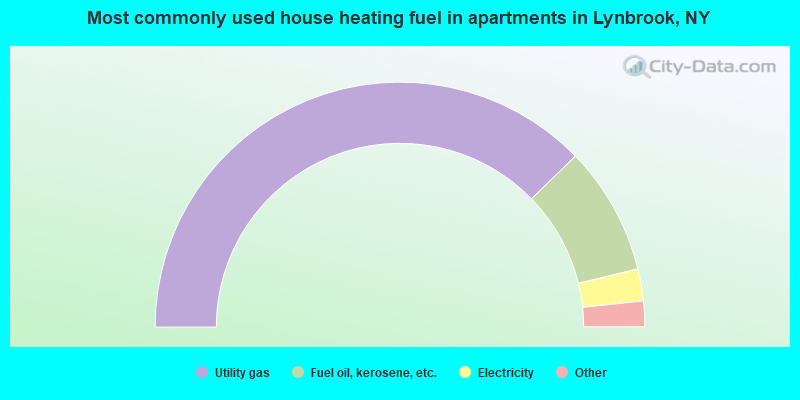
- 75.5%Utility gas
- 17.0%Fuel oil, kerosene, etc.
- 4.2%Electricity
- 3.0%Bottled, tank, or LP gas
- 0.3%No fuel used
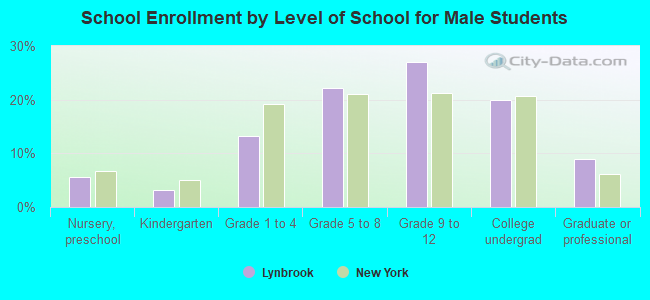
Private vs. public school enrollment:
| Here: | 5.6% |
| New York: | 15.6% |
| Here: | 17.3% |
| New York: | 15.0% |
| Here: | 26.0% |
| New York: | 39.2% |