Jump to a detailed profile or search site with Google Custom Search

Lyndhurst, NJ (New Jersey) Houses and Residents

Estimated median house or condo value in 2022: $462,063 (it was $192,300 in 2000)
Lyndhurst:

$462,063
New Jersey:

$428,900
Lower value quartile - upper value quartile: $352,853 - $433,539

Total population: 19,390 (Urban population: 19,383, Rural population: 0)

Houses: 8,103 (7,877 occupied: 4,721 owner occupied, 3,156 renter occupied)

% of renters here:

40%
State:

35%

Housing density: 1,743 houses/condos per square mile

Median price asked for vacant for-sale houses and condos in 2022 in this county: $777,739.

Median contract rent in 2022: $1,484 (lower quartile is $1,186, upper quartile is $1,836)


Median rent asked for vacant for-rent units in 2022: $1,764


Median gross rent in Lyndhurst, NJ in 2022: $1,618

Housing units in Lyndhurst with a mortgage: 1,801 (219 second mortgage, 242 home equity loan, 0 both second mortgage and home equity loan)
Houses without a mortgage: 1,256

Compare current foreclosures in Lyndhurst, NJ:

Check out more offers in Lyndhurst, NJ.
Powered by Foreclosure.com


Latest news about housing in Lyndhurst, NJ collected exclusively by city-data.com from local newspapers, TV, and radio stations

Lyndhurst, New Jersey Age and Sex of Residents

Household type by relationship:

Households: 894,694
  • In family households: 779,421 (168,972 male householders, 69,583 female householders)
    188,466 spouses, 279,702 children (268,784 natural, 4,691 adopted, 6,227 stepchildren), 10,849 grandchildren, 10,453 brothers or sisters, 14,408 parents, foster children, 12,886 other relatives, 15,359 non-relatives
  • In nonfamily households: 115,273 (40,798 male householders (32,649 living alone)), 56,377 female householders (50,096 living alone)), 18,098 nonrelatives
  • In group quarters: 10,422 (5,047 institutionalized population)

164,958 married couples with children.
25,129 single-parent households (5,042 men, 20,087 women).

73.6% of residents of Lyndhurst speak English at home.
8.2% of residents speak Spanish at home (58% speak English very well, 24% speak English well, 12% speak English not well, 6% don't speak English at all).
12.6% of residents speak other Indo-European language at home (58% speak English very well, 26% speak English well, 12% speak English not well, 4% don't speak English at all).
5.0% of residents speak Asian or Pacific Island language at home (50% speak English very well, 26% speak English well, 19% speak English not well, 6% don't speak English at all).
0.6% of residents speak other language at home (65% speak English very well, 23% speak English well, 11% speak English not well).

Foreign born population: 4,801 (23.0%)
(70.4% of them are naturalized citizens)

Median number of rooms in houses and condos:
Here:

6.8
State:

6.8

Median number of rooms in apartments
Here:

5.1
State:

3.9

Owner-occupied Renter-occupied
Bedrooms in owner-occupied houses and condos in Lyndhurst, New Jersey
  • Bedrooms in owner-occupied houses and condos in Lyndhurst, New Jersey
  • 0no bedroom
  • 2441 bedroom
  • 1,2172 bedrooms
  • 2,2793 bedrooms
  • 7034 bedrooms
  • 2785+ bedrooms
Bedrooms in renter-occupied apartments in Lyndhurst, New Jersey
  • Bedrooms in renter-occupied apartments in Lyndhurst, New Jersey
  • 107no bedroom
  • 1,1651 bedroom
  • 1,3672 bedrooms
  • 4493 bedrooms
  • 364 bedrooms
  • 325+ bedrooms
Owner-occupied Renter-occupied
Cars and other vehicles available in Lyndhurst in owner-occupied houses/condos
  • Cars and other vehicles available in Lyndhurst in owner-occupied houses/condos
  • 362no vehicle
  • 1,4601 vehicle
  • 1,9542 vehicles
  • 6613 vehicles
  • 2144 vehicles
  • 705+ vehicles
Cars and other vehicles available in Lyndhurst in renter-occupied apartments
  • Cars and other vehicles available in Lyndhurst in renter-occupied apartments
  • 510no vehicle
  • 1,5121 vehicle
  • 9232 vehicles
  • 1693 vehicles
  • 274 vehicles
  • 155+ vehicles
Owner-occupied Renter-occupied
Rooms in owner-occupied houses in Lyndhurst, New Jersey
  • Rooms in owner-occupied houses in Lyndhurst, New Jersey
  • 01 room
  • 142 rooms
  • 953 rooms
  • 4114 rooms
  • 9575 rooms
  • 1,4526 rooms
  • 8147 rooms
  • 4418 rooms
  • 5379+ rooms
Rooms in renter-occupied apartments in Lyndhurst, New Jersey
  • Rooms in renter-occupied apartments in Lyndhurst, New Jersey
  • 721 room
  • 1882 rooms
  • 8033 rooms
  • 1,0084 rooms
  • 7235 rooms
  • 2406 rooms
  • 387 rooms
  • 388 rooms
  • 469+ rooms
Year house built
Breakdown of mean house values by ages of householders
Owners and renters by unit type in Lyndhurst, NJ
  • Lyndhurst, NJ household income distribution

  • Distribution of median household income in Lyndhurst, NJ in 2022
  • 10,792Less than $10,000
  • 12,034$10,000 to $19,999
  • 13,030$20,000 to $29,999
  • 16,124$30,000 to $39,999
  • 12,374$40,000 to $49,999
  • 13,700$50,000 to $59,999
  • 21,070$60,000 to $74,999
  • 28,755$75,000 to $99,999
  • 27,797$100,000 to $124,999
  • 22,736$125,000 to $149,999
  • 38,848$150,000 to $199,999
  • 73,120$200,000 or more

Percentage of workers working in this county: 49.9%
Number of people working at home: 2,066 (18.6% of all workers)

Travel time to work (commute)

  • Less than 5 minutes: 259
  • 5 to 9 minutes: 1,314
  • 10 to 14 minutes: 1,123
  • 15 to 19 minutes: 1,081
  • 20 to 24 minutes: 1,230
  • 25 to 29 minutes: 558
  • 30 to 34 minutes: 1,483
  • 35 to 39 minutes: 327
  • 40 to 44 minutes: 410
  • 45 to 59 minutes: 893
  • 60 to 89 minutes: 566
  • 90 or more minutes: 274

Means of transportation to work:

  • Drove a car alone: 7,390 (76.6%)
  • Carpooled: 821 (8.5%)
  • Bus or trolley bus: 582 (6.0%)
  • Subway or elevated: 47 (0.5%)
  • Railroad: 311 (3.2%)
  • Taxi: 13 (0.1%)
  • Motorcycle: 8 (0.1%)
  • Bicycle: 4 (0.0%)
  • Walked: 309 (3.2%)
  • Other means: 33 (0.3%)
  • Worked at home: 127 (1.3%)
Class of Workers in 2000
Year of entry for the foreign-born population in Lyndhurst, New Jersey
  • Year of entry for the foreign-born population in Lyndhurst, New Jersey
  • 5241995 to March 2000
  • 3421990 to 1994
  • 4721985 to 1989
  • 4951980 to 1984
  • 2511975 to 1979
  • 4601970 to 1974
  • 3661965 to 1969
  • 569Before 1965
Ancestries in Lyndhurst, NJ

First ancestries reported:

  • Italian: 7,914 (33.8%)
  • Other: 3,856 (16.5%)
  • Irish: 3,538 (15.1%)
  • Polish: 2,394 (10.2%)
  • German: 1,813 (7.8%)
  • Portuguese: 543 (2.3%)
  • English: 513 (2.2%)
  • United States: 414 (1.8%)
  • Scottish: 268 (1.1%)
  • Dutch: 257 (1.1%)
  • Scotch-Irish: 222 (0.9%)
  • French: 216 (0.9%)
  • Hungarian: 178 (0.8%)
  • Arab: 176 (0.8%)
  • Greek: 176 (0.8%)
  • Ukrainian: 160 (0.7%)
  • Russian: 152 (0.6%)
  • Swedish: 113 (0.5%)
  • Czech: 110 (0.5%)
  • Lithuanian: 97 (0.4%)
  • Norwegian: 61 (0.3%)
  • Slovak: 56 (0.2%)
  • Welsh: 46 (0.2%)
  • Swiss: 43 (0.2%)
  • French Canadian: 27 (0.1%)
  • Danish: 24 (0.1%)
  • West Indian: 22 (0.09%)

Most common places of birth for foreign-born residents (%):

Italy
Lyndhurst:

15.7% (547)
New Jersey:

4.0% (58,395)

Portugal
Lyndhurst:

9.3% (324)
New Jersey:

2.5% (37,183)

Korea
Lyndhurst:

7.1% (248)
New Jersey:

3.5% (51,970)

Poland
Lyndhurst:

5.7% (197)
New Jersey:

3.8% (55,466)

Philippines
Lyndhurst:

5.5% (193)
New Jersey:

4.7% (69,773)

India
Lyndhurst:

5.2% (181)
New Jersey:

8.1% (119,497)

Cuba
Lyndhurst:

4.9% (170)
New Jersey:

3.7% (55,241)

Ecuador
Lyndhurst:

4.0% (140)
New Jersey:

3.6% (53,482)

Turkey
Lyndhurst:

3.7% (129)
New Jersey:

0.7% (9,606)

Spain
Lyndhurst:

3.5% (123)
New Jersey:

0.6% (8,941)

Peru
Lyndhurst:

3.4% (119)
New Jersey:

3.1% (45,151)

Mexico
Lyndhurst:

2.8% (96)
New Jersey:

4.6% (67,667)

Ireland
Lyndhurst:

2.7% (94)
New Jersey:

0.8% (12,082)

China, excluding Hong Kong and Taiwan
Lyndhurst:

2.5% (87)
New Jersey:

2.7% (40,092)

Colombia
Lyndhurst:

2.1% (72)
New Jersey:

4.7% (69,754)

Egypt
Lyndhurst:

1.8% (62)
New Jersey:

1.4% (20,079)

United Kingdom
Lyndhurst:

1.6% (54)
New Jersey:

2.1% (30,355)

Laos
Lyndhurst:

1.6% (54)
New Jersey:

0.0% (463)

Place of birth for U.S.-born residents:

  • This state: 13,159
  • Other state: 2,588
  • Northeast: 2,228
  • Midwest: 138
  • South: 202
  • West: 20

66% of Lyndhurst residents lived in the same house 5 years ago.
   Out of people who lived in different houses, 52% lived in this county.
   Out of people who lived in different counties, 74% lived in New Jersey.

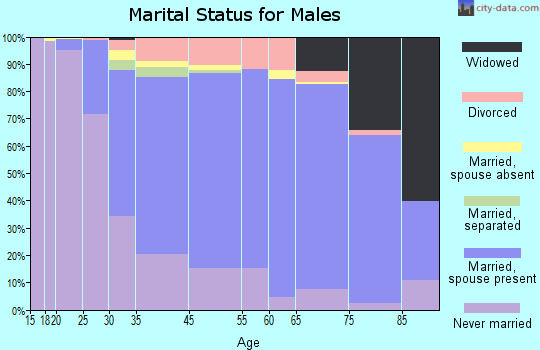
Education attainment for males 25 years and older:

  • No schooling: 34
  • Nursery to 4th grade: 105
  • 5th and 6th grade: 101
  • 7th and 8th grade: 254
  • 9th grade: 119
  • 10th grade: 160
  • 11th grade: 142
  • 12th grade, no diploma: 285
  • High school graduate (or equivalency): 2,410
  • Less than 1 year of college: 409
  • Some college more than 1 year, no degree: 834
  • Associate degree: 231
  • Bachelor's degree: 1,048
  • Master's degree: 311
  • Professional school degree: 93
  • Doctorate degree: 36
Educational Attainment for Males

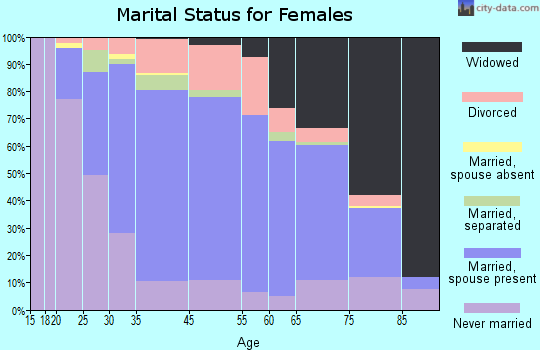
Education attainment for females 25 years and older:

  • No schooling: 98
  • Nursery to 4th grade: 86
  • 5th and 6th grade: 181
  • 7th and 8th grade: 252
  • 9th grade: 154
  • 10th grade: 241
  • 11th grade: 197
  • 12th grade, no diploma: 242
  • High school graduate (or equivalency): 3,108
  • Less than 1 year of college: 457
  • Some college more than 1 year, no degree: 671
  • Associate degree: 375
  • Bachelor's degree: 1,187
  • Master's degree: 328
  • Professional school degree: 91
  • Doctorate degree: 23
Educational Attainment for Females
Lyndhurst marital status for males
Lyndhurst marital status for females

Housing units in structures:

  • One, detached: 3,238
  • One, attached: 187
  • Two: 3,024
  • 3 or 4: 665
  • 5 to 9: 237
  • 10 to 19: 370
  • 20 to 49: 258
  • 50 or more: 124
Housing units lacking complete plumbing facilities: 0.2%

Housing units lacking complete kitchen facilities: 0.4%
Year householders moved into residence in Lyndhurst
Houses and condos Apartments
Most commonly used house heating fuel in houses and condos in Lyndhurst, NJ
  • 78.3%Utility gas
  • 18.0%Fuel oil, kerosene, etc.
  • 3.3%Electricity
  • 0.4%Bottled, tank, or LP gas
Most commonly used house heating fuel in apartments in Lyndhurst, NJ
  • 76.5%Utility gas
  • 14.0%Fuel oil, kerosene, etc.
  • 7.7%Electricity
  • 1.2%Bottled, tank, or LP gas
  • 0.5%Other fuel

Private vs. public school enrollment:

Students in private schools in grades 1 to 8 (elementary and middle school): 342
Here:

18.3%
New Jersey:

13.2%

Students in private schools in grades 9 to 12 (high school): 150
Here:

19.3%
New Jersey:

13.0%

Students in private undergraduate colleges: 301
Here:

35.1%
New Jersey:

30.1%
School Enrollment by Level of School for Male Students
School Enrollment by Level of School for Female Students
Age and Sex of Sensory-Disabled Noninstitutionalized Residents
Age and Sex of Physically-Disabled Noninstitutionalized Residents
Age and Sex of Mentally-Disabled Noninstitutionalized Residents
Age and Sex of Self-Care Disabled Noninstitutionalized Residents
Age and Sex of Go-Outside-Home Disabled Noninstitutionalized Residents
Age and Sex of Noninstitutionalized Residents with Employment Disability