Maitland, FL (Florida) Houses and Residents
| Maitland: | $557,184 |
| Florida: | $354,100 |
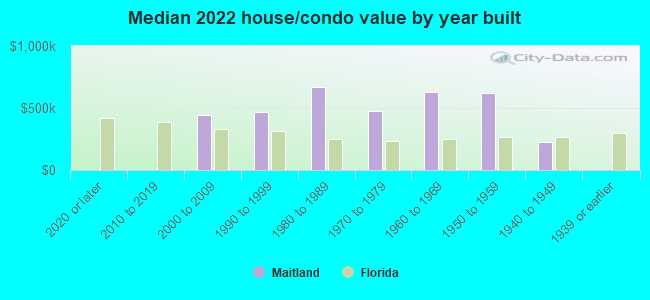
Mean price in 2022:
Detached houses: $689,544
Here: $689,544 State: $500,941 Townhouses or other attached units: $295,969
Here: $295,969 State: $370,869 In 5-or-more-unit structures: $274,341
Here: $274,341 State: $447,145
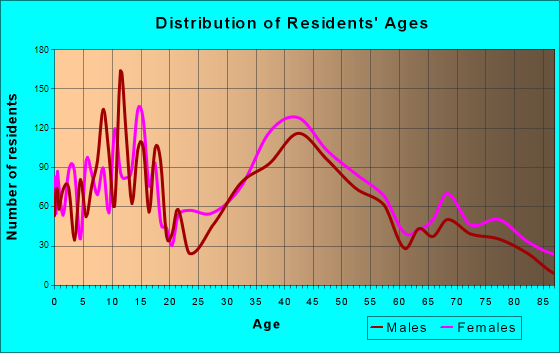
Total population: 16,823 (Urban population: 11,934, Rural population: 0)
Houses: 10,038 (9,009 occupied: 4,339 owner occupied, 5,277 renter occupied)
| % of renters here: | 55% |
| State: | 33% |
Housing density: 2,162 houses/condos per square mile
Median price asked for vacant for-sale houses and condos in 2022: $405,934.
Median contract rent in 2022: $1,689 (lower quartile is $1,385, upper quartile is over $2,000)
Median rent asked for vacant for-rent units in 2022: $1,646
Median gross rent in Maitland, FL in 2022: $1,834
Housing units in Maitland with a mortgage: 2,531 (337 second mortgage, 12 home equity loan, 270 both second mortgage and home equity loan)
Houses without a mortgage: 52
Median household income for houses/condos with a mortgage: $169,359
Median household income for apartments without a mortgage: $96,498
Median monthly housing costs: $1,763
Compare current foreclosures near Maitland, FL:
| Photo | Address | Area | Beds / Baths | Price | Details |
|---|---|---|---|---|---|

|
#1
Shell Pt E
Maitland, FL 32751
|
2,303 sq. feet
|
3 baths 4 beds |
show details | |

|
#2
Rogers Ave
Maitland, FL 32751
|
1,450 sq. feet
|
2 baths 4 beds |
show details | |

|
#3
Mulberry St
Maitland, FL 32751
|
2,798 sq. feet
|
3 baths 4 beds |
show details | |

|
#4
Windglow Trl
Maitland, FL 32751
|
2,817 sq. feet
|
2 baths 5 beds |
show details | |

|
#5
Dommerich Dr
Maitland, FL 32751
|
3,299 sq. feet
|
3 baths 4 beds |
show details | |

|
#6
S West St
Maitland, FL 32751
|
2,001 sq. feet
|
2 baths 3 beds |
show details | |

|
#7
Warrens Ave
Maitland, FL 32751
|
520 sq. feet
|
1 baths 1 beds |
show details | |

|
#8
Kenaston Rd
Maitland, FL 32751
|
2,103 sq. feet
|
4 baths 3 beds |
show details | |

|
#9
Fieldingwood Rd
Maitland, FL 32751
|
2,352 sq. feet
|
2 baths - beds |
show details | |

|
#10
Tuscarora Trl
Maitland, FL 32751
|
2,276 sq. feet
|
3 baths - beds |
show details |
| Photo | Address | Area | Beds / Baths | Price | Details |
|---|---|---|---|---|---|

|
#11
Legacy Villas Dr
Maitland, FL 32751
|
- sq. feet
|
2 baths 2 beds |
show details | |

|
#12
Grove St
Maitland, FL 32751
|
- sq. feet
|
2 baths 3 beds |
show details | |

|
#13
Banyan Dr
Maitland, FL 32751
|
1,234 sq. feet
|
2 baths - beds |
show details | |

|
#14
Chipola Trl
Maitland, FL 32751
|
1,756 sq. feet
|
2 baths - beds |
show details | |

|
#15
Birchwood Dr
Maitland, FL 32751
|
3,827 sq. feet
|
3 baths - beds |
show details | |

|
#16
Brookside Rd
Maitland, FL 32751
|
1,909 sq. feet
|
2 baths - beds |
show details | |

|
#17
Legacy Lake Dr
Maitland, FL 32751
|
- sq. feet
|
- baths - beds |
show details | |

|
#18
Sybelia Pkwy Apt 531
Maitland, FL 32751
|
- sq. feet
|
- baths - beds |
show details | |

|
#19
Maitland Center Pkwy Ste 306
Maitland, FL 32751
|
- sq. feet
|
- baths - beds |
show details | |

|
#20
S L Sybelia Dr
Maitland, FL 32751
|
- sq. feet
|
- baths - beds |
show details |
| Photo | Address | Area | Beds / Baths | Price | Details |
|---|---|---|---|---|---|

|
#21
S College Ave
Maitland, FL 32751
|
- sq. feet
|
- baths - beds |
show details | |

|
#22
Gulfview Dr # 435-B
Maitland, FL 32751
|
- sq. feet
|
- baths - beds |
show details | |

|
#23
Lake Lucien Dr Ste 109
Maitland, FL 32751
|
- sq. feet
|
- baths - beds |
show details | |

|
#24
Sybelia Pkwy Apt 317
Maitland, FL 32751
|
- sq. feet
|
- baths - beds |
show details | |

|
#25
Lake Lily Dr Apt A231
Maitland, FL 32751
|
- sq. feet
|
- baths - beds |
show details | |

|
#26
Ridgewood Ave
Maitland, FL 32751
|
- sq. feet
|
- baths - beds |
show details | |

|
#27
E Packwood Ave # 106
Maitland, FL 32751
|
17,160 sq. feet
|
- baths - beds |
show details | |

|
#28
Derbyshire Rd
Maitland, FL 32751
|
- sq. feet
|
- baths - beds |
show details | |

|
#29
Cannon Way
Casselberry, FL 32707
|
1,428 sq. feet
|
1 baths 3 beds |
$340,000
|
show details |

|
#30
Ford St
Orlando, FL 32811
|
726 sq. feet
|
1 baths 2 beds |
$245,000
|
show details |
| Photo | Address | Area | Beds / Baths | Price | Details |
|---|---|---|---|---|---|

|
#31
Anna Dr
Apopka, FL 32703
|
864 sq. feet
|
1 baths 3 beds |
$146,500
|
show details |

|
#32
Idaho Ave
Orlando, FL 32809
|
1,326 sq. feet
|
2 baths 3 beds |
$279,000
|
show details |

|
#33
Anzle Ave
Winter Park, FL 32789
|
1,808 sq. feet
|
2 baths 3 beds |
$549,900
|
show details |

|
#34
S Palmetto Ave
Sanford, FL 32773
|
1,412 sq. feet
|
1 baths 3 beds |
show details | |

|
#35
Cardiff Dr
Orlando, FL 32837
|
1,490 sq. feet
|
2 baths 4 beds |
show details | |

|
#36
Delcrest Dr
Orlando, FL 32817
|
2,053 sq. feet
|
2 baths 3 beds |
show details | |

|
#37
Aguila Pl
Orlando, FL 32826
|
1,958 sq. feet
|
2 baths 4 beds |
show details | |

|
#38
Oyster Bay Cir Apt 100
Altamonte Springs, FL 32701
|
992 sq. feet
|
2 baths 2 beds |
show details | |

|
#39
Foxforrest Cir
Apopka, FL 32712
|
2,648 sq. feet
|
2 baths 3 beds |
show details | |

|
#40
Palio Ct
Ocoee, FL 34761
|
3,227 sq. feet
|
3 baths 4 beds |
show details |
| Photo | Address | Area | Beds / Baths | Price | Details |
|---|---|---|---|---|---|

|
#41
Buttercup Ln
Orlando, FL 32825
|
1,220 sq. feet
|
1 baths 3 beds |
show details | |

|
#42
Lost Grove Cir
Winter Garden, FL 34787
|
2,880 sq. feet
|
2 baths 4 beds |
show details | |

|
#43
Dianjo Dr
Orlando, FL 32810
|
1,539 sq. feet
|
2 baths 4 beds |
show details | |

|
#44
Moonbeam Rd
Apopka, FL 32712
|
1,024 sq. feet
|
2 baths 3 beds |
show details | |

|
#45
Kantor Blvd
Casselberry, FL 32707
|
1,511 sq. feet
|
2 baths 3 beds |
show details | |

|
#46
Autumn Chase Cir
Sanford, FL 32773
|
2,465 sq. feet
|
3 baths 4 beds |
show details | |

|
#47
N Hart Blvd
Orlando, FL 32835
|
1,296 sq. feet
|
2 baths 3 beds |
show details | |

|
#48
N Hastings St
Orlando, FL 32808
|
1,220 sq. feet
|
2 baths 3 beds |
show details | |

|
#49
Cherry Grove Cir
Orlando, FL 32809
|
1,895 sq. feet
|
2 baths 3 beds |
show details | |

|
Check over 1 million property listings on Foreclosure.com!
|
browse all offers | |||

Latest news about housing in Maitland, FL collected exclusively by city-data.com from local newspapers, TV, and radio stations

 | Maitland / Altamonte Springs condos and apartments (5 replies) |
| Apartments under $1600 in Orlando Area (2 replies) |
| Looking for a 1br condo/apartment RENTAL between Lake Mary and Maitland along I-4 (3 replies) |
| Family friendly towns near Maitland? Please help! (12 replies) |
| Maitland Shores Apartments (4 replies) |
| Home Rentals North Orlando area (11 replies) |
Median year apartment built: 2009
Household type by relationship:
Households: 19,607- Male householders: 4,382 (1,267 living alone), Female householders: 4,430 (1,608 living alone)
3,546 spouses (3,506 opposite-sex spouses), 811 unmarried partners, (768 opposite-sex unmarried partners), 4,620 children (4,430 natural, 108 adopted, 81 stepchildren), 206 grandchildren, 185 brothers or sisters, 219 parents, 0 foster children, 121 other relatives, 942 non-relatives
- In group quarters: 141
Size of family households: 2,686 2-persons, 1,286 3-persons, 879 4-persons, 336 5-persons, 17 6-persons, 45 7-or-more-persons.
Size of nonfamily households: 3,175 1-person, 1,087 2-persons, 66 3-persons, 11 4-persons.
2,321 married couples with children.
918 single-parent households (276 men, 642 women).
81.0% of residents of Maitland speak English at home.
10.4% of residents speak Spanish at home (88% speak English very well, 8% speak English well, 4% speak English not well).
6.7% of residents speak other Indo-European language at home (70% speak English very well, 26% speak English well, 3% speak English not well).
1.5% of residents speak Asian or Pacific Island language at home (70% speak English very well, 25% speak English well, 5% speak English not well).
0.9% of residents speak other language at home (96% speak English very well, 4% speak English well).
Foreign born population: 2,614 (13.3%)
(62.4% of them are naturalized citizens)
| Here: | 7.0 |
| State: | 5.9 |
| Here: | 3.5 |
| State: | 4.2 |
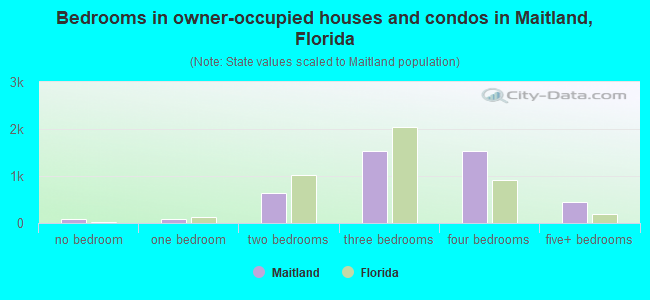
- Bedrooms in owner-occupied houses and condos in Maitland, Florida
- 79no bedroom
- 921 bedroom
- 6362 bedrooms
- 1,5393 bedrooms
- 1,5374 bedrooms
- 4555+ bedrooms
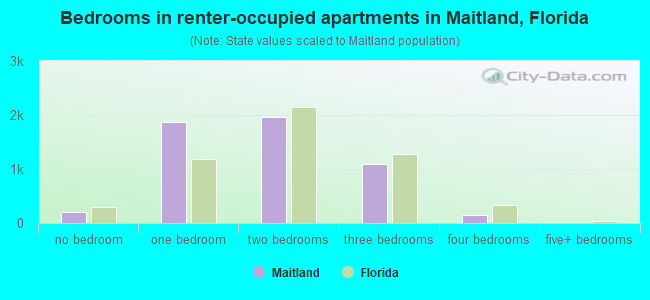
- Bedrooms in renter-occupied apartments in Maitland, Florida
- 209no bedroom
- 1,8731 bedroom
- 1,9592 bedrooms
- 1,0933 bedrooms
- 1444 bedrooms
- 05+ bedrooms
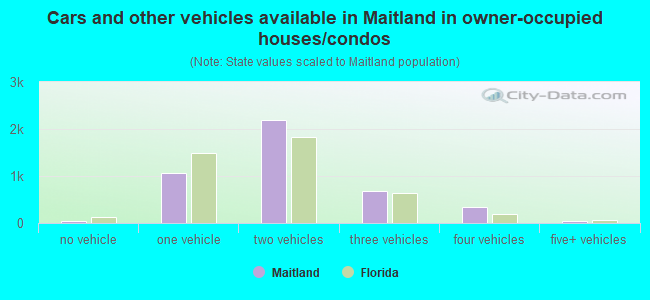
- Cars and other vehicles available in Maitland in owner-occupied houses/condos
- 33no vehicle
- 1,0641 vehicle
- 2,1852 vehicles
- 6743 vehicles
- 3414 vehicles
- 425+ vehicles
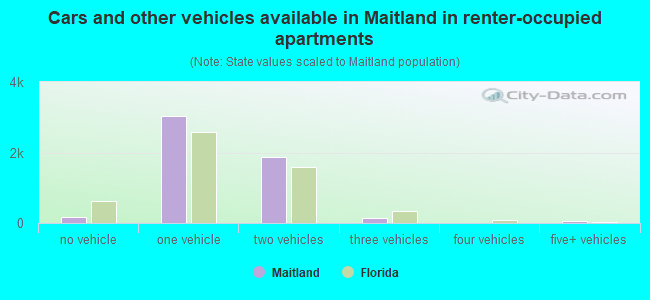
- Cars and other vehicles available in Maitland in renter-occupied apartments
- 183no vehicle
- 3,0351 vehicle
- 1,8762 vehicles
- 1283 vehicles
- 64 vehicles
- 505+ vehicles
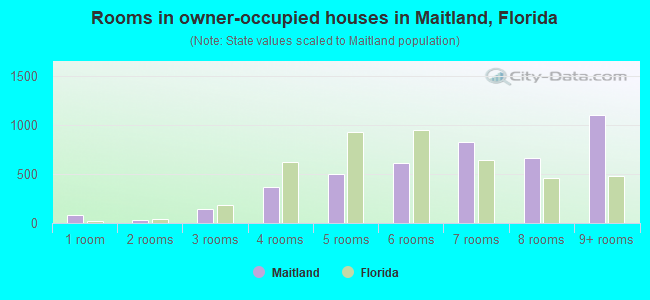
- Rooms in owner-occupied houses in Maitland, Florida
- 791 room
- 342 rooms
- 1443 rooms
- 3674 rooms
- 5025 rooms
- 6136 rooms
- 8307 rooms
- 6658 rooms
- 1,1059+ rooms
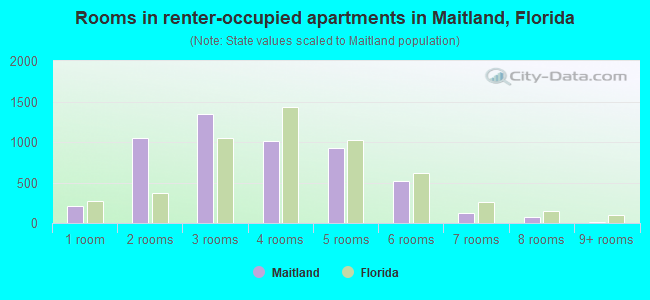
- Rooms in renter-occupied apartments in Maitland, Florida
- 2091 room
- 1,0522 rooms
- 1,3443 rooms
- 1,0104 rooms
- 9315 rooms
- 5216 rooms
- 1247 rooms
- 708 rooms
- 189+ rooms
Maitland, FL household income distribution

- 515Less than $10,000
- 610$10,000 to $19,999
- 332$20,000 to $29,999
- 449$30,000 to $39,999
- 477$40,000 to $49,999
- 826$50,000 to $59,999
- 824$60,000 to $74,999
- 1,549$75,000 to $99,999
- 825$100,000 to $124,999
- 768$125,000 to $149,999
- 751$150,000 to $199,999
- 1,783$200,000 or more

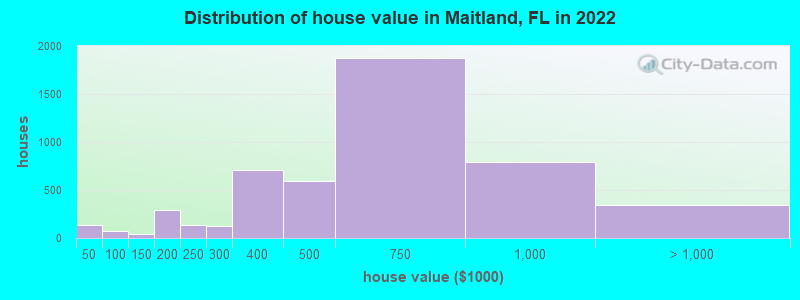
Home value of owner - occupied houses in 2022 in Maitland, FL
-
- 87Less than $10,000
- 17$15,000 to $19,999
- 2$30,000 to $34,999
- 31$40,000 to $49,999
- 2$50,000 to $59,999
- 15$70,000 to $79,999
- 24$80,000 to $89,999
- 17$100,000 to $124,999
- 25$125,000 to $149,999
- 73$150,000 to $174,999
- 214$175,000 to $199,999
- 132$200,000 to $249,999
- 125$250,000 to $299,999
- 709$300,000 to $399,999
- 593$400,000 to $499,999
- 1,877$500,000 to $749,999
- 792$750,000 to $999,999
- 156$1,000,000 to $1,499,999
- 92$1,500,000 to $1,999,999
- 96$2,000,000 or more
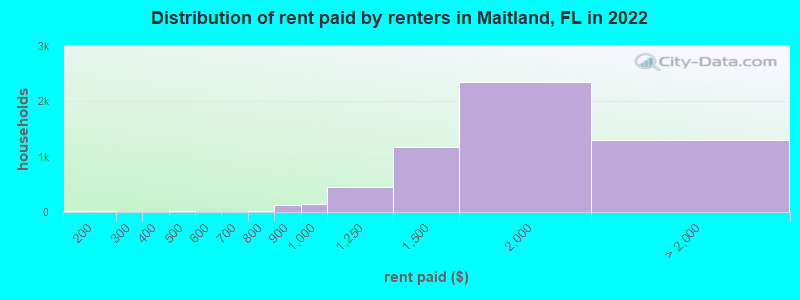
Rent paid by renters in 2022 in Maitland, FL
-
- 21$100 to $149
- 5$350 to $399
- 12$400 to $449
- 6$650 to $699
- 17$700 to $749
- 129$800 to $899
- 138$900 to $999
- 451$1,000 to $1,249
- 1,183$1,250 to $1,499
- 2,352$1,500 to $1,999
- 1,171$2,000 to $2,499
- 53$2,500 to $2,999
- 5$3,000 to $3,499
- 10$3,500 or more
- 59No cash rent
Percentage of workers working in this county: 84.7%
Number of people working at home: 3,407 (28.2% of all workers)
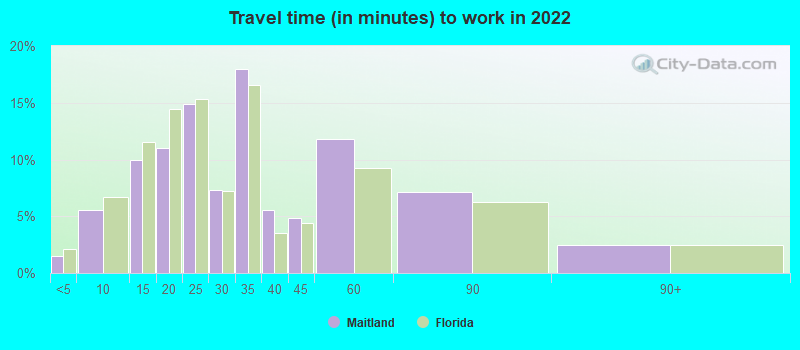
Travel time to work (commute)
- Less than 5 minutes: 305
- 5 to 9 minutes: 1,042
- 10 to 14 minutes: 1,587
- 15 to 19 minutes: 2,005
- 20 to 24 minutes: 1,381
- 25 to 29 minutes: 849
- 30 to 34 minutes: 964
- 35 to 39 minutes: 310
- 40 to 44 minutes: 169
- 45 to 59 minutes: 238
- 60 to 89 minutes: 364
- 90 or more minutes: 213
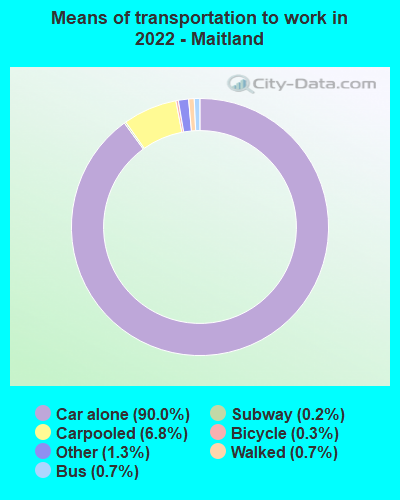
Means of transportation to work:
- Drove a car alone: 23,446 (77.5%)
- Carpooled: 1,872 (6.2%)
- Bus: 198 (0.7%)
- Long-distance train or commuter rail: 97 (0.3%)
- Taxi: 364 (1.2%)
- Bicycle: 62 (0.2%)
- Walked: 231 (0.8%)
- Worked at home: 3,407 (11.3%)
- Unemployment by race in 2022
- Unemployment rate for White non-Hispanic residents
- 2.5%Males
- 8.7%Females
- Unemployment rate for Black residents
- 0.8%Females
- Unemployment rate for two or more race residents
- 2.6%Females
- Unemployment rate for Hispanic or Latino residents
- 1.1%Males
- 1.6%Females
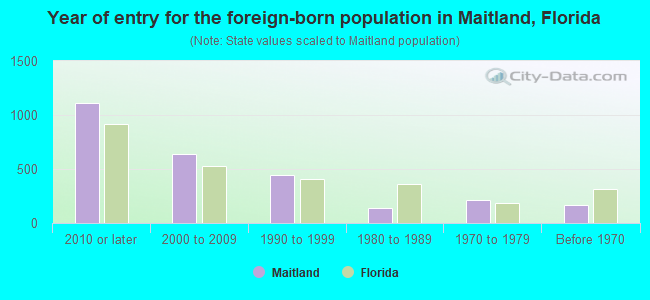
- Year of entry for the foreign-born population in Maitland, Florida
- 1,1092010 or later
- 6382000 to 2009
- 4451990 to 1999
- 1371980 to 1989
- 2171970 to 1979
- 170Before 1970
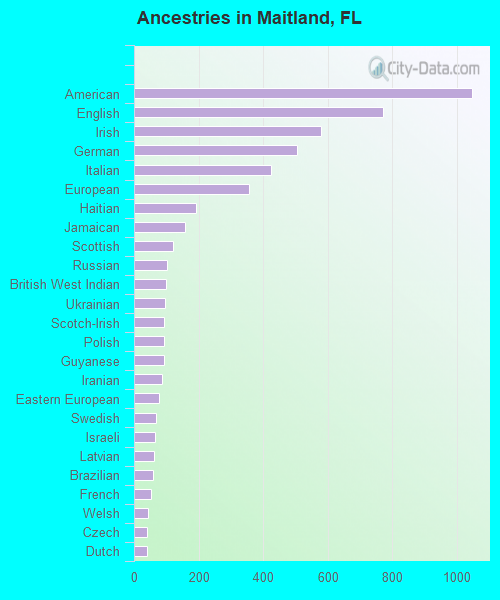
First ancestries reported:
- American: 1,047 (10.6%)
- English: 770 (7.8%)
- Irish: 578 (5.8%)
- German: 504 (5.1%)
- Italian: 423 (4.3%)
- European: 355 (3.6%)
- Haitian: 192 (1.9%)
- Jamaican: 157 (1.6%)
- Scottish: 121 (1.2%)
- Russian: 102 (1.0%)
- British West Indian: 99 (1.0%)
- Ukrainian: 96 (1.0%)
- Scotch-Irish: 93 (0.9%)
- Polish: 92 (0.9%)
- Guyanese: 92 (0.9%)
- Iranian: 87 (0.9%)
- Eastern European: 77 (0.8%)
- Swedish: 68 (0.7%)
- Israeli: 64 (0.6%)
- Latvian: 61 (0.6%)
- Brazilian: 58 (0.6%)
- French: 52 (0.5%)
- Welsh: 44 (0.4%)
- Czech: 40 (0.4%)
- Dutch: 39 (0.4%)
- Swiss: 25 (0.3%)
- Belizean: 23 (0.2%)
- Northern European: 21 (0.2%)
- British: 18 (0.2%)
- Portuguese: 13 (0.1%)
- Scandinavian: 12 (0.1%)
- Czechoslovakian: 12 (0.1%)
- Austrian: 10 (0.1%)
- Barbadian: 9 (0.09%)
- Norwegian: 9 (0.09%)
- Lebanese: 8 (0.08%)
- Romanian: 6 (0.06%)
- Danish: 4 (0.04%)
- Canadian: 4 (0.04%)
- Finnish: 3 (0.03%)
- French Canadian: 1 (0.01%)
Most common places of birth for foreign-born residents (%):
| Maitland: | 9.7% (249) |
| Florida: | 0.2% (11,000) |
| Maitland: | 9.5% (245) |
| Florida: | 7.5% (342,375) |
| Maitland: | 8.2% (212) |
| Florida: | 2.1% (94,349) |
| Maitland: | 4.6% (119) |
| Florida: | 5.7% (262,042) |
| Maitland: | 4.6% (119) |
| Florida: | 6.5% (298,669) |
| Maitland: | 4.5% (116) |
| Florida: | 5.0% (227,319) |
| Maitland: | 4.4% (113) |
| Florida: | 0.5% (21,886) |
| Maitland: | 4.3% (111) |
| Florida: | 3.0% (137,727) |
| Maitland: | 3.1% (80) |
| Florida: | 0.7% (33,556) |
| Maitland: | 3.0% (77) |
| Florida: | 0.3% (14,535) |
| Maitland: | 3.0% (77) |
| Florida: | 1.3% (60,604) |
| Maitland: | 2.9% (74) |
| Florida: | 2.7% (122,906) |
| Maitland: | 2.5% (65) |
| Florida: | 0.5% (21,571) |
| Maitland: | 2.5% (64) |
| Florida: | 1.2% (56,071) |
| Maitland: | 2.4% (63) |
| Florida: | 1.8% (84,403) |
| Maitland: | 2.4% (62) |
| Florida: | 1.3% (57,263) |
| Maitland: | 2.3% (60) |
| Florida: | 1.2% (54,272) |
| Maitland: | 2.3% (59) |
| Florida: | 2.1% (96,693) |
| Maitland: | 2.2% (56) |
| Florida: | 0.3% (15,079) |
| Maitland: | 1.8% (46) |
| Florida: | 5.6% (257,152) |
| Maitland: | 1.8% (46) |
| Florida: | 0.0% (2,155) |
| Maitland: | 1.6% (42) |
| Florida: | 1.2% (54,585) |
Place of birth for U.S.-born residents:
- This state: 7,312
- Other state: 9,082
- Northeast: 3,521
- Midwest: 1,723
- South: 2,752
- West: 1,097
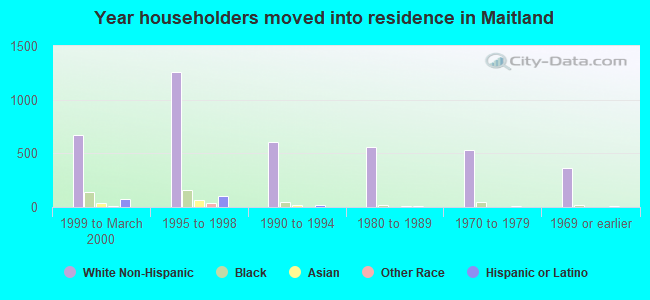
77.5% of Maitland residents lived in the same house 1 years ago.
Out of people who lived in different houses, 31.4% lived in this county.
Out of people who lived in different counties, 61.0% lived in Florida.
| Maitland: | 77.5% |
| State average: | 86.3% |
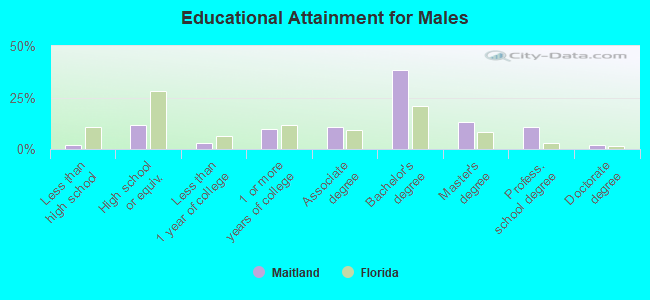
Education attainment for males 25 years and older:
- No schooling: 19
- Nursery to 4th grade: 14
- 5th and 6th grade: 0
- 7th and 8th grade: 0
- 9th grade: 0
- 10th grade: 4
- 11th grade: 8
- 12th grade, no diploma: 77
- High school graduate (or equivalency): 824
- Less than 1 year of college: 192
- Some college more than 1 year, no degree: 678
- Associate degree: 748
- Bachelor's degree: 2,735
- Master's degree: 919
- Professional school degree: 744
- Doctorate degree: 137
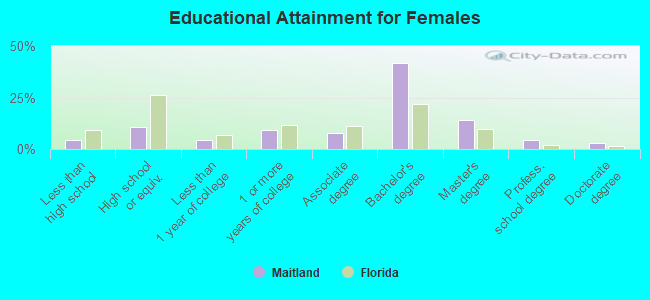
Education attainment for females 25 years and older:
- No schooling: 6
- Nursery to 4th grade: 0
- 5th and 6th grade: 33
- 7th and 8th grade: 35
- 9th grade: 12
- 10th grade: 15
- 11th grade: 162
- 12th grade, no diploma: 84
- High school graduate (or equivalency): 840
- Less than 1 year of college: 354
- Some college more than 1 year, no degree: 735
- Associate degree: 604
- Bachelor's degree: 3,292
- Master's degree: 1,113
- Professional school degree: 345
- Doctorate degree: 215
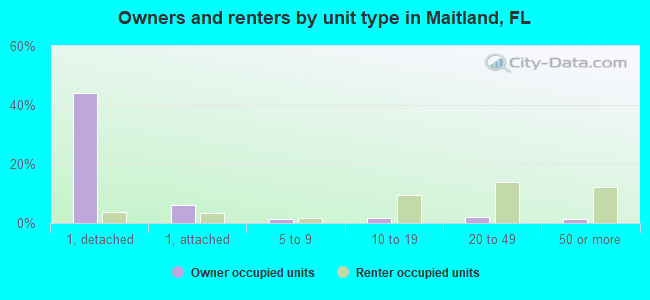
Housing units in structures:
- One, detached: 3,659
- One, attached: 833
- Two: 251
- 3 or 4: 366
- 5 to 9: 501
- 10 to 19: 1,185
- 20 to 49: 1,168
- 50 or more: 2,062
- Mobile homes: 10
Housing units lacking complete kitchen facilities in 2022: 3.5%
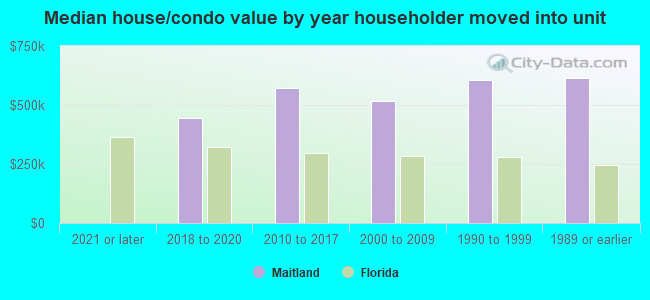
House/condo owner moved in on average 12 years ago
Renter moved in on average 1 years ago
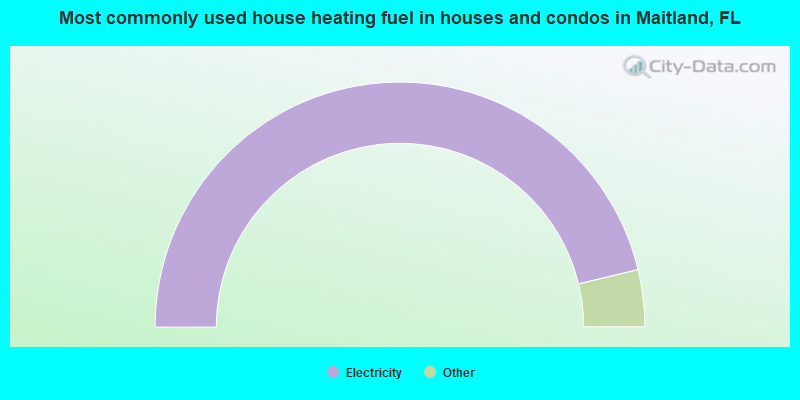
- 92.5%Electricity
- 2.6%Bottled, tank, or LP gas
- 2.5%Utility gas
- 1.5%No fuel used
- 0.7%Solar energy
- 0.3%Fuel oil, kerosene, etc.
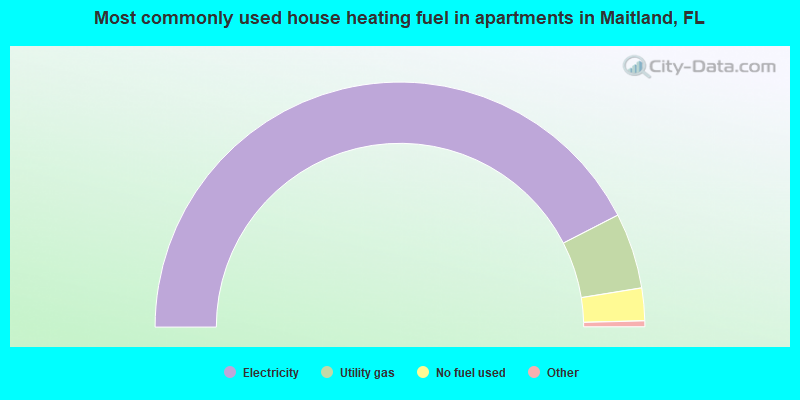
- 85.0%Electricity
- 10.0%Utility gas
- 4.3%No fuel used
- 0.4%Bottled, tank, or LP gas
- 0.2%Other fuel
- 0.1%Solar energy
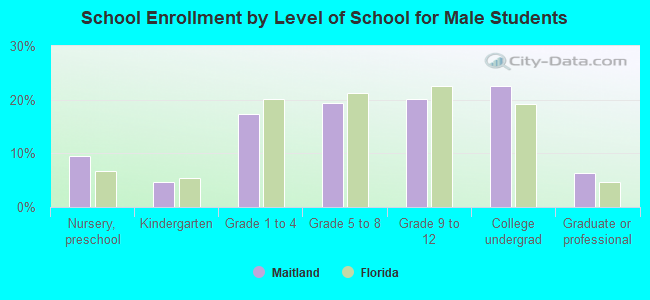
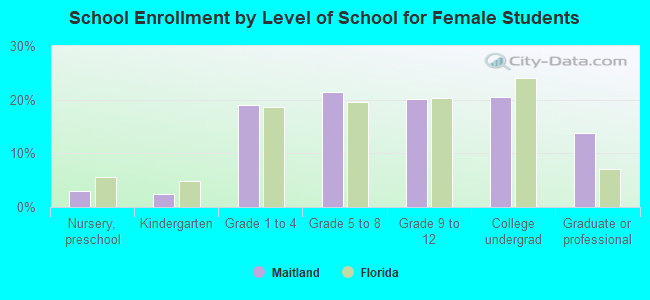
Private vs. public school enrollment:
| Here: | 31.2% |
| Florida: | 15.8% |
| Here: | 24.2% |
| Florida: | 12.9% |
| Here: | 15.1% |
| Florida: | 23.6% |