Matthews, NC (North Carolina) Houses and Residents
Estimated median house or condo value in 2022: $433,248 (it was $170,600 in 2000 )
Matthews:
$433,248North Carolina:
$280,600
Lower value quartile - upper value quartile: $378,771 - $574,886Mean price in 2022: Detached houses: $435,462 Here:
$435,462State:
$375,326
Townhouses or other attached units: $360,919 Here:
$360,919State:
$317,935
In 3-to-4-unit structures: $428,016 Here:
$428,016State:
$254,939
In 5-or-more-unit structures: $303,996 Here:
$303,996State:
$329,290
Mobile homes: $55,747 Here:
$55,747State:
$124,933
Total population: 30,008 (Urban population: 22,408, Rural population: 0)
Houses: 12,337 (11,627 occupied: 7,844 owner occupied, 3,856 renter occupied )
% of renters here:
33%State:
33%
Housing density: 868 houses/condos per square mile
Median price asked for vacant for-sale houses and condos in 2022: $405,636.
Median contract rent in 2022: $1,503 (lower quartile is $1,288, upper quartile is $1,881)
Median rent asked for vacant for-rent units in 2022: $1,495
Median gross rent in Matthews, NC in 2022: $1,558
Housing units in Matthews with a mortgage: 5,357 (605 second mortgage, 20 home equity loan, 538 both second mortgage and home equity loan )Houses without a mortgage: 114
Median household income for houses/condos with a mortgage: $138,447
Median household income for apartments without a mortgage: $92,744
Median monthly housing costs: $1,537
Data:
Median house or condo value ($)
Median house or condo value ($ change since 2000)
Median house or condo value ($) - White
Median house or condo value ($) - Black or African American
Median house or condo value ($) - Asian
Median house or condo value ($) - Hispanic or Latino
Median house or condo value ($) - American Indian and Alaska Native
Median house or condo value ($) - Multirace
Median house or condo value ($) - Other Race
Median price asked for mobile homes ($)
Household density (households per square mile)
Mean house or condo value by units in structure - 1, detached ($)
Mean house or condo value by units in structure - 1, attached ($)
Mean house or condo value by units in structure - 2 ($)
Mean house or condo value by units in structure by units in structure - 3 or 4 ($)
Mean house or condo value by units in structure - 5 or more ($)
Mean house or condo value by units in structure - Boat, RV, van, etc. ($)
Mean house or condo value by units in structure - Mobile home ($)
Median contract rent ($)
Median contract rent - Lower quartile ($)
Median contract rent - Upper quartile ($)
Median gross rent ($)
Urban houses (%)
Rural houses (%)
Houses occupied (%)
Houses occupied (% change since 2000)
Houses owner occupied (%)
Houses owner occupied (% change since 2000)
Houses renter occupied (%)
Houses renter occupied (% change since 2000)
Vacant housing units - For rent (%)
Vacant housing units - For rent (% change since 2000)
Vacant housing units - For sale only (%)
Vacant housing units - For sale only (% change since 2000)
Vacant housing units - Rented or sold, not occupied (%)
Vacant housing units - Rented or sold, not occupied (% change since 2000)
Vacant housing units - For seasonal, recreational, or occasional use (%)
Vacant housing units - For seasonal, recreational, or occasional use (% change since 2000)
Vacant housing units - For migrant workers (%)
Vacant housing units - For migrant workers (% change since 2000)
Vacant housing units - Other vacant (%)
Vacant housing units - Other vacant (% change since 2000)
Median monthly housing costs ($)
Median household income for houses/condos with a mortgage ($)
Median household income for houses/condos without a mortgage ($)
Median household income ($)
Median household income ($) - White
Median household income ($) - Black or African American
Median household income ($) - Asian
Median household income ($) - Hispanic or Latino
Median household income ($) - American Indian and Alaska Native
Median household income ($) - Multirace
Median household income ($) - Other Race
Mortgage status - with mortgage (%)
Mortgage status - with second mortgage (%)
Mortgage status - with home equity loan (%)
Mortgage status - with both second mortgage and home equity loan (%)
Mortgage status - without a mortgage (%)
Median year house/condo built
Median year apartment built
Household type by relationship - Male householder living alone (%)
Household type by relationship - Male householder not living alone (%)
Household type by relationship - Female householder living alone (%)
Household type by relationship - Female householder not living alone (%)
Household type by relationship - Opposite-Sex spouse (%)
Household type by relationship - Same-Sex spouse (%)
Household type by relationship - Opposite-Sex unmarried partner (%)
Household type by relationship - Same-Sex unmarried partner (%)
Household type by relationship - In group quarters (%)
Size of family households - 2-person household (%)
Size of family households - 3-person household (%)
Size of family households - 4-person household (%)
Size of family households - 5-person household (%)
Size of family households - 6-person household (%)
Size of family households - 7-or-more-person household (%)
Size of nonfamily households - 1-person household (%)
Size of nonfamily households - 2-person household (%)
Size of nonfamily households - 3-person household (%)
Size of nonfamily households - 4-person household (%)
Size of nonfamily households - 5-person household (%)
Size of nonfamily households - 6-person household (%)
Size of nonfamily households - 7-or-moreperson household (%)
Year house built - Built 2010 or later (%)
Year house built - Built 2000 to 2009 (%)
Year house built - Built 1990 to 1999 (%)
Year house built - Built 1980 to 1989 (%)
Year house built - Built 1970 to 1979 (%)
Year house built - Built 1960 to 1969 (%)
Year house built - Built 1950 to 1959 (%)
Year house built - Built 1940 to 1949 (%)
Year house built - Built 1939 or earlier (%)
Median number of rooms in houses and condos
Median number of rooms in apartments
Median number of bedrooms in owner occupied houses
Mean number of bedrooms in owner occupied houses
Median number of bedrooms in renter occupied houses
Mean number of bedrooms in renter occupied houses
Median number of vehichles in owner occupied houses
Mean number of vehichles in owner occupied houses
Median number of vehichles in renter occupied houses
Mean number of vehichles in renter occupied houses
Rooms in owner-occupied houses - 1 room (%)
Rooms in owner-occupied houses - 2 rooms (%)
Rooms in owner-occupied houses - 3 rooms (%)
Rooms in owner-occupied houses - 4 rooms (%)
Rooms in owner-occupied houses - 5 rooms (%)
Rooms in owner-occupied houses - 6 rooms (%)
Rooms in owner-occupied houses - 7 rooms (%)
Rooms in owner-occupied houses - 8 rooms (%)
Rooms in owner-occupied houses - 9+ rooms (%)
Rooms in renter-occupied houses - 1 room (%)
Rooms in renter-occupied houses - 2 rooms (%)
Rooms in renter-occupied houses - 3 rooms (%)
Rooms in renter-occupied houses - 4 rooms (%)
Rooms in renter-occupied houses - 5 rooms (%)
Rooms in renter-occupied houses - 6 rooms (%)
Rooms in renter-occupied houses - 7 rooms (%)
Rooms in renter-occupied houses - 8 rooms (%)
Rooms in renter-occupied houses - 9+ rooms (%)
Bedrooms in owner-occupied houses - no bedrooms (%)
Bedrooms in owner-occupied houses - 1 bedroom (%)
Bedrooms in owner-occupied houses - 2 bedrooms (%)
Bedrooms in owner-occupied houses - 3 bedrooms (%)
Bedrooms in owner-occupied houses - 4 bedrooms (%)
Bedrooms in owner-occupied houses - 5+ bedrooms (%)
Bedrooms in renter-occupied houses - no bedrooms (%)
Bedrooms in renter-occupied houses - 1 bedroom (%)
Bedrooms in renter-occupied houses - 2 bedrooms (%)
Bedrooms in renter-occupied houses - 3 bedrooms (%)
Bedrooms in renter-occupied houses - 4 bedrooms (%)
Bedrooms in renter-occupied houses - 5+ bedrooms (%)
Vehicles available in owner-occupied houses - no vehicle available (%)
Vehicles available in owner-occupied houses - 1 vehicle available(%)
Vehicles available in owner-occupied houses - 2 Vehicles available (%)
Vehicles available in owner-occupied houses - 3 Vehicles available (%)
Vehicles available in owner-occupied houses - 4 Vehicles available (%)
Vehicles available in owner-occupied houses - 5+ Vehicles available (%)
Vehicles available in renter-occupied houses - no vehicle available (%)
Vehicles available in renter-occupied houses - 1 vehicle available (%)
Vehicles available in renter-occupied houses - 2 Vehicles available (%)
Vehicles available in renter-occupied houses - 3 Vehicles available (%)
Vehicles available in renter-occupied houses - 4 Vehicles available (%)
Vehicles available in renter-occupied houses - 5+ Vehicles available (%)
Housing units in structures - 1, detached (%)
Housing units in structures - 1, attached (%)
Housing units in structures - 2 (%)
Housing units in structures - 3 or 4 (%)
Housing units in structures - 5 to 9 (%)
Housing units in structures - 10 to 19 (%)
Housing units in structures - 20 to 49 (%)
Housing units in structures - 50 or more (%)
Housing units in structures - Mobile home (%)
Housing units in structures - Boat, RV, van, etc. (%)
Housing units in structures - Owners - 1, detached (%)
Housing units in structures - Owners - 1, attached (%)
Housing units in structures - Owners - 2 (%)
Housing units in structures - Owners - 3 or 4 (%)
Housing units in structures - Owners - 5 to 9 (%)
Housing units in structures - Owners - 10 to 19 (%)
Housing units in structures - Owners - 20 to 49 (%)
Housing units in structures - Owners - 50 or more (%)
Housing units in structures - Owners - Mobile home (%)
Housing units in structures - Owners - Boat, RV, van, etc. (%)
Housing units in structures - Renters - 1, detached (%)
Housing units in structures - Renters - 1, attached (%)
Housing units in structures - Renters - 2 (%)
Housing units in structures - Renters - 3 or 4 (%)
Housing units in structures - Renters - 5 to 9 (%)
Housing units in structures - Renters - 10 to 19 (%)
Housing units in structures - Renters - 20 to 49 (%)
Housing units in structures - Renters - 50 or more (%)
Housing units in structures - Renters - Mobile home (%)
Housing units in structures - Renters - Boat, RV, van, etc. (%)
House/condo owner moved in on average (years ago)
Renter moved in on average (years ago)
Year householder moved into unit - Moved in 1999 to March 2000 (%)
Year householder moved into unit - Moved in 1999 to March 2000 (%) - White
Year householder moved into unit - Moved in 1999 to March 2000 (%) - Black or African American
Year householder moved into unit - Moved in 1999 to March 2000 (%) - Asian
Year householder moved into unit - Moved in 1999 to March 2000 (%) - Hispanic or Latino
Year householder moved into unit - Moved in 1999 to March 2000 (%) - American Indian and Alaska Native
Year householder moved into unit - Moved in 1999 to March 2000 (%) - Multirace
Year householder moved into unit - Moved in 1999 to March 2000 (%) - Other Race
Year householder moved into unit - Moved in 1995 to 1998 (%)
Year householder moved into unit - Moved in 1995 to 1998 (%) - White
Year householder moved into unit - Moved in 1995 to 1998 (%) - Black or African American
Year householder moved into unit - Moved in 1995 to 1998 (%) - Asian
Year householder moved into unit - Moved in 1995 to 1998 (%) - Hispanic or Latino
Year householder moved into unit - Moved in 1995 to 1998 (%) - American Indian and Alaska Native
Year householder moved into unit - Moved in 1995 to 1998 (%) - Multirace
Year householder moved into unit - Moved in 1995 to 1998 (%) - Other Race
Year householder moved into unit - Moved in 1990 to 1994 (%)
Year householder moved into unit - Moved in 1990 to 1994 (%) - White
Year householder moved into unit - Moved in 1990 to 1994 (%) - Black or African American
Year householder moved into unit - Moved in 1990 to 1994 (%) - Asian
Year householder moved into unit - Moved in 1990 to 1994 (%) - Hispanic or Latino
Year householder moved into unit - Moved in 1990 to 1994 (%) - American Indian and Alaska Native
Year householder moved into unit - Moved in 1990 to 1994 (%) - Multirace
Year householder moved into unit - Moved in 1990 to 1994 (%) - Other Race
Year householder moved into unit - Moved in 1980 to 1989 (%)
Year householder moved into unit - Moved in 1980 to 1989 (%) - White
Year householder moved into unit - Moved in 1980 to 1989 (%) - Black or African American
Year householder moved into unit - Moved in 1980 to 1989 (%) - Asian
Year householder moved into unit - Moved in 1980 to 1989 (%) - Hispanic or Latino
Year householder moved into unit - Moved in 1980 to 1989 (%) - American Indian and Alaska Native
Year householder moved into unit - Moved in 1980 to 1989 (%) - Multirace
Year householder moved into unit - Moved in 1980 to 1989 (%) - Other Race
Year householder moved into unit - Moved in 1970 to 1979 (%)
Year householder moved into unit - Moved in 1970 to 1979 (%) - White
Year householder moved into unit - Moved in 1970 to 1979 (%) - Black or African American
Year householder moved into unit - Moved in 1970 to 1979 (%) - Asian
Year householder moved into unit - Moved in 1970 to 1979 (%) - Hispanic or Latino
Year householder moved into unit - Moved in 1970 to 1979 (%) - American Indian and Alaska Native
Year householder moved into unit - Moved in 1970 to 1979 (%) - Multirace
Year householder moved into unit - Moved in 1970 to 1979 (%) - Other Race
Year householder moved into unit - Moved in 1969 or earlier (%)
Year householder moved into unit - Moved in 1969 or earlier (%) - White
Year householder moved into unit - Moved in 1969 or earlier (%) - Black or African American
Year householder moved into unit - Moved in 1969 or earlier (%) - Asian
Year householder moved into unit - Moved in 1969 or earlier (%) - Hispanic or Latino
Year householder moved into unit - Moved in 1969 or earlier (%) - American Indian and Alaska Native
Year householder moved into unit - Moved in 1969 or earlier (%) - Multirace
Year householder moved into unit - Moved in 1969 or earlier (%) - Other Race
Housing units lacking complete plumbing facilities (%)
Housing units lacking complete kitchen facilities (%)
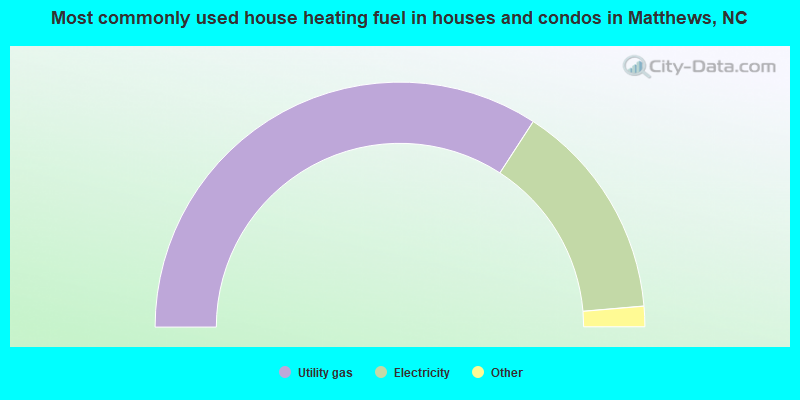
House heating fuel used in houses and condos - Utility gas (%)
House heating fuel used in houses and condos - Bottled, tank, or LP gas (%)
House heating fuel used in houses and condos - Electricity (%)
House heating fuel used in houses and condos - Fuel oil, kerosene, etc. (%)
House heating fuel used in houses and condos - Coal or coke (%)
House heating fuel used in houses and condos - Wood (%)
House heating fuel used in houses and condos - Solar energy (%)
House heating fuel used in houses and condos - Other fuel (%)
House heating fuel used in houses and condos - No fuel used (%)
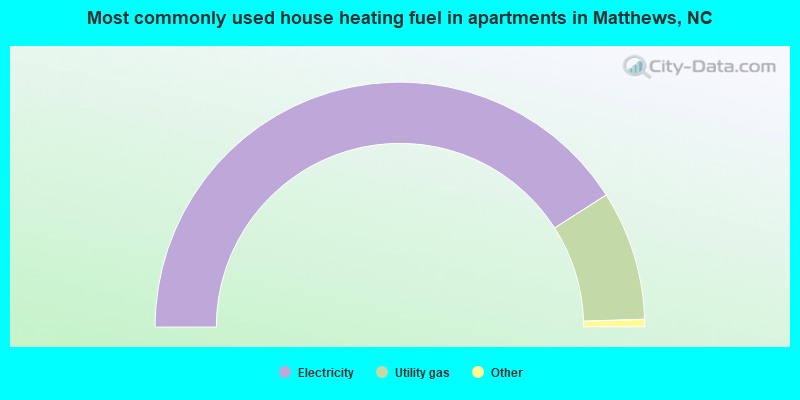
House heating fuel used in apartments - Utility gas (%)
House heating fuel used in apartments - Bottled, tank, or LP gas (%)
House heating fuel used in apartments - Electricity (%)
House heating fuel used in apartments - Fuel oil, kerosene, etc. (%)
House heating fuel used in apartments - Coal or coke (%)
House heating fuel used in apartments - Wood (%)
House heating fuel used in apartments - Solar energy (%)
House heating fuel used in apartments - Other fuel (%)
House heating fuel used in apartments - No fuel used (%)
Latest news about housing in Matthews, NC collected exclusively by city-data.com from local newspapers, TV, and radio stations
Median year house/condo built: 1992Median year apartment built: 2002Household type by relationship:
Households: 30,409
Male householders: 6,003 (939 living alone ), Female householders: 5,355 (1,607 living alone )6,791 spouses (6,761 opposite-sex spouses ), 565 unmarried partners , (507 opposite-sex unmarried partners ), 9,330 children (8,976 natural , 159 adopted , 195 stepchildren ), 430 grandchildren , 143 brothers or sisters , 407 parents , 0 foster children , 404 other relatives , 658 non-relatives In group quarters: 318
Size of family households: 3,779 2-persons , 2,004 3-persons , 1,415 4-persons , 559 5-persons , 248 6-persons , 138 7-or-more-persons .
Size of nonfamily households: 2,764 1-person , 483 2-persons , 104 3-persons , 17 6-persons .
5,149 married couples with children. single-parent households (149 men , 491 women ).
83.8% of residents of Matthews speak English at home. of residents speak Spanish at home (71% speak English very well , 13% speak English well , 10% speak English not well , 5% don't speak English at all ).of residents speak other Indo-European language at home (79% speak English very well , 15% speak English well , 6% speak English not well ).of residents speak Asian or Pacific Island language at home (31% speak English very well , 11% speak English well , 25% speak English not well , 32% don't speak English at all ).of residents speak other language at home (63% speak English very well , 36% speak English well , 1% speak English not well ).
Foreign born population: 3,752 (12.3%)of them are naturalized citizens )
Median number of rooms in houses and condos:
Median number of rooms in apartments
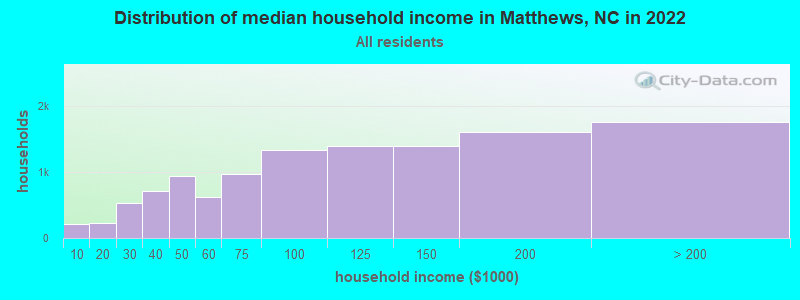
Matthews, NC household income distribution 217 Less than $10,000221 $10,000 to $19,999533 $20,000 to $29,999717 $30,000 to $39,999940 $40,000 to $49,999618 $50,000 to $59,999971 $60,000 to $74,9991,339 $75,000 to $99,9991,388 $100,000 to $124,9991,395 $125,000 to $149,9991,613 $150,000 to $199,9991,757 $200,000 or more
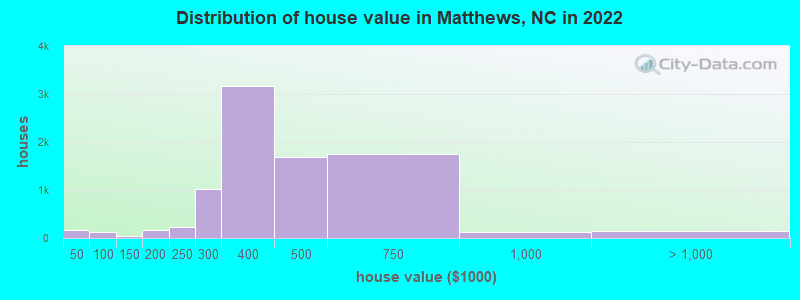
Home value of owner - occupied houses in 2022 in Matthews, NC 25 Less than $10,0008 $25,000 to $29,99912 $35,000 to $39,999113 $40,000 to $49,9993 $50,000 to $59,9995 $70,000 to $79,9994 $80,000 to $89,99927 $100,000 to $124,99921 $125,000 to $149,99956 $150,000 to $174,999100 $175,000 to $199,999227 $200,000 to $249,9991,026 $250,000 to $299,9993,169 $300,000 to $399,9991,686 $400,000 to $499,9991,746 $500,000 to $749,999126 $750,000 to $999,99983 $1,000,000 to $1,499,99915 $1,500,000 to $1,999,99956 $2,000,000 or moreRent paid by renters in 2022 in Matthews, NC 29 $100 to $14911 $500 to $54927 $550 to $59951 $650 to $69940 $700 to $7497 $800 to $89937 $900 to $999661 $1,000 to $1,2491,423 $1,250 to $1,4991,033 $1,500 to $1,999259 $2,000 to $2,49960 $2,500 to $2,999102 $3,000 to $3,499149 $3,500 or more125 No cash rent
Percentage of workers working in this county: 86.5%Number of people working at home: 3,495 (21.2% of all workers )
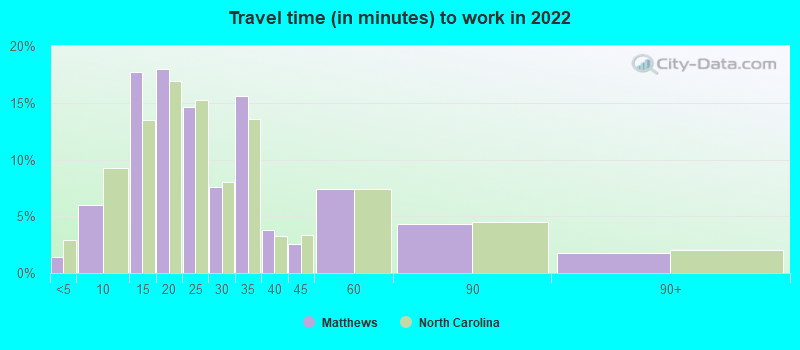
Travel time to work (commute)
Less than 5 minutes: 1545 to 9 minutes: 93610 to 14 minutes: 1,68215 to 19 minutes: 1,89920 to 24 minutes: 1,71625 to 29 minutes: 87930 to 34 minutes: 2,31635 to 39 minutes: 47840 to 44 minutes: 53345 to 59 minutes: 1,28960 to 89 minutes: 30590 or more minutes: 156
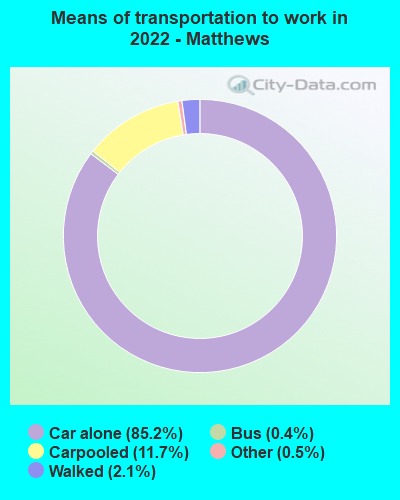
Means of transportation to work:
Drove a car alone: 16,333 (69.7%)Carpooled: 2,422 (10.3%)Bus : 49 (0.2%)Taxi: 91 (0.4%)Bicycle: 14 (0.1%)Walked: 395 (1.7%)Worked at home: 3,495 (14.9%)
Unemployment by race in 2022
Unemployment rate for White non-Hispanic residents 1.4% Males2.5% FemalesUnemployment rate for Black residents 1.9% Males5.6% FemalesUnemployment rate for American Indian and Alaska Native residents 100.0% FemalesUnemployment rate for other race residents 2.5% FemalesUnemployment rate for two or more race residents 3.5% FemalesUnemployment rate for Hispanic or Latino residents 4.7% Females
Year of entry for the foreign-born population in Matthews, North Carolina
1,212 2010 or later 984 2000 to 2009 882 1990 to 1999 255 1980 to 1989 139 1970 to 1979 340 Before 1970
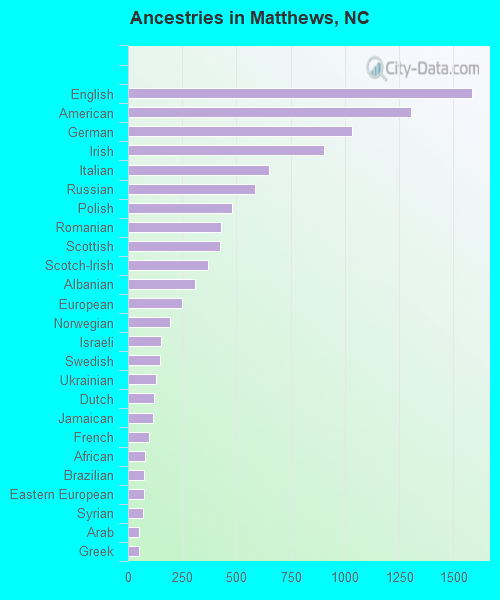
First ancestries reported:
English: 1,585 (10.0%)
American: 1,303 (8.2%)
German: 1,034 (6.5%)
Irish: 905 (5.7%)
Italian: 648 (4.1%)
Russian: 586 (3.7%)
Polish: 479 (3.0%)
Romanian: 431 (2.7%)
Scottish: 423 (2.7%)
Scotch-Irish: 368 (2.3%)
Albanian: 311 (2.0%)
European: 249 (1.6%)
Norwegian: 195 (1.2%)
Israeli: 153 (1.0%)
Swedish: 146 (0.9%)
Ukrainian: 131 (0.8%)
Dutch: 118 (0.7%)
Jamaican: 116 (0.7%)
French: 96 (0.6%)
African: 77 (0.5%)
Brazilian: 74 (0.5%)
Eastern European: 73 (0.5%)
Syrian: 70 (0.4%)
Arab: 53 (0.3%)
Greek: 53 (0.3%)
Haitian: 45 (0.3%)
Welsh: 42 (0.3%)
Armenian: 37 (0.2%)
British: 36 (0.2%)
Slavic: 35 (0.2%)
Nigerian: 30 (0.2%)
Yugoslavian: 28 (0.2%)
French Canadian: 22 (0.1%)
Bulgarian: 21 (0.1%)
Maltese: 20 (0.1%)
Hungarian: 20 (0.1%)
Lebanese: 17 (0.1%)
West Indian: 16 (0.1%)
Sudanese: 13 (0.08%)
Scandinavian: 10 (0.06%)
Serbian: 6 (0.04%)
Lithuanian: 5 (0.03%)
Czech: 5 (0.03%) Most common places of birth for foreign-born residents (%): India Matthews:
14.8% (581)North Carolina:
9.3% (80,594)
China, excluding Hong Kong and Taiwan Matthews:
11.7% (459)North Carolina:
3.2% (27,477)
Russia Matthews:
7.0% (274)North Carolina:
0.9% (8,067)
Vietnam Matthews:
4.9% (191)North Carolina:
2.9% (24,965)
Moldova Matthews:
4.5% (176)North Carolina:
0.2% (1,824)
Venezuela Matthews:
2.7% (105)North Carolina:
1.2% (9,986)
Colombia Matthews:
2.6% (104)North Carolina:
2.1% (18,275)
Israel Matthews:
2.5% (98)North Carolina:
0.1% (994)
Brazil Matthews:
2.5% (97)North Carolina:
1.0% (8,426)
Belarus Matthews:
2.4% (95)North Carolina:
0.1% (1,097)
Albania Matthews:
2.3% (89)North Carolina:
0.1% (699)
Syria Matthews:
2.1% (84)North Carolina:
0.2% (1,332)
Mexico Matthews:
2.1% (82)North Carolina:
24.7% (214,776)
Jamaica Matthews:
1.8% (71)North Carolina:
1.3% (11,419)
Honduras Matthews:
1.8% (70)North Carolina:
4.7% (40,707)
Ukraine Matthews:
1.7% (68)North Carolina:
0.8% (6,645)
Philippines Matthews:
1.7% (66)North Carolina:
2.4% (20,695)
South Africa Matthews:
1.6% (64)North Carolina:
0.5% (4,673)
Pakistan Matthews:
1.6% (63)North Carolina:
0.7% (6,226)
Korea Matthews:
1.5% (60)North Carolina:
1.8% (15,988)
Place of birth for U.S.-born residents:
This state: 11,090Other state: 15,320Northeast: 4,791Midwest: 3,079South: 6,238West: 1,195 88.4% of Matthews residents lived in the same house 1 years ago.
Out of people who lived in different houses, 31.3% lived in this county.
Out of people who lived in different counties, 50.5% lived in North Carolina.
Matthews:
88.4%State average:
87.3%
Education attainment for males 25 years and older:
No schooling: 74Nursery to 4th grade: 05th and 6th grade: 887th and 8th grade: 499th grade: 2910th grade: 30211th grade: 4212th grade, no diploma: 75High school graduate (or equivalency): 1,826Less than 1 year of college: 546Some college more than 1 year, no degree: 1,252Associate degree: 857Bachelor's degree: 4,191Master's degree: 1,126Professional school degree: 240Doctorate degree: 197
Education attainment for females 25 years and older:
No schooling: 115Nursery to 4th grade: 125th and 6th grade: 337th and 8th grade: 439th grade: 5810th grade: 3211th grade: 4612th grade, no diploma: 71High school graduate (or equivalency): 1,820Less than 1 year of college: 641Some college more than 1 year, no degree: 1,253Associate degree: 748Bachelor's degree: 4,519Master's degree: 1,499Professional school degree: 94Doctorate degree: 126
Housing units in structures:
One, detached: 7,962One, attached: 448Two: 663 or 4: 2675 to 9: 29910 to 19: 1,06220 to 49: 1,26850 or more: 826Mobile homes: 135Median worth of mobile homes: $56,840
Housing units lacking complete plumbing facilities in 2022: 0.2%Housing units lacking complete kitchen facilities in 2022: 0.6%House/condo owner moved in on average 12 years ago
Renter moved in on average 1 years ago
Private vs. public school enrollment:
Students in private schools in grades 1 to 8 (elementary and middle school): 303 Here:
13.5%North Carolina:
13.8%
Students in private schools in grades 9 to 12 (high school): 247 Here:
18.1%North Carolina:
11.9%
Students in private undergraduate colleges: 65 Here:
5.6%North Carolina:
19.3%