McCloud, CA (California) Houses and Residents
| McCloud: | $319,022 |
| California: | $715,900 |
Mean price in 2022:
Detached houses: $363,707
Here: $363,707 State: $988,808 Mobile homes: $80,090
Here: $80,090 State: $184,506
Total population: 1,101 (Urban population: 0, Rural population: 1,351 (all nonfarm))
Houses: 648 (436 occupied: 313 owner occupied, 124 renter occupied)
| % of renters here: | 28% |
| State: | 44% |
Housing density: 265 houses/condos per square mile
Median price asked for vacant for-sale houses and condos in 2022: $254,752.
Median contract rent in 2022: $1,054 (lower quartile is $483, upper quartile is $1,233)
Median rent asked for vacant for-rent units in 2022: $745
Median gross rent in McCloud, CA in 2022: $1,144
Housing units in McCloud with a mortgage: 96 (0 second mortgage, 0 home equity loan, 0 both second mortgage and home equity loan)
Houses without a mortgage: 0
Median household income for houses/condos with a mortgage: $66,087
Median household income for apartments without a mortgage: $40,587
Median monthly housing costs: $621
Compare current foreclosures near McCloud, CA:
| Photo | Address | Area | Beds / Baths | Price | Details |
|---|---|---|---|---|---|

|
#1
Snowline Cir
Mccloud, CA 96057
|
- sq. feet
|
- baths - beds |
$20,000
|
show details |

|
#2
Siskiyou Ave
Dunsmuir, CA 96025
|
1,412 sq. feet
|
2 baths 3 beds |
show details | |

|
#3
S A St
Mount Shasta, CA 96067
|
912 sq. feet
|
1 baths 2 beds |
show details | |

|
#4
Wells Ave
Dunsmuir, CA 96025
|
- sq. feet
|
- baths - beds |
$30,000
|
show details |

|
#5
Siskiyou Ave
Dunsmuir, CA 96025
|
- sq. feet
|
- baths - beds |
$15,000
|
show details |

|
#6
5816 Dunsmuir Ave
Dunsmuir, CA 96025
|
- sq. feet
|
- baths - beds |
$25,000
|
show details |

|
#7
Sacramento Ave
Dunsmuir, CA 96025
|
- sq. feet
|
- baths - beds |
$20,000
|
show details |

|
#8
Dunsmuir Ave
Dunsmuir, CA 96025
|
- sq. feet
|
- baths - beds |
$20,000
|
show details |

|
#9
Cayuse Meadows Rd
Mount Shasta, CA 96067
|
- sq. feet
|
- baths - beds |
$15,000
|
show details |

|
#10
Michele Dr
Mount Shasta, CA 96067
|
3,084 sq. feet
|
3 baths 4 beds |
show details |
| Photo | Address | Area | Beds / Baths | Price | Details |
|---|---|---|---|---|---|

|
#11
Cedar View Ln
Mount Shasta, CA 96067
|
- sq. feet
|
- baths - beds |
$16,000
|
show details |

|
#12
Alpine St
Dunsmuir, CA 96025
|
- sq. feet
|
- baths - beds |
show details | |

|
#13
Gleaves Ave
Dunsmuir, CA 96025
|
- sq. feet
|
- baths - beds |
show details | |

|
#14
Orem St
Mount Shasta, CA 96067
|
- sq. feet
|
- baths - beds |
show details | |

|
#15
Castle Ave
Dunsmuir, CA 96025
|
- sq. feet
|
- baths - beds |
show details | |

|
#16
N Old Stage Rd
Weed, CA 96094
|
- sq. feet
|
- baths - beds |
show details | |

|
Check over 1 million property listings on Foreclosure.com!
|
browse all offers | |||

Latest news about housing in McCloud, CA collected exclusively by city-data.com from local newspapers, TV, and radio stations

 | Small Town + Nature + Healthy Lifestyle (34 replies) |
| Is it possible to buy a house/condon under $100,000 in LA? (22 replies) |
| Driving up to Mount Shasta this weekend (12 replies) |
| Redding, CA please don’t move here. (170 replies) |
| Mountain town in northern CA (11 replies) |
| Cheap old or historic buildings--any in California? (11 replies) |

Median year apartment built: 1938
Household type by relationship:
Households: 951- Male householders: 207 (78 living alone), Female householders: 219 (109 living alone)
186 spouses (186 opposite-sex spouses), 0 unmarried partners, (0 opposite-sex unmarried partners), 300 children (297 natural, 0 adopted, 2 stepchildren), 0 grandchildren, 0 brothers or sisters, 25 parents, 0 foster children, 0 other relatives, 6 non-relatives
- In group quarters: 4
Size of family households: 167 2-persons, 36 3-persons, 13 4-persons, 11 5-persons, 10 6-persons.
Size of nonfamily households: 196 1-person, 5 2-persons.
68 married couples with children.
69 single-parent households (20 men, 49 women).
96.8% of residents of McCloud speak English at home.
0.6% of residents speak Spanish at home (100% speak English very well).
2.2% of residents speak other Indo-European language at home (100% speak English very well).
0.8% of residents speak Asian or Pacific Island language at home (38% speak English very well, 62% speak English well).
Foreign born population: 28 (2.9%)
(82.1% of them are naturalized citizens)
| Here: | 4.9 |
| State: | 6.0 |
| Here: | 5.2 |
| State: | 3.9 |

- Bedrooms in owner-occupied houses and condos in McCloud, California
- 0no bedroom
- 171 bedroom
- 1222 bedrooms
- 1693 bedrooms
- 54 bedrooms
- 05+ bedrooms

- Bedrooms in renter-occupied apartments in McCloud, California
- 0no bedroom
- 311 bedroom
- 352 bedrooms
- 103 bedrooms
- 494 bedrooms
- 05+ bedrooms

- Cars and other vehicles available in McCloud in owner-occupied houses/condos
- 20no vehicle
- 941 vehicle
- 1142 vehicles
- 513 vehicles
- 124 vehicles
- 225+ vehicles

- Cars and other vehicles available in McCloud in renter-occupied apartments
- 14no vehicle
- 441 vehicle
- 192 vehicles
- 473 vehicles
- 04 vehicles
- 05+ vehicles

- Rooms in owner-occupied houses in McCloud, California
- 01 room
- 62 rooms
- 283 rooms
- 604 rooms
- 1435 rooms
- 536 rooms
- 197 rooms
- 18 rooms
- 29+ rooms

- Rooms in renter-occupied apartments in McCloud, California
- 01 room
- 182 rooms
- 103 rooms
- 174 rooms
- 245 rooms
- 436 rooms
- 117 rooms
- 08 rooms
- 09+ rooms


McCloud, CA household income distribution

- 24Less than $10,000
- 57$10,000 to $19,999
- 75$20,000 to $29,999
- 52$30,000 to $39,999
- 36$40,000 to $49,999
- 33$50,000 to $59,999
- 48$60,000 to $74,999
- 31$75,000 to $99,999
- 21$100,000 to $124,999
- 11$125,000 to $149,999
- 46$150,000 to $199,999
- 2$200,000 or more
Home value of owner - occupied houses in 2022 in McCloud, CA
-
- 7Less than $10,000
- 20$15,000 to $19,999
- 2$35,000 to $39,999
- 3$90,000 to $99,999
- 6$100,000 to $124,999
- 3$125,000 to $149,999
- 11$150,000 to $174,999
- 5$175,000 to $199,999
- 26$200,000 to $249,999
- 37$250,000 to $299,999
- 75$300,000 to $399,999
- 15$400,000 to $499,999
- 33$500,000 to $749,999
- 8$1,000,000 to $1,499,999
Rent paid by renters in 2022 in McCloud, CA
-
- 21$300 to $349
- 3$350 to $399
- 4$450 to $499
- 4$550 to $599
- 4$700 to $749
- 3$750 to $799
- 1$800 to $899
- 4$900 to $999
- 41$1,000 to $1,249
- 14$1,250 to $1,499
- 10$1,500 to $1,999


Percentage of workers working in this county: 98.1%
Number of people working at home: 16 (5.0% of all workers)
Travel time to work (commute)
- Less than 5 minutes: 93
- 5 to 9 minutes: 69
- 10 to 14 minutes: 14
- 15 to 19 minutes: 26
- 20 to 24 minutes: 36
- 25 to 29 minutes: 0
- 30 to 34 minutes: 0
- 35 to 39 minutes: 8
- 40 to 44 minutes: 0
- 45 to 59 minutes: 13
- 60 to 89 minutes: 29
- 90 or more minutes: 4
Means of transportation to work:
- Drove a car alone: 211 (53.7%)
- Carpooled: 70 (17.8%)
- Bus or trolley bus: 2 (0.5%)
- Taxi: 12 (3.1%)
- Walked: 19 (4.8%)
- Worked at home: 128 (32.6%)

- Unemployment by race in 2022
- Unemployment rate for White non-Hispanic residents
- 2.7%Males
- 12.8%Females
- Unemployment rate for other race residents
- 100.0%Females
- Unemployment rate for two or more race residents
- 8.5%Males
- Unemployment rate for Hispanic or Latino residents
- 100.0%Females

- Year of entry for the foreign-born population in McCloud, California
- 02010 or later
- 02000 to 2009
- 61990 to 1999
- 21980 to 1989
- 01970 to 1979
- 29Before 1970
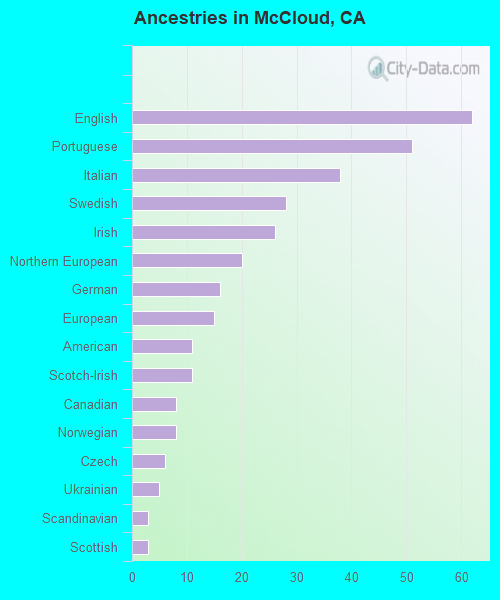
First ancestries reported:
- English: 62 (17.8%)
- Portuguese: 51 (14.7%)
- Italian: 38 (10.9%)
- Swedish: 28 (8.1%)
- Irish: 26 (7.5%)
- Northern European: 20 (5.8%)
- German: 16 (4.6%)
- European: 15 (4.3%)
- American: 11 (3.2%)
- Scotch-Irish: 11 (3.2%)
- Canadian: 8 (2.3%)
- Norwegian: 8 (2.3%)
- Czech: 6 (1.7%)
- Ukrainian: 5 (1.4%)
- Scandinavian: 3 (0.9%)
- Scottish: 3 (0.9%)
Most common places of birth for foreign-born residents (%):
| McCloud: | 32.1% (9) |
| California: | 0.3% (31,439) |
| McCloud: | 21.4% (6) |
| California: | 37.2% (3,881,193) |
| McCloud: | 17.9% (5) |
| California: | 0.7% (73,304) |
| McCloud: | 17.9% (5) |
| California: | 0.3% (33,937) |
Place of birth for U.S.-born residents:
- This state: 752
- Other state: 160
- Northeast: 29
- Midwest: 27
- South: 57
- West: 45
99.3% of McCloud residents lived in the same house 1 years ago.
Out of people who lived in different houses, 36.8% lived in this county.
Out of people who lived in different counties, 75.0% lived in California.
| McCloud: | 99.3% |
| State average: | 88.9% |
Education attainment for males 25 years and older:
- No schooling: 5
- Nursery to 4th grade: 0
- 5th and 6th grade: 0
- 7th and 8th grade: 0
- 9th grade: 1
- 10th grade: 0
- 11th grade: 0
- 12th grade, no diploma: 18
- High school graduate (or equivalency): 101
- Less than 1 year of college: 24
- Some college more than 1 year, no degree: 54
- Associate degree: 27
- Bachelor's degree: 63
- Master's degree: 1
- Professional school degree: 8
- Doctorate degree: 0

Education attainment for females 25 years and older:
- No schooling: 4
- Nursery to 4th grade: 0
- 5th and 6th grade: 0
- 7th and 8th grade: 0
- 9th grade: 0
- 10th grade: 0
- 11th grade: 5
- 12th grade, no diploma: 0
- High school graduate (or equivalency): 130
- Less than 1 year of college: 35
- Some college more than 1 year, no degree: 81
- Associate degree: 57
- Bachelor's degree: 36
- Master's degree: 1
- Professional school degree: 5
- Doctorate degree: 0


Housing units in structures:
- One, detached: 539
- One, attached: 11
- Two: 16
- 3 or 4: 6
- 5 to 9: 32
- 20 to 49: 12
- Mobile homes: 31
House/condo owner moved in on average 27 years ago
Renter moved in on average 3 years ago

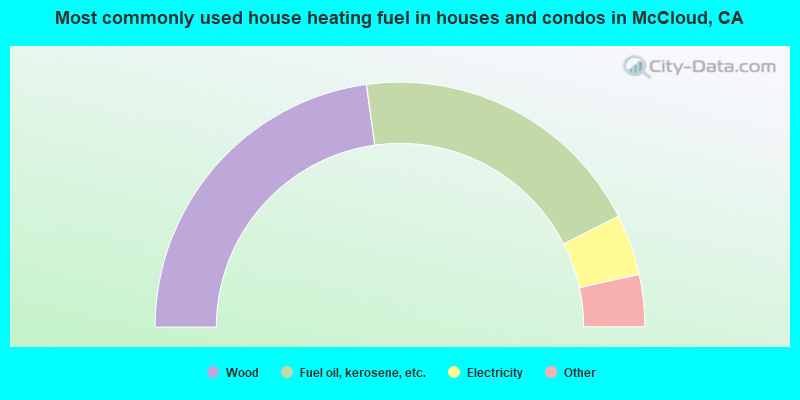
- 45.8%Wood
- 39.6%Fuel oil, kerosene, etc.
- 8.1%Electricity
- 3.6%Bottled, tank, or LP gas
- 2.9%Utility gas
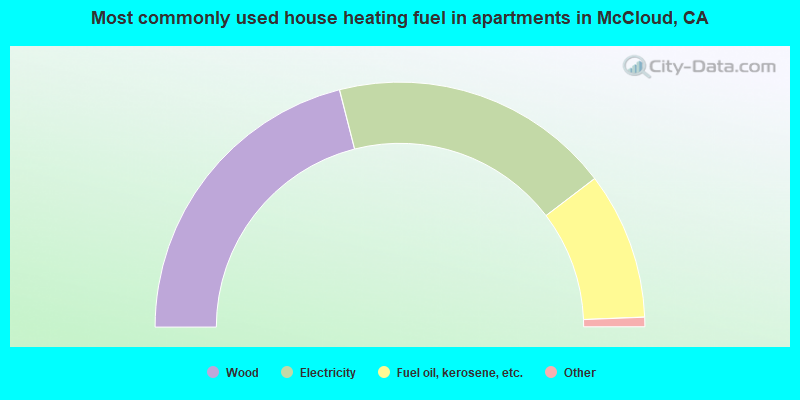
- 42.6%Wood
- 37.7%Electricity
- 19.7%Fuel oil, kerosene, etc.
Private vs. public school enrollment:
| Here: | 0.0% |
| California: | 10.5% |
| Here: | 1.8% |
| California: | 8.5% |
| Here: | 0.0% |
| California: | 15.9% |


