McKinney, TX (Texas) Houses and Residents
Estimated median house or condo value in 2022: $471,300 (it was $145,400 in 2000 )
McKinney:
$471,300Texas:
$275,400
Lower value quartile - upper value quartile: $359,700 - $639,200Mean price in 2022: Detached houses: $452,558 Here:
$452,558State:
$369,058
Townhouses or other attached units: $427,538 Here:
$427,538State:
$327,631
In 2-unit structures: $428,837 Here:
$428,837State:
$374,947
In 3-to-4-unit structures: $250,337 Here:
$250,337State:
$209,652
In 5-or-more-unit structures: $285,981 Here:
$285,981State:
$413,944
Mobile homes: $98,856 Here:
$98,856State:
$124,413
Total population: 156,767 (Urban population: 52,055, Rural population: 2,329 (16 farm, 2,313 nonfarm ))
Houses: 79,562 (75,237 occupied: 46,527 owner occupied, 28,710 renter occupied )
% of renters here:
38%State:
38%
Housing density: 1,371 houses/condos per square mile
Median price asked for vacant for-sale houses and condos in 2022: $308,544.
Median contract rent in 2022: $1,685 (lower quartile is $1,338, upper quartile is over $2,000)
Median rent asked for vacant for-rent units in 2022: $2,210
Median gross rent in McKinney, TX in 2022: $1,877
Housing units in McKinney with a mortgage: 33,759 (1,707 second mortgage, 111 home equity loan, 1,395 both second mortgage and home equity loan )Houses without a mortgage: 198
Median household income for houses/condos with a mortgage: $152,936
Median household income for apartments without a mortgage: $93,273
Median monthly housing costs: $1,986
Data:
Median house or condo value ($)
Median house or condo value ($ change since 2000)
Median house or condo value ($) - White
Median house or condo value ($) - Black or African American
Median house or condo value ($) - Asian
Median house or condo value ($) - Hispanic or Latino
Median house or condo value ($) - American Indian and Alaska Native
Median house or condo value ($) - Multirace
Median house or condo value ($) - Other Race
Median price asked for mobile homes ($)
Household density (households per square mile)
Mean house or condo value by units in structure - 1, detached ($)
Mean house or condo value by units in structure - 1, attached ($)
Mean house or condo value by units in structure - 2 ($)
Mean house or condo value by units in structure by units in structure - 3 or 4 ($)
Mean house or condo value by units in structure - 5 or more ($)
Mean house or condo value by units in structure - Boat, RV, van, etc. ($)
Mean house or condo value by units in structure - Mobile home ($)
Median contract rent ($)
Median contract rent - Lower quartile ($)
Median contract rent - Upper quartile ($)
Median gross rent ($)
Urban houses (%)
Rural houses (%)
Houses occupied (%)
Houses occupied (% change since 2000)
Houses owner occupied (%)
Houses owner occupied (% change since 2000)
Houses renter occupied (%)
Houses renter occupied (% change since 2000)
Vacant housing units - For rent (%)
Vacant housing units - For rent (% change since 2000)
Vacant housing units - For sale only (%)
Vacant housing units - For sale only (% change since 2000)
Vacant housing units - Rented or sold, not occupied (%)
Vacant housing units - Rented or sold, not occupied (% change since 2000)
Vacant housing units - For seasonal, recreational, or occasional use (%)
Vacant housing units - For seasonal, recreational, or occasional use (% change since 2000)
Vacant housing units - For migrant workers (%)
Vacant housing units - For migrant workers (% change since 2000)
Vacant housing units - Other vacant (%)
Vacant housing units - Other vacant (% change since 2000)
Median monthly housing costs ($)
Median household income for houses/condos with a mortgage ($)
Median household income for houses/condos without a mortgage ($)
Median household income ($)
Median household income ($) - White
Median household income ($) - Black or African American
Median household income ($) - Asian
Median household income ($) - Hispanic or Latino
Median household income ($) - American Indian and Alaska Native
Median household income ($) - Multirace
Median household income ($) - Other Race
Mortgage status - with mortgage (%)
Mortgage status - with second mortgage (%)
Mortgage status - with home equity loan (%)
Mortgage status - with both second mortgage and home equity loan (%)
Mortgage status - without a mortgage (%)
Median year house/condo built
Median year apartment built
Household type by relationship - Male householder living alone (%)
Household type by relationship - Male householder not living alone (%)
Household type by relationship - Female householder living alone (%)
Household type by relationship - Female householder not living alone (%)
Household type by relationship - Opposite-Sex spouse (%)
Household type by relationship - Same-Sex spouse (%)
Household type by relationship - Opposite-Sex unmarried partner (%)
Household type by relationship - Same-Sex unmarried partner (%)
Household type by relationship - In group quarters (%)
Size of family households - 2-person household (%)
Size of family households - 3-person household (%)
Size of family households - 4-person household (%)
Size of family households - 5-person household (%)
Size of family households - 6-person household (%)
Size of family households - 7-or-more-person household (%)
Size of nonfamily households - 1-person household (%)
Size of nonfamily households - 2-person household (%)
Size of nonfamily households - 3-person household (%)
Size of nonfamily households - 4-person household (%)
Size of nonfamily households - 5-person household (%)
Size of nonfamily households - 6-person household (%)
Size of nonfamily households - 7-or-moreperson household (%)
Year house built - Built 2010 or later (%)
Year house built - Built 2000 to 2009 (%)
Year house built - Built 1990 to 1999 (%)
Year house built - Built 1980 to 1989 (%)
Year house built - Built 1970 to 1979 (%)
Year house built - Built 1960 to 1969 (%)
Year house built - Built 1950 to 1959 (%)
Year house built - Built 1940 to 1949 (%)
Year house built - Built 1939 or earlier (%)
Median number of rooms in houses and condos
Median number of rooms in apartments
Median number of bedrooms in owner occupied houses
Mean number of bedrooms in owner occupied houses
Median number of bedrooms in renter occupied houses
Mean number of bedrooms in renter occupied houses
Median number of vehichles in owner occupied houses
Mean number of vehichles in owner occupied houses
Median number of vehichles in renter occupied houses
Mean number of vehichles in renter occupied houses
Rooms in owner-occupied houses - 1 room (%)
Rooms in owner-occupied houses - 2 rooms (%)
Rooms in owner-occupied houses - 3 rooms (%)
Rooms in owner-occupied houses - 4 rooms (%)
Rooms in owner-occupied houses - 5 rooms (%)
Rooms in owner-occupied houses - 6 rooms (%)
Rooms in owner-occupied houses - 7 rooms (%)
Rooms in owner-occupied houses - 8 rooms (%)
Rooms in owner-occupied houses - 9+ rooms (%)
Rooms in renter-occupied houses - 1 room (%)
Rooms in renter-occupied houses - 2 rooms (%)
Rooms in renter-occupied houses - 3 rooms (%)
Rooms in renter-occupied houses - 4 rooms (%)
Rooms in renter-occupied houses - 5 rooms (%)
Rooms in renter-occupied houses - 6 rooms (%)
Rooms in renter-occupied houses - 7 rooms (%)
Rooms in renter-occupied houses - 8 rooms (%)
Rooms in renter-occupied houses - 9+ rooms (%)
Bedrooms in owner-occupied houses - no bedrooms (%)
Bedrooms in owner-occupied houses - 1 bedroom (%)
Bedrooms in owner-occupied houses - 2 bedrooms (%)
Bedrooms in owner-occupied houses - 3 bedrooms (%)
Bedrooms in owner-occupied houses - 4 bedrooms (%)
Bedrooms in owner-occupied houses - 5+ bedrooms (%)
Bedrooms in renter-occupied houses - no bedrooms (%)
Bedrooms in renter-occupied houses - 1 bedroom (%)
Bedrooms in renter-occupied houses - 2 bedrooms (%)
Bedrooms in renter-occupied houses - 3 bedrooms (%)
Bedrooms in renter-occupied houses - 4 bedrooms (%)
Bedrooms in renter-occupied houses - 5+ bedrooms (%)
Vehicles available in owner-occupied houses - no vehicle available (%)
Vehicles available in owner-occupied houses - 1 vehicle available(%)
Vehicles available in owner-occupied houses - 2 Vehicles available (%)
Vehicles available in owner-occupied houses - 3 Vehicles available (%)
Vehicles available in owner-occupied houses - 4 Vehicles available (%)
Vehicles available in owner-occupied houses - 5+ Vehicles available (%)
Vehicles available in renter-occupied houses - no vehicle available (%)
Vehicles available in renter-occupied houses - 1 vehicle available (%)
Vehicles available in renter-occupied houses - 2 Vehicles available (%)
Vehicles available in renter-occupied houses - 3 Vehicles available (%)
Vehicles available in renter-occupied houses - 4 Vehicles available (%)
Vehicles available in renter-occupied houses - 5+ Vehicles available (%)
Housing units in structures - 1, detached (%)
Housing units in structures - 1, attached (%)
Housing units in structures - 2 (%)
Housing units in structures - 3 or 4 (%)
Housing units in structures - 5 to 9 (%)
Housing units in structures - 10 to 19 (%)
Housing units in structures - 20 to 49 (%)
Housing units in structures - 50 or more (%)
Housing units in structures - Mobile home (%)
Housing units in structures - Boat, RV, van, etc. (%)
Housing units in structures - Owners - 1, detached (%)
Housing units in structures - Owners - 1, attached (%)
Housing units in structures - Owners - 2 (%)
Housing units in structures - Owners - 3 or 4 (%)
Housing units in structures - Owners - 5 to 9 (%)
Housing units in structures - Owners - 10 to 19 (%)
Housing units in structures - Owners - 20 to 49 (%)
Housing units in structures - Owners - 50 or more (%)
Housing units in structures - Owners - Mobile home (%)
Housing units in structures - Owners - Boat, RV, van, etc. (%)
Housing units in structures - Renters - 1, detached (%)
Housing units in structures - Renters - 1, attached (%)
Housing units in structures - Renters - 2 (%)
Housing units in structures - Renters - 3 or 4 (%)
Housing units in structures - Renters - 5 to 9 (%)
Housing units in structures - Renters - 10 to 19 (%)
Housing units in structures - Renters - 20 to 49 (%)
Housing units in structures - Renters - 50 or more (%)
Housing units in structures - Renters - Mobile home (%)
Housing units in structures - Renters - Boat, RV, van, etc. (%)
House/condo owner moved in on average (years ago)
Renter moved in on average (years ago)
Year householder moved into unit - Moved in 1999 to March 2000 (%)
Year householder moved into unit - Moved in 1999 to March 2000 (%) - White
Year householder moved into unit - Moved in 1999 to March 2000 (%) - Black or African American
Year householder moved into unit - Moved in 1999 to March 2000 (%) - Asian
Year householder moved into unit - Moved in 1999 to March 2000 (%) - Hispanic or Latino
Year householder moved into unit - Moved in 1999 to March 2000 (%) - American Indian and Alaska Native
Year householder moved into unit - Moved in 1999 to March 2000 (%) - Multirace
Year householder moved into unit - Moved in 1999 to March 2000 (%) - Other Race
Year householder moved into unit - Moved in 1995 to 1998 (%)
Year householder moved into unit - Moved in 1995 to 1998 (%) - White
Year householder moved into unit - Moved in 1995 to 1998 (%) - Black or African American
Year householder moved into unit - Moved in 1995 to 1998 (%) - Asian
Year householder moved into unit - Moved in 1995 to 1998 (%) - Hispanic or Latino
Year householder moved into unit - Moved in 1995 to 1998 (%) - American Indian and Alaska Native
Year householder moved into unit - Moved in 1995 to 1998 (%) - Multirace
Year householder moved into unit - Moved in 1995 to 1998 (%) - Other Race
Year householder moved into unit - Moved in 1990 to 1994 (%)
Year householder moved into unit - Moved in 1990 to 1994 (%) - White
Year householder moved into unit - Moved in 1990 to 1994 (%) - Black or African American
Year householder moved into unit - Moved in 1990 to 1994 (%) - Asian
Year householder moved into unit - Moved in 1990 to 1994 (%) - Hispanic or Latino
Year householder moved into unit - Moved in 1990 to 1994 (%) - American Indian and Alaska Native
Year householder moved into unit - Moved in 1990 to 1994 (%) - Multirace
Year householder moved into unit - Moved in 1990 to 1994 (%) - Other Race
Year householder moved into unit - Moved in 1980 to 1989 (%)
Year householder moved into unit - Moved in 1980 to 1989 (%) - White
Year householder moved into unit - Moved in 1980 to 1989 (%) - Black or African American
Year householder moved into unit - Moved in 1980 to 1989 (%) - Asian
Year householder moved into unit - Moved in 1980 to 1989 (%) - Hispanic or Latino
Year householder moved into unit - Moved in 1980 to 1989 (%) - American Indian and Alaska Native
Year householder moved into unit - Moved in 1980 to 1989 (%) - Multirace
Year householder moved into unit - Moved in 1980 to 1989 (%) - Other Race
Year householder moved into unit - Moved in 1970 to 1979 (%)
Year householder moved into unit - Moved in 1970 to 1979 (%) - White
Year householder moved into unit - Moved in 1970 to 1979 (%) - Black or African American
Year householder moved into unit - Moved in 1970 to 1979 (%) - Asian
Year householder moved into unit - Moved in 1970 to 1979 (%) - Hispanic or Latino
Year householder moved into unit - Moved in 1970 to 1979 (%) - American Indian and Alaska Native
Year householder moved into unit - Moved in 1970 to 1979 (%) - Multirace
Year householder moved into unit - Moved in 1970 to 1979 (%) - Other Race
Year householder moved into unit - Moved in 1969 or earlier (%)
Year householder moved into unit - Moved in 1969 or earlier (%) - White
Year householder moved into unit - Moved in 1969 or earlier (%) - Black or African American
Year householder moved into unit - Moved in 1969 or earlier (%) - Asian
Year householder moved into unit - Moved in 1969 or earlier (%) - Hispanic or Latino
Year householder moved into unit - Moved in 1969 or earlier (%) - American Indian and Alaska Native
Year householder moved into unit - Moved in 1969 or earlier (%) - Multirace
Year householder moved into unit - Moved in 1969 or earlier (%) - Other Race
Housing units lacking complete plumbing facilities (%)
Housing units lacking complete kitchen facilities (%)
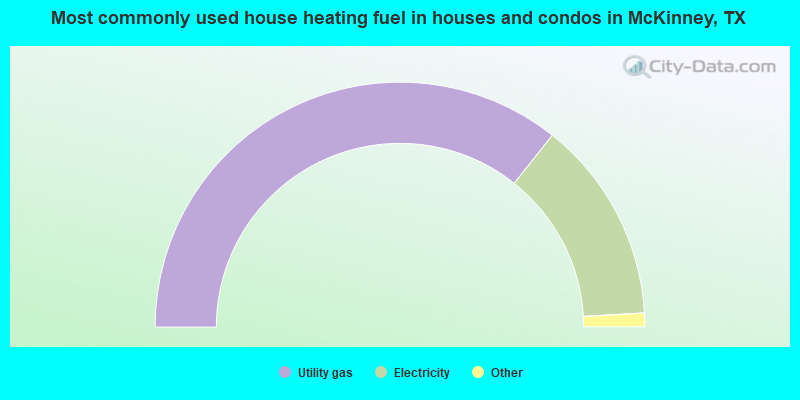
House heating fuel used in houses and condos - Utility gas (%)
House heating fuel used in houses and condos - Bottled, tank, or LP gas (%)
House heating fuel used in houses and condos - Electricity (%)
House heating fuel used in houses and condos - Fuel oil, kerosene, etc. (%)
House heating fuel used in houses and condos - Coal or coke (%)
House heating fuel used in houses and condos - Wood (%)
House heating fuel used in houses and condos - Solar energy (%)
House heating fuel used in houses and condos - Other fuel (%)
House heating fuel used in houses and condos - No fuel used (%)
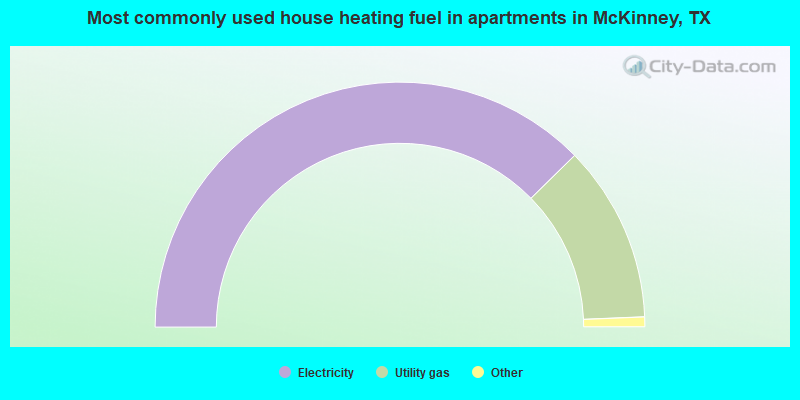
House heating fuel used in apartments - Utility gas (%)
House heating fuel used in apartments - Bottled, tank, or LP gas (%)
House heating fuel used in apartments - Electricity (%)
House heating fuel used in apartments - Fuel oil, kerosene, etc. (%)
House heating fuel used in apartments - Coal or coke (%)
House heating fuel used in apartments - Wood (%)
House heating fuel used in apartments - Solar energy (%)
House heating fuel used in apartments - Other fuel (%)
House heating fuel used in apartments - No fuel used (%)
Latest news about housing in McKinney, TX collected exclusively by city-data.com from local newspapers, TV, and radio stations
Median year house/condo built: 2007Median year apartment built: 2009Household type by relationship:
Households: 207,506
Male householders: 43,555 (7,079 living alone ), Female householders: 31,682 (9,730 living alone )43,050 spouses (42,576 opposite-sex spouses ), 4,031 unmarried partners , (3,813 opposite-sex unmarried partners ), 68,385 children (64,268 natural , 1,420 adopted , 2,697 stepchildren ), 2,369 grandchildren , 2,069 brothers or sisters , 2,620 parents , 175 foster children , 3,150 other relatives , 4,867 non-relatives In group quarters: 1,553
Size of family households: 20,914 2-persons , 13,550 3-persons , 13,318 4-persons , 3,268 5-persons , 2,673 6-persons , 687 7-or-more-persons .
Size of nonfamily households: 16,809 1-person , 3,506 2-persons , 311 3-persons , 201 5-persons .
40,385 married couples with children. single-parent households (2,531 men , 6,664 women ).
74.4% of residents of McKinney speak English at home. of residents speak Spanish at home (71% speak English very well , 14% speak English well , 12% speak English not well , 3% don't speak English at all ).of residents speak other Indo-European language at home (84% speak English very well , 12% speak English well , 4% speak English not well , 1% don't speak English at all ).of residents speak Asian or Pacific Island language at home (71% speak English very well , 21% speak English well , 6% speak English not well , 2% don't speak English at all ).of residents speak other language at home (84% speak English very well , 15% speak English well , 1% speak English not well ).
Foreign born population: 41,022 (19.8%)of them are naturalized citizens )
Median number of rooms in houses and condos:
Median number of rooms in apartments
Owner-occupied Renter-occupied
Bedrooms in owner-occupied houses and condos in McKinney, Texas
351 no bedroom 0 1 bedroom 1,399 2 bedrooms 18,423 3 bedrooms 19,537 4 bedrooms 6,817 5+ bedrooms
Bedrooms in renter-occupied apartments in McKinney, Texas
459 no bedroom 10,656 1 bedroom 8,346 2 bedrooms 6,132 3 bedrooms 2,773 4 bedrooms 344 5+ bedrooms
Owner-occupied Renter-occupied
Rooms in owner-occupied houses in McKinney, Texas
351 1 room 0 2 rooms 459 3 rooms 1,978 4 rooms 5,045 5 rooms 6,823 6 rooms 6,037 7 rooms 9,381 8 rooms 16,453 9+ rooms
Rooms in renter-occupied apartments in McKinney, Texas
133 1 room 7,368 2 rooms 7,028 3 rooms 4,330 4 rooms 2,682 5 rooms 1,615 6 rooms 1,688 7 rooms 2,950 8 rooms 916 9+ rooms
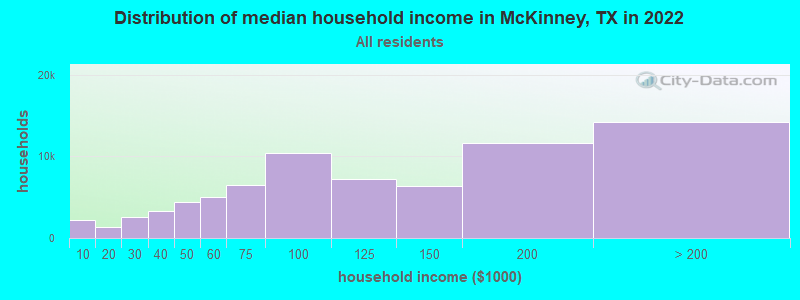
McKinney, TX household income distribution 2,232 Less than $10,0001,347 $10,000 to $19,9992,615 $20,000 to $29,9993,358 $30,000 to $39,9994,355 $40,000 to $49,9995,047 $50,000 to $59,9996,507 $60,000 to $74,99910,383 $75,000 to $99,9997,162 $100,000 to $124,9996,385 $125,000 to $149,99911,647 $150,000 to $199,99914,199 $200,000 or more
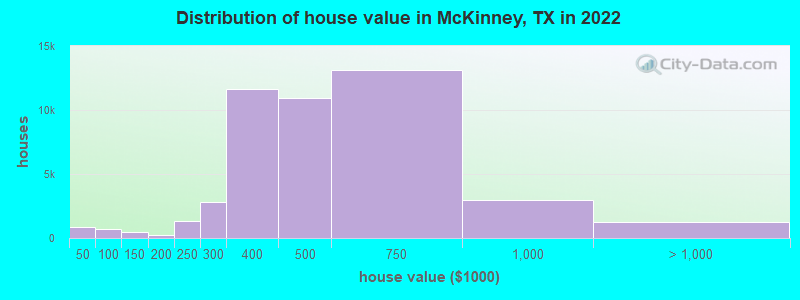
Home value of owner - occupied houses in 2022 in McKinney, TX 251 Less than $10,00070 $10,000 to $14,99951 $15,000 to $19,99948 $20,000 to $24,99926 $25,000 to $29,999105 $30,000 to $34,99930 $35,000 to $39,999304 $40,000 to $49,999136 $50,000 to $59,99931 $60,000 to $69,999175 $70,000 to $79,99945 $80,000 to $89,99923 $90,000 to $99,999272 $100,000 to $124,999188 $125,000 to $149,999166 $150,000 to $174,999100 $175,000 to $199,9991,355 $200,000 to $249,9992,845 $250,000 to $299,99911,639 $300,000 to $399,99910,954 $400,000 to $499,99913,161 $500,000 to $749,9992,983 $750,000 to $999,9991,013 $1,000,000 to $1,499,99939 $1,500,000 to $1,999,999185 $2,000,000 or moreRent paid by renters in 2022 in McKinney, TX 60 Less than $10013 $100 to $149152 $150 to $19943 $200 to $249108 $250 to $29913 $400 to $44972 $450 to $49934 $500 to $54976 $550 to $59914 $600 to $64977 $650 to $699124 $700 to $749231 $750 to $799359 $800 to $8991,263 $900 to $9993,903 $1,000 to $1,2494,077 $1,250 to $1,4998,320 $1,500 to $1,9995,085 $2,000 to $2,4991,071 $2,500 to $2,999552 $3,000 to $3,499305 $3,500 or more154 No cash rent
Percentage of workers working in this county: 77.3%Number of people working at home: 27,255 (24.5% of all workers )
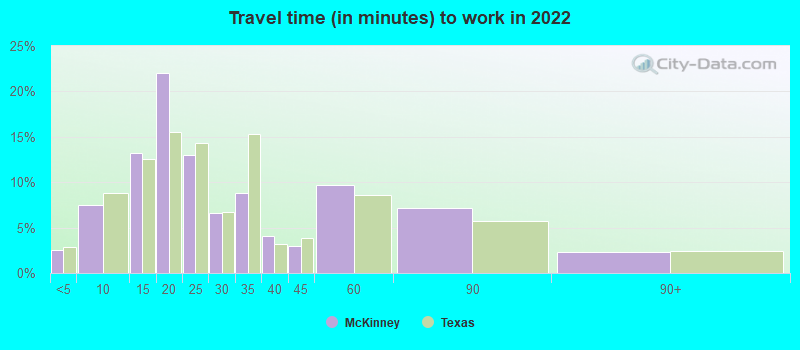
Travel time to work (commute)
Less than 5 minutes: 1,9985 to 9 minutes: 7,18610 to 14 minutes: 11,03815 to 19 minutes: 18,34720 to 24 minutes: 10,91725 to 29 minutes: 4,49030 to 34 minutes: 10,52435 to 39 minutes: 2,12140 to 44 minutes: 3,26145 to 59 minutes: 7,07560 to 89 minutes: 5,67790 or more minutes: 1,441
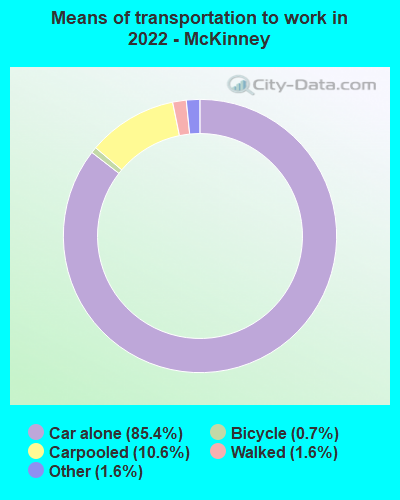
Means of transportation to work:
Drove a car alone: 57,674 (60.0%)Carpooled: 7,632 (7.9%)Bus : 15 (0.0%)Light rail, streetcar or trolley : 29 (0.0%)Ferryboat: 57 (0.1%)Taxi: 1,117 (1.2%)Bicycle: 353 (0.4%)Walked: 1,562 (1.6%)Worked at home: 27,092 (28.2%)
Unemployment by race in 2022
Unemployment rate for White non-Hispanic residents 2.1% Males2.1% FemalesUnemployment rate for Black residents 3.9% Males8.4% FemalesUnemployment rate for American Indian and Alaska Native residents 17.8% Males3.3% FemalesUnemployment rate for Asian residents 4.0% FemalesUnemployment rate for other race residents 19.7% FemalesUnemployment rate for two or more race residents 8.1% Males4.6% FemalesUnemployment rate for Hispanic or Latino residents 2.5% Males4.9% Females
Year of entry for the foreign-born population in McKinney, Texas
15,999 2010 or later 7,604 2000 to 2009 6,224 1990 to 1999 1,230 1980 to 1989 598 1970 to 1979 353 Before 1970
First ancestries reported:
American: 20,081 (16.8%)
English: 10,098 (8.4%)
German: 5,714 (4.8%)
Irish: 3,125 (2.6%)
European: 2,884 (2.4%)
Italian: 1,550 (1.3%)
Nigerian: 1,270 (1.1%)
Scottish: 793 (0.7%)
Norwegian: 775 (0.6%)
Scotch-Irish: 748 (0.6%)
African: 686 (0.6%)
Iranian: 673 (0.6%)
Canadian: 647 (0.5%)
Russian: 614 (0.5%)
French: 582 (0.5%)
Ghanaian: 548 (0.5%)
Polish: 388 (0.3%)
Dutch: 335 (0.3%)
Hungarian: 316 (0.3%)
Portuguese: 306 (0.3%)
British: 291 (0.2%)
South African: 277 (0.2%)
Ukrainian: 276 (0.2%)
Palestinian: 261 (0.2%)
Welsh: 248 (0.2%)
Kenyan: 244 (0.2%)
French Canadian: 233 (0.2%)
Swedish: 230 (0.2%)
Jordanian: 226 (0.2%)
Romanian: 222 (0.2%)
Egyptian: 220 (0.2%)
Czech: 192 (0.2%)
Greek: 189 (0.2%)
Danish: 159 (0.1%)
Serbian: 151 (0.1%)
Scandinavian: 151 (0.1%)
Slovak: 131 (0.1%)
Eastern European: 111 (0.09%)
Brazilian: 107 (0.09%)
Cajun: 103 (0.09%)
Haitian: 101 (0.08%)
Lebanese: 95 (0.08%)
Arab: 73 (0.06%)
Finnish: 69 (0.06%)
Israeli: 68 (0.06%)
Jamaican: 66 (0.06%)
Afghan: 57 (0.05%)
Guyanese: 56 (0.05%)
Croatian: 56 (0.05%)
Yugoslavian: 56 (0.05%)
Pennsylvania German: 55 (0.05%)
Barbadian: 55 (0.05%)
Northern European: 54 (0.05%)
Austrian: 49 (0.04%)
Belgian: 48 (0.04%)
Iraqi: 40 (0.03%)
Syrian: 40 (0.03%)
Moroccan: 38 (0.03%)
Zimbabwean: 38 (0.03%)
Basque: 35 (0.03%)
Lithuanian: 33 (0.03%)
West Indian: 30 (0.03%)
Latvian: 24 (0.02%)
Ethiopian: 22 (0.02%)
Czechoslovakian: 17 (0.01%)
Swiss: 15 (0.01%)
Bulgarian: 8 (0.01%)
Turkish: 8 (0.01%)
Most common places of birth for foreign-born residents (%): India McKinney:
23.4% (8,168)Texas:
6.1% (306,347)
Mexico McKinney:
20.3% (7,095)Texas:
48.4% (2,411,723)
China, excluding Hong Kong and Taiwan McKinney:
5.1% (1,793)Texas:
2.3% (115,558)
Korea McKinney:
4.2% (1,479)Texas:
1.2% (60,172)
Philippines McKinney:
3.5% (1,218)Texas:
2.1% (103,148)
Canada McKinney:
3.1% (1,065)Texas:
1.1% (55,371)
Vietnam McKinney:
2.6% (901)Texas:
3.7% (184,770)
Pakistan McKinney:
2.5% (869)Texas:
1.2% (62,159)
Venezuela McKinney:
2.3% (789)Texas:
1.5% (72,413)
Nigeria McKinney:
2.1% (722)Texas:
1.9% (96,110)
Bangladesh McKinney:
2.0% (710)Texas:
0.3% (16,549)
El Salvador McKinney:
1.7% (578)Texas:
4.5% (224,455)
Iran McKinney:
1.6% (555)Texas:
0.6% (28,963)
Place of birth for U.S.-born residents:
This state: 84,443Other state: 79,467Northeast: 8,956Midwest: 24,156South: 24,926West: 21,429 83.6% of McKinney residents lived in the same house 1 years ago.
Out of people who lived in different houses, 33.5% lived in this county.
Out of people who lived in different counties, 45.5% lived in Texas.
McKinney:
83.6%State average:
85.7%
Education attainment for males 25 years and older:
No schooling: 577Nursery to 4th grade: 05th and 6th grade: 1107th and 8th grade: 09th grade: 34710th grade: 36411th grade: 6112th grade, no diploma: 179High school graduate (or equivalency): 11,076Less than 1 year of college: 2,605Some college more than 1 year, no degree: 9,443Associate degree: 4,651Bachelor's degree: 22,084Master's degree: 12,691Professional school degree: 1,453Doctorate degree: 1,371
Education attainment for females 25 years and older:
No schooling: 591Nursery to 4th grade: 05th and 6th grade: 2977th and 8th grade: 09th grade: 28810th grade: 37611th grade: 33512th grade, no diploma: 421High school graduate (or equivalency): 9,693Less than 1 year of college: 3,893Some college more than 1 year, no degree: 9,238Associate degree: 4,927Bachelor's degree: 24,761Master's degree: 10,943Professional school degree: 764Doctorate degree: 2,036
Housing units in structures:
One, detached: 53,919One, attached: 1,775Two: 5733 or 4: 2,2045 to 9: 2,18210 to 19: 6,06820 to 49: 4,56950 or more: 7,427Mobile homes: 845Median worth of mobile homes: $32,200
Housing units lacking complete plumbing facilities in 2022: 0.2%Housing units lacking complete kitchen facilities in 2022: 2.9%House/condo owner moved in on average 6 years ago
Renter moved in on average 1 years ago
Private vs. public school enrollment:
Students in private schools in grades 1 to 8 (elementary and middle school): 2,396 Students in private schools in grades 9 to 12 (high school): 542 Students in private undergraduate colleges: 1,637