Housing density: 143 houses/condos per square mile
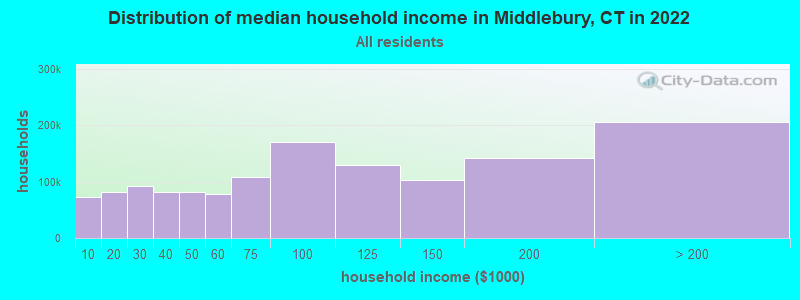
Median price asked for vacant for-sale houses and condos in 2022 in this county: $371,867.
Median contract rent in 2022: $1,118 (lower quartile is $665, upper quartile is $1,906)
Median rent asked for vacant for-rent units in 2022: $1,833
Median gross rent in Middlebury, CT in 2022: $1,334
Housing units in Middlebury with a mortgage: 1,239 (90 second mortgage, 181 home equity loan, 11 both second mortgage and home equity loan) Houses without a mortgage: 738
In family households: 686,398 (135,155 male householders, 80,594 female householders)
152,067 spouses, 248,015 children (234,078 natural, 5,289 adopted, 8,648 stepchildren), 16,153 grandchildren, 8,819 brothers or sisters, 9,694 parents, foster children, 10,947 other relatives, 19,201 non-relatives
In nonfamily households: 146,881 (52,812 male householders (40,674 living alone)), 65,941 female householders (55,844 living alone)), 28,128 nonrelatives
In group quarters: 29,198 (10,313 institutionalized population)
129,243 married couples with children.
54,016 single-parent households (8,416 men, 45,600 women).
90.6% of residents of Middlebury speak English at home.
0.8% of residents speak Spanish at home (61% speak English very well, 25% speak English well, 14% don't speak English at all).
6.1% of residents speak other Indo-European language at home (77% speak English very well, 21% speak English well, 2% speak English not well).
1.6% of residents speak Asian or Pacific Island language at home (64% speak English very well, 17% speak English well, 19% speak English not well).
0.9% of residents speak other language at home (100% speak English very well).
Foreign born population: 666 (9.3%)
(82.6% of them are naturalized citizens)
Year of entry for the foreign-born population in Middlebury, Connecticut
241995 to March 2000
261990 to 1994
471985 to 1989
541980 to 1984
621975 to 1979
561970 to 1974
531965 to 1969
103Before 1965
First ancestries reported:
Italian: 1,796 (22.5%)
Irish: 1,425 (17.9%)
English: 746 (9.3%)
Other: 634 (7.9%)
Polish: 586 (7.3%)
German: 548 (6.9%)
French: 457 (5.7%)
Lithuanian: 283 (3.5%)
Scottish: 202 (2.5%)
French Canadian: 178 (2.2%)
Swedish: 154 (1.9%)
United States: 152 (1.9%)
Arab: 121 (1.5%)
Scotch-Irish: 105 (1.3%)
Russian: 97 (1.2%)
Portuguese: 90 (1.1%)
Slovak: 82 (1.0%)
Dutch: 69 (0.9%)
Norwegian: 47 (0.6%)
Hungarian: 39 (0.5%)
Danish: 35 (0.4%)
Ukrainian: 35 (0.4%)
Welsh: 29 (0.4%)
Greek: 24 (0.3%)
Czech: 21 (0.3%)
Subsaharan African: 14 (0.2%)
Swiss: 7 (0.09%)
West Indian: 6 (0.08%)
Most common places of birth for foreign-born residents (%):
Portugal
Middlebury:
13.2% (56)
Connecticut:
3.6% (13,234)
Other Eastern Europe
Middlebury:
12.2% (52)
Connecticut:
2.1% (7,596)
Italy
Middlebury:
12.0% (51)
Connecticut:
7.0% (26,023)
Canada
Middlebury:
10.4% (44)
Connecticut:
5.2% (19,083)
Germany
Middlebury:
8.2% (35)
Connecticut:
3.1% (11,432)
Cambodia
Middlebury:
6.1% (26)
Connecticut:
0.5% (1,723)
China, excluding Hong Kong and Taiwan
Middlebury:
5.2% (22)
Connecticut:
2.5% (9,358)
Philippines
Middlebury:
4.5% (19)
Connecticut:
1.7% (6,247)
Greece
Middlebury:
3.8% (16)
Connecticut:
1.2% (4,622)
Poland
Middlebury:
3.1% (13)
Connecticut:
6.9% (25,507)
Lebanon
Middlebury:
2.6% (11)
Connecticut:
0.3% (1,286)
Czechoslovakia (includes Czech Republic and Slovakia)
Middlebury:
2.4% (10)
Connecticut:
0.5% (1,693)
Russia
Middlebury:
2.4% (10)
Connecticut:
1.4% (5,021)
Turkey
Middlebury:
2.1% (9)
Connecticut:
0.4% (1,483)
Jordan
Middlebury:
1.9% (8)
Connecticut:
0.1% (209)
Japan
Middlebury:
1.6% (7)
Connecticut:
0.9% (3,472)
Australia
Middlebury:
1.6% (7)
Connecticut:
0.3% (1,032)
Jamaica
Middlebury:
1.6% (7)
Connecticut:
7.2% (26,819)
Place of birth for U.S.-born residents:
This state: 4,709
Other state: 1,342
Northeast: 873
Midwest: 86
South: 235
West: 148
67% of Middlebury residents lived in the same house 5 years ago. Out of people who lived in different houses, 65% lived in this county. Out of people who lived in different counties, 68% lived in Connecticut.
Education attainment for males 25 years and older:
No schooling: 6
Nursery to 4th grade: 0
5th and 6th grade: 0
7th and 8th grade: 32
9th grade: 6
10th grade: 7
11th grade: 35
12th grade, no diploma: 45
High school graduate (or equivalency): 461
Less than 1 year of college: 106
Some college more than 1 year, no degree: 289
Associate degree: 176
Bachelor's degree: 535
Master's degree: 278
Professional school degree: 178
Doctorate degree: 20
Education attainment for females 25 years and older: