Housing density: 1,924 houses/condos per square mile
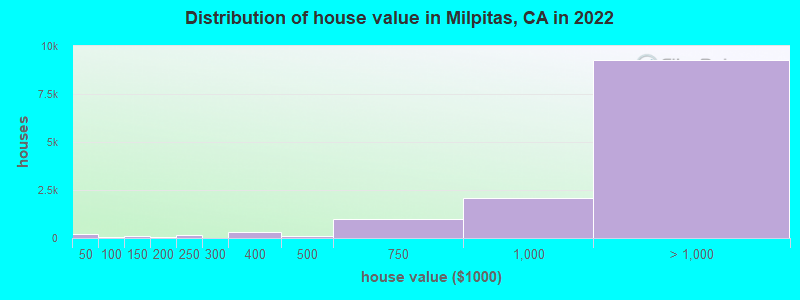
Median price asked for vacant for-sale houses and condos in 2022: $1,110,883.
Median contract rent in 2022: over $2,000 (lower quartile is over $2,000, upper quartile is over $2,000)
Median rent asked for vacant for-rent units in 2022: $3,762
Median gross rent in Milpitas, CA in 2022: over $2,000
Housing units in Milpitas with a mortgage: 8,118 (625 second mortgage, 0 home equity loan, 381 both second mortgage and home equity loan) Houses without a mortgage: 67
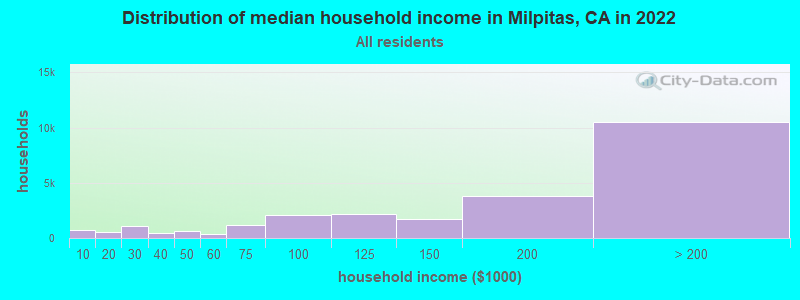
Median household income for houses/condos with a mortgage: $250,001
Median household income for apartments without a mortgage: $105,686
11,882 married couples with children.
1,189 single-parent households (244 men, 945 women).
30.9% of residents of Milpitas speak English at home.
8.9% of residents speak Spanish at home (72% speak English very well, 14% speak English well, 12% speak English not well, 2% don't speak English at all).
13.9% of residents speak other Indo-European language at home (81% speak English very well, 14% speak English well, 4% speak English not well, 1% don't speak English at all).
45.2% of residents speak Asian or Pacific Island language at home (58% speak English very well, 24% speak English well, 14% speak English not well, 4% don't speak English at all).
1.4% of residents speak other language at home (84% speak English very well, 15% speak English well, 2% speak English not well).
Foreign born population: 44,993 (57.9%)
(55.5% of them are naturalized citizens)
Percentage of workers working in this county: 82.3% Number of people working at home: 10,568 (26.2% of all workers)
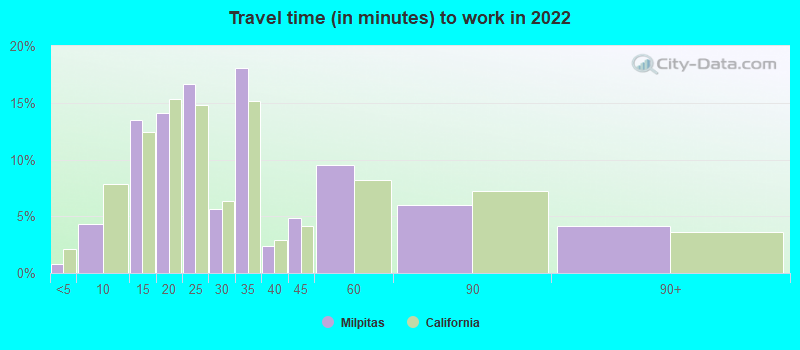
Travel time to work (commute)
Less than 5 minutes: 158
5 to 9 minutes: 1,922
10 to 14 minutes: 4,420
15 to 19 minutes: 4,349
20 to 24 minutes: 4,382
25 to 29 minutes: 2,639
30 to 34 minutes: 4,412
35 to 39 minutes: 590
40 to 44 minutes: 321
45 to 59 minutes: 1,997
60 to 89 minutes: 812
90 or more minutes: 161
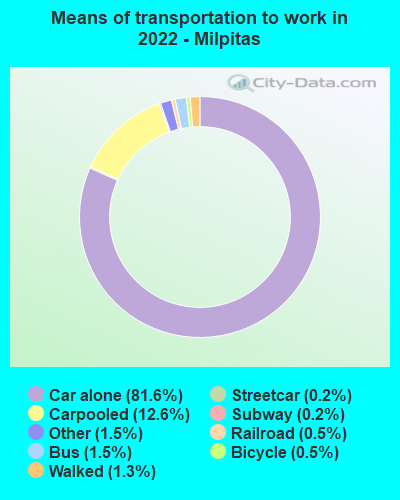
Means of transportation to work:
Drove a car alone: 29,229 (63.3%)
Carpooled: 4,629 (10.0%)
Bus: 385 (0.8%)
Subway or elevated rail: 45 (0.1%)
Long-distance train or commuter rail: 69 (0.1%)
Light rail, streetcar or trolley: 130 (0.3%)
Taxi: 615 (1.3%)
Bicycle: 212 (0.5%)
Walked: 460 (1.0%)
Worked at home: 10,568 (22.9%)
Unemployment by race in 2022
Unemployment rate for White non-Hispanic residents
6.0%Males
4.9%Females
Unemployment rate for Black residents
1.2%Males
4.0%Females
Unemployment rate for American Indian and Alaska Native residents
41.4%Males
21.7%Females
Unemployment rate for Asian residents
2.8%Males
3.4%Females
Unemployment rate for other race residents
3.1%Males
1.2%Females
Unemployment rate for two or more race residents
2.3%Males
6.0%Females
Unemployment rate for Hispanic or Latino residents
2.9%Males
9.3%Females
Year of entry for the foreign-born population in Milpitas, California
17,5522010 or later
8,8152000 to 2009
6,9511990 to 1999
10,1861980 to 1989
5,1381970 to 1979
1,642Before 1970
First ancestries reported:
English: 446 (0.8%)
German: 403 (0.7%)
Irish: 338 (0.6%)
European: 276 (0.5%)
American: 263 (0.5%)
Greek: 252 (0.5%)
Iraqi: 224 (0.4%)
Italian: 214 (0.4%)
Afghan: 189 (0.3%)
Portuguese: 140 (0.3%)
Polish: 137 (0.3%)
Iranian: 105 (0.2%)
Brazilian: 93 (0.2%)
Trinidadian and Tobagonian: 88 (0.2%)
French: 77 (0.1%)
Dutch: 73 (0.1%)
Ukrainian: 71 (0.1%)
Armenian: 60 (0.1%)
Assyrian: 56 (0.1%)
Swedish: 47 (0.09%)
Russian: 40 (0.07%)
French Canadian: 38 (0.07%)
British: 32 (0.06%)
Scottish: 31 (0.06%)
Ethiopian: 31 (0.06%)
Israeli: 30 (0.05%)
Celtic: 24 (0.04%)
Romanian: 19 (0.03%)
Macedonian: 13 (0.02%)
Somali: 11 (0.02%)
Scandinavian: 11 (0.02%)
Canadian: 11 (0.02%)
Lithuanian: 10 (0.02%)
Slovene: 9 (0.02%)
Eastern European: 8 (0.01%)
African: 8 (0.01%)
Norwegian: 7 (0.01%)
Lebanese: 7 (0.01%)
Estonian: 7 (0.01%)
Serbian: 6 (0.01%)
Palestinian: 5 (0.01%)
Nigerian: 5 (0.01%)
Moroccan: 5 (0.01%)
Scotch-Irish: 4 (0.01%)
Northern European: 3 (0.01%)
Most common places of birth for foreign-born residents (%):
India
Milpitas:
34.4% (14,619)
California:
5.2% (539,184)
Vietnam
Milpitas:
15.8% (6,738)
California:
4.9% (512,335)
Philippines
Milpitas:
14.5% (6,183)
California:
7.8% (818,297)
China, excluding Hong Kong and Taiwan
Milpitas:
10.4% (4,415)
California:
6.6% (684,672)
Mexico
Milpitas:
5.4% (2,318)
California:
37.2% (3,881,193)
Taiwan
Milpitas:
3.7% (1,572)
California:
1.7% (176,274)
Hong Kong
Milpitas:
2.2% (929)
California:
1.0% (105,215)
Korea
Milpitas:
1.6% (664)
California:
3.0% (315,248)
Place of birth for U.S.-born residents:
This state: 27,281
Other state: 4,499
Northeast: 811
Midwest: 1,400
South: 1,312
West: 976
81.8% of Milpitas residents lived in the same house 1 years ago. Out of people who lived in different houses, 40.9% lived in this county. Out of people who lived in different counties, 65.1% lived in California.
Milpitas:
81.8%
State average:
88.9%
Education attainment for males 25 years and older:
No schooling: 753
Nursery to 4th grade: 0
5th and 6th grade: 0
7th and 8th grade: 0
9th grade: 385
10th grade: 273
11th grade: 133
12th grade, no diploma: 429
High school graduate (or equivalency): 3,160
Less than 1 year of college: 821
Some college more than 1 year, no degree: 1,974
Associate degree: 1,830
Bachelor's degree: 8,984
Master's degree: 9,239
Professional school degree: 581
Doctorate degree: 879
Education attainment for females 25 years and older:
No schooling: 1,196
Nursery to 4th grade: 289
5th and 6th grade: 211
7th and 8th grade: 270
9th grade: 140
10th grade: 530
11th grade: 184
12th grade, no diploma: 854
High school graduate (or equivalency): 3,790
Less than 1 year of college: 586
Some college more than 1 year, no degree: 2,333
Associate degree: 1,878
Bachelor's degree: 8,562
Master's degree: 4,992
Professional school degree: 615
Doctorate degree: 553
Housing units in structures:
One, detached: 11,907
One, attached: 4,852
Two: 101
3 or 4: 1,702
5 to 9: 773
10 to 19: 402
20 to 49: 258
50 or more: 5,927
Mobile homes: 174
Housing units lacking complete kitchen facilities in 2022: 2.0%
House/condo owner moved in on average 14 years ago