Moline, IL (Illinois) Houses and Residents
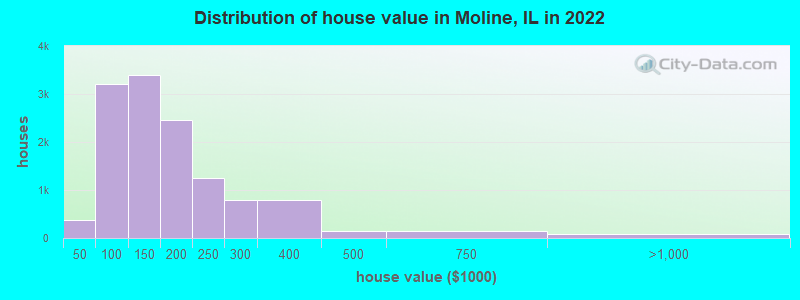
Estimated median house or condo value in 2022: $139,687 (it was $79,300 in 2000 )
Moline:
$139,687Illinois:
$251,600
Lower value quartile - upper value quartile: $94,068 - $202,996Mean price in 2022: Detached houses: $165,646 Here:
$165,646State:
$310,164
Townhouses or other attached units: $213,541 Here:
$213,541State:
$286,230
In 2-unit structures: $113,068 Here:
$113,068State:
$299,638
In 3-to-4-unit structures: $137,534 Here:
$137,534State:
$330,907
In 5-or-more-unit structures: $131,124 Here:
$131,124State:
$318,887
Mobile homes: $36,361 Here:
$36,361State:
$78,855
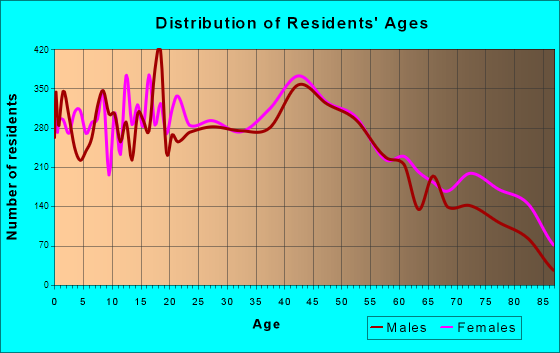
Total population: 42,685 (All urban)
Houses: 19,801 (18,273 occupied: 12,389 owner occupied, 6,283 renter occupied )
% of renters here:
34%State:
33%
Housing density: 1,269 houses/condos per square mile
Median price asked for vacant for-sale houses and condos in 2022: $110,744.
Median contract rent in 2022: $701 (lower quartile is $526, upper quartile is $850)
Median rent asked for vacant for-rent units in 2022: $918
Median gross rent in Moline, IL in 2022: $829
Housing units in Moline with a mortgage: 7,652 (501 second mortgage, 0 home equity loan, 370 both second mortgage and home equity loan )Houses without a mortgage: 264
Median household income for houses/condos with a mortgage: $88,587
Median household income for apartments without a mortgage: $67,776
Median monthly housing costs: $916
Data:
Median house or condo value ($)
Median house or condo value ($ change since 2000)
Median house or condo value ($) - White
Median house or condo value ($) - Black or African American
Median house or condo value ($) - Asian
Median house or condo value ($) - Hispanic or Latino
Median house or condo value ($) - American Indian and Alaska Native
Median house or condo value ($) - Multirace
Median house or condo value ($) - Other Race
Median price asked for mobile homes ($)
Household density (households per square mile)
Mean house or condo value by units in structure - 1, detached ($)
Mean house or condo value by units in structure - 1, attached ($)
Mean house or condo value by units in structure - 2 ($)
Mean house or condo value by units in structure by units in structure - 3 or 4 ($)
Mean house or condo value by units in structure - 5 or more ($)
Mean house or condo value by units in structure - Boat, RV, van, etc. ($)
Mean house or condo value by units in structure - Mobile home ($)
Median contract rent ($)
Median contract rent - Lower quartile ($)
Median contract rent - Upper quartile ($)
Median gross rent ($)
Urban houses (%)
Rural houses (%)
Houses occupied (%)
Houses occupied (% change since 2000)
Houses owner occupied (%)
Houses owner occupied (% change since 2000)
Houses renter occupied (%)
Houses renter occupied (% change since 2000)
Vacant housing units - For rent (%)
Vacant housing units - For rent (% change since 2000)
Vacant housing units - For sale only (%)
Vacant housing units - For sale only (% change since 2000)
Vacant housing units - Rented or sold, not occupied (%)
Vacant housing units - Rented or sold, not occupied (% change since 2000)
Vacant housing units - For seasonal, recreational, or occasional use (%)
Vacant housing units - For seasonal, recreational, or occasional use (% change since 2000)
Vacant housing units - For migrant workers (%)
Vacant housing units - For migrant workers (% change since 2000)
Vacant housing units - Other vacant (%)
Vacant housing units - Other vacant (% change since 2000)
Median monthly housing costs ($)
Median household income for houses/condos with a mortgage ($)
Median household income for houses/condos without a mortgage ($)
Median household income ($)
Median household income ($) - White
Median household income ($) - Black or African American
Median household income ($) - Asian
Median household income ($) - Hispanic or Latino
Median household income ($) - American Indian and Alaska Native
Median household income ($) - Multirace
Median household income ($) - Other Race
Mortgage status - with mortgage (%)
Mortgage status - with second mortgage (%)
Mortgage status - with home equity loan (%)
Mortgage status - with both second mortgage and home equity loan (%)
Mortgage status - without a mortgage (%)
Median year house/condo built
Median year apartment built
Household type by relationship - Male householder living alone (%)
Household type by relationship - Male householder not living alone (%)
Household type by relationship - Female householder living alone (%)
Household type by relationship - Female householder not living alone (%)
Household type by relationship - Opposite-Sex spouse (%)
Household type by relationship - Same-Sex spouse (%)
Household type by relationship - Opposite-Sex unmarried partner (%)
Household type by relationship - Same-Sex unmarried partner (%)
Household type by relationship - In group quarters (%)
Size of family households - 2-person household (%)
Size of family households - 3-person household (%)
Size of family households - 4-person household (%)
Size of family households - 5-person household (%)
Size of family households - 6-person household (%)
Size of family households - 7-or-more-person household (%)
Size of nonfamily households - 1-person household (%)
Size of nonfamily households - 2-person household (%)
Size of nonfamily households - 3-person household (%)
Size of nonfamily households - 4-person household (%)
Size of nonfamily households - 5-person household (%)
Size of nonfamily households - 6-person household (%)
Size of nonfamily households - 7-or-moreperson household (%)
Year house built - Built 2010 or later (%)
Year house built - Built 2000 to 2009 (%)
Year house built - Built 1990 to 1999 (%)
Year house built - Built 1980 to 1989 (%)
Year house built - Built 1970 to 1979 (%)
Year house built - Built 1960 to 1969 (%)
Year house built - Built 1950 to 1959 (%)
Year house built - Built 1940 to 1949 (%)
Year house built - Built 1939 or earlier (%)
Median number of rooms in houses and condos
Median number of rooms in apartments
Median number of bedrooms in owner occupied houses
Mean number of bedrooms in owner occupied houses
Median number of bedrooms in renter occupied houses
Mean number of bedrooms in renter occupied houses
Median number of vehichles in owner occupied houses
Mean number of vehichles in owner occupied houses
Median number of vehichles in renter occupied houses
Mean number of vehichles in renter occupied houses
Rooms in owner-occupied houses - 1 room (%)
Rooms in owner-occupied houses - 2 rooms (%)
Rooms in owner-occupied houses - 3 rooms (%)
Rooms in owner-occupied houses - 4 rooms (%)
Rooms in owner-occupied houses - 5 rooms (%)
Rooms in owner-occupied houses - 6 rooms (%)
Rooms in owner-occupied houses - 7 rooms (%)
Rooms in owner-occupied houses - 8 rooms (%)
Rooms in owner-occupied houses - 9+ rooms (%)
Rooms in renter-occupied houses - 1 room (%)
Rooms in renter-occupied houses - 2 rooms (%)
Rooms in renter-occupied houses - 3 rooms (%)
Rooms in renter-occupied houses - 4 rooms (%)
Rooms in renter-occupied houses - 5 rooms (%)
Rooms in renter-occupied houses - 6 rooms (%)
Rooms in renter-occupied houses - 7 rooms (%)
Rooms in renter-occupied houses - 8 rooms (%)
Rooms in renter-occupied houses - 9+ rooms (%)
Bedrooms in owner-occupied houses - no bedrooms (%)
Bedrooms in owner-occupied houses - 1 bedroom (%)
Bedrooms in owner-occupied houses - 2 bedrooms (%)
Bedrooms in owner-occupied houses - 3 bedrooms (%)
Bedrooms in owner-occupied houses - 4 bedrooms (%)
Bedrooms in owner-occupied houses - 5+ bedrooms (%)
Bedrooms in renter-occupied houses - no bedrooms (%)
Bedrooms in renter-occupied houses - 1 bedroom (%)
Bedrooms in renter-occupied houses - 2 bedrooms (%)
Bedrooms in renter-occupied houses - 3 bedrooms (%)
Bedrooms in renter-occupied houses - 4 bedrooms (%)
Bedrooms in renter-occupied houses - 5+ bedrooms (%)
Vehicles available in owner-occupied houses - no vehicle available (%)
Vehicles available in owner-occupied houses - 1 vehicle available(%)
Vehicles available in owner-occupied houses - 2 Vehicles available (%)
Vehicles available in owner-occupied houses - 3 Vehicles available (%)
Vehicles available in owner-occupied houses - 4 Vehicles available (%)
Vehicles available in owner-occupied houses - 5+ Vehicles available (%)
Vehicles available in renter-occupied houses - no vehicle available (%)
Vehicles available in renter-occupied houses - 1 vehicle available (%)
Vehicles available in renter-occupied houses - 2 Vehicles available (%)
Vehicles available in renter-occupied houses - 3 Vehicles available (%)
Vehicles available in renter-occupied houses - 4 Vehicles available (%)
Vehicles available in renter-occupied houses - 5+ Vehicles available (%)
Housing units in structures - 1, detached (%)
Housing units in structures - 1, attached (%)
Housing units in structures - 2 (%)
Housing units in structures - 3 or 4 (%)
Housing units in structures - 5 to 9 (%)
Housing units in structures - 10 to 19 (%)
Housing units in structures - 20 to 49 (%)
Housing units in structures - 50 or more (%)
Housing units in structures - Mobile home (%)
Housing units in structures - Boat, RV, van, etc. (%)
Housing units in structures - Owners - 1, detached (%)
Housing units in structures - Owners - 1, attached (%)
Housing units in structures - Owners - 2 (%)
Housing units in structures - Owners - 3 or 4 (%)
Housing units in structures - Owners - 5 to 9 (%)
Housing units in structures - Owners - 10 to 19 (%)
Housing units in structures - Owners - 20 to 49 (%)
Housing units in structures - Owners - 50 or more (%)
Housing units in structures - Owners - Mobile home (%)
Housing units in structures - Owners - Boat, RV, van, etc. (%)
Housing units in structures - Renters - 1, detached (%)
Housing units in structures - Renters - 1, attached (%)
Housing units in structures - Renters - 2 (%)
Housing units in structures - Renters - 3 or 4 (%)
Housing units in structures - Renters - 5 to 9 (%)
Housing units in structures - Renters - 10 to 19 (%)
Housing units in structures - Renters - 20 to 49 (%)
Housing units in structures - Renters - 50 or more (%)
Housing units in structures - Renters - Mobile home (%)
Housing units in structures - Renters - Boat, RV, van, etc. (%)
House/condo owner moved in on average (years ago)
Renter moved in on average (years ago)
Year householder moved into unit - Moved in 1999 to March 2000 (%)
Year householder moved into unit - Moved in 1999 to March 2000 (%) - White
Year householder moved into unit - Moved in 1999 to March 2000 (%) - Black or African American
Year householder moved into unit - Moved in 1999 to March 2000 (%) - Asian
Year householder moved into unit - Moved in 1999 to March 2000 (%) - Hispanic or Latino
Year householder moved into unit - Moved in 1999 to March 2000 (%) - American Indian and Alaska Native
Year householder moved into unit - Moved in 1999 to March 2000 (%) - Multirace
Year householder moved into unit - Moved in 1999 to March 2000 (%) - Other Race
Year householder moved into unit - Moved in 1995 to 1998 (%)
Year householder moved into unit - Moved in 1995 to 1998 (%) - White
Year householder moved into unit - Moved in 1995 to 1998 (%) - Black or African American
Year householder moved into unit - Moved in 1995 to 1998 (%) - Asian
Year householder moved into unit - Moved in 1995 to 1998 (%) - Hispanic or Latino
Year householder moved into unit - Moved in 1995 to 1998 (%) - American Indian and Alaska Native
Year householder moved into unit - Moved in 1995 to 1998 (%) - Multirace
Year householder moved into unit - Moved in 1995 to 1998 (%) - Other Race
Year householder moved into unit - Moved in 1990 to 1994 (%)
Year householder moved into unit - Moved in 1990 to 1994 (%) - White
Year householder moved into unit - Moved in 1990 to 1994 (%) - Black or African American
Year householder moved into unit - Moved in 1990 to 1994 (%) - Asian
Year householder moved into unit - Moved in 1990 to 1994 (%) - Hispanic or Latino
Year householder moved into unit - Moved in 1990 to 1994 (%) - American Indian and Alaska Native
Year householder moved into unit - Moved in 1990 to 1994 (%) - Multirace
Year householder moved into unit - Moved in 1990 to 1994 (%) - Other Race
Year householder moved into unit - Moved in 1980 to 1989 (%)
Year householder moved into unit - Moved in 1980 to 1989 (%) - White
Year householder moved into unit - Moved in 1980 to 1989 (%) - Black or African American
Year householder moved into unit - Moved in 1980 to 1989 (%) - Asian
Year householder moved into unit - Moved in 1980 to 1989 (%) - Hispanic or Latino
Year householder moved into unit - Moved in 1980 to 1989 (%) - American Indian and Alaska Native
Year householder moved into unit - Moved in 1980 to 1989 (%) - Multirace
Year householder moved into unit - Moved in 1980 to 1989 (%) - Other Race
Year householder moved into unit - Moved in 1970 to 1979 (%)
Year householder moved into unit - Moved in 1970 to 1979 (%) - White
Year householder moved into unit - Moved in 1970 to 1979 (%) - Black or African American
Year householder moved into unit - Moved in 1970 to 1979 (%) - Asian
Year householder moved into unit - Moved in 1970 to 1979 (%) - Hispanic or Latino
Year householder moved into unit - Moved in 1970 to 1979 (%) - American Indian and Alaska Native
Year householder moved into unit - Moved in 1970 to 1979 (%) - Multirace
Year householder moved into unit - Moved in 1970 to 1979 (%) - Other Race
Year householder moved into unit - Moved in 1969 or earlier (%)
Year householder moved into unit - Moved in 1969 or earlier (%) - White
Year householder moved into unit - Moved in 1969 or earlier (%) - Black or African American
Year householder moved into unit - Moved in 1969 or earlier (%) - Asian
Year householder moved into unit - Moved in 1969 or earlier (%) - Hispanic or Latino
Year householder moved into unit - Moved in 1969 or earlier (%) - American Indian and Alaska Native
Year householder moved into unit - Moved in 1969 or earlier (%) - Multirace
Year householder moved into unit - Moved in 1969 or earlier (%) - Other Race
Housing units lacking complete plumbing facilities (%)
Housing units lacking complete kitchen facilities (%)
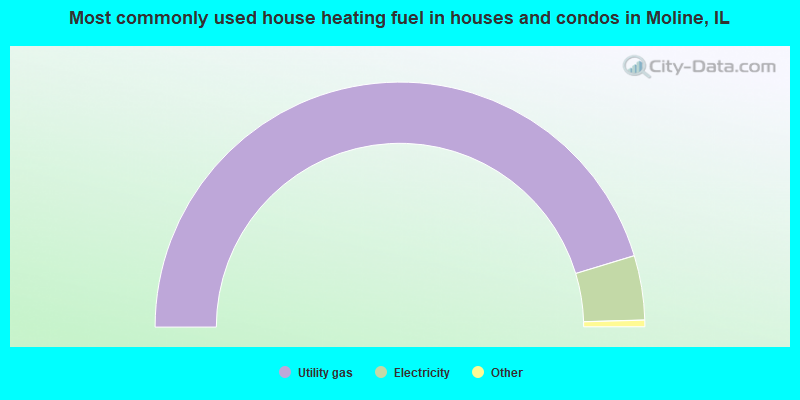
House heating fuel used in houses and condos - Utility gas (%)
House heating fuel used in houses and condos - Bottled, tank, or LP gas (%)
House heating fuel used in houses and condos - Electricity (%)
House heating fuel used in houses and condos - Fuel oil, kerosene, etc. (%)
House heating fuel used in houses and condos - Coal or coke (%)
House heating fuel used in houses and condos - Wood (%)
House heating fuel used in houses and condos - Solar energy (%)
House heating fuel used in houses and condos - Other fuel (%)
House heating fuel used in houses and condos - No fuel used (%)
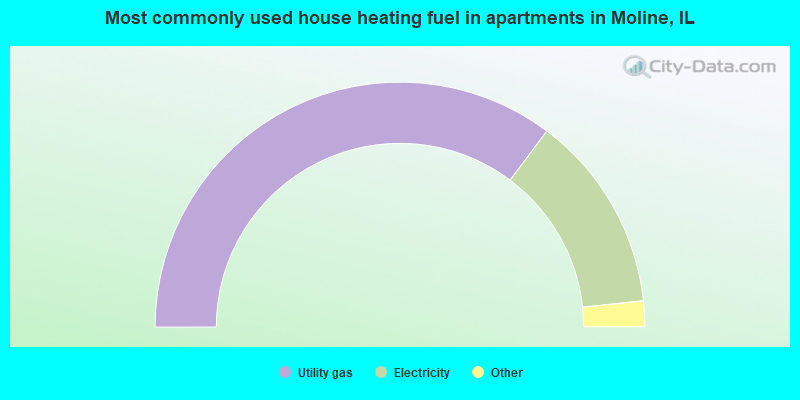
House heating fuel used in apartments - Utility gas (%)
House heating fuel used in apartments - Bottled, tank, or LP gas (%)
House heating fuel used in apartments - Electricity (%)
House heating fuel used in apartments - Fuel oil, kerosene, etc. (%)
House heating fuel used in apartments - Coal or coke (%)
House heating fuel used in apartments - Wood (%)
House heating fuel used in apartments - Solar energy (%)
House heating fuel used in apartments - Other fuel (%)
House heating fuel used in apartments - No fuel used (%)
Latest news about housing in Moline, IL collected exclusively by city-data.com from local newspapers, TV, and radio stations
Median year house/condo built: 1953Median year apartment built: 1963Household type by relationship:
Households: 41,775
Male householders: 8,821 (2,780 living alone ), Female householders: 9,154 (3,239 living alone )7,780 spouses (7,718 opposite-sex spouses ), 1,062 unmarried partners , (1,022 opposite-sex unmarried partners ), 11,414 children (10,602 natural , 265 adopted , 546 stepchildren ), 948 grandchildren , 425 brothers or sisters , 426 parents , 44 foster children , 383 other relatives , 986 non-relatives In group quarters: 327
Size of family households: 6,055 2-persons , 2,287 3-persons , 2,318 4-persons , 664 5-persons , 341 6-persons , 93 7-or-more-persons .
Size of nonfamily households: 5,993 1-person , 725 2-persons , 85 3-persons , 59 4-persons , 7 6-persons .
4,700 married couples with children. single-parent households (1,381 men , 3,101 women ).
83.9% of residents of Moline speak English at home. of residents speak Spanish at home (60% speak English very well , 24% speak English well , 10% speak English not well , 6% don't speak English at all ).of residents speak other Indo-European language at home (56% speak English very well , 41% speak English well , 3% speak English not well ).of residents speak Asian or Pacific Island language at home (58% speak English very well , 27% speak English well , 12% speak English not well , 3% don't speak English at all ).of residents speak other language at home (60% speak English very well , 20% speak English well , 13% speak English not well , 6% don't speak English at all ).
Foreign born population: 2,897 (6.9%)of them are naturalized citizens )
Median number of rooms in houses and condos:
Median number of rooms in apartments
Owner-occupied Renter-occupied
Rooms in owner-occupied houses in Moline, Illinois
55 1 room 25 2 rooms 179 3 rooms 1,147 4 rooms 2,194 5 rooms 2,990 6 rooms 2,161 7 rooms 1,330 8 rooms 2,309 9+ rooms
Rooms in renter-occupied apartments in Moline, Illinois
419 1 room 363 2 rooms 1,177 3 rooms 1,848 4 rooms 1,258 5 rooms 639 6 rooms 320 7 rooms 141 8 rooms 119 9+ rooms
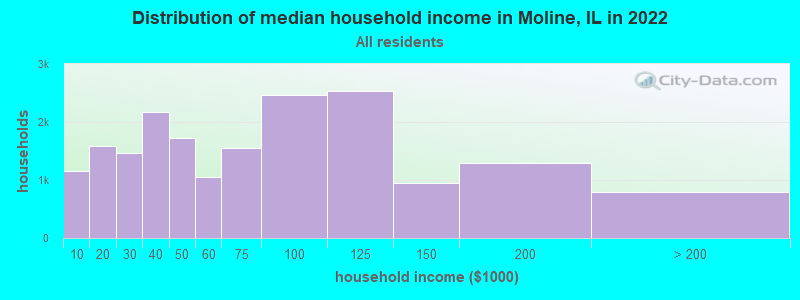
Moline, IL household income distribution 1,149 Less than $10,0001,581 $10,000 to $19,9991,463 $20,000 to $29,9992,177 $30,000 to $39,9991,725 $40,000 to $49,9991,051 $50,000 to $59,9991,551 $60,000 to $74,9992,460 $75,000 to $99,9992,534 $100,000 to $124,999946 $125,000 to $149,9991,289 $150,000 to $199,999798 $200,000 or more
Home value of owner - occupied houses in 2022 in Moline, IL 133 Less than $10,00077 $10,000 to $14,99932 $15,000 to $19,99925 $20,000 to $24,99910 $25,000 to $29,99987 $40,000 to $49,999161 $50,000 to $59,999418 $60,000 to $69,999765 $70,000 to $79,999854 $80,000 to $89,999916 $90,000 to $99,9991,767 $100,000 to $124,9991,634 $125,000 to $149,9991,713 $150,000 to $174,999737 $175,000 to $199,9991,257 $200,000 to $249,999790 $250,000 to $299,999791 $300,000 to $399,999153 $400,000 to $499,999149 $500,000 to $749,99958 $750,000 to $999,99920 $1,000,000 to $1,499,999Rent paid by renters in 2022 in Moline, IL 97 Less than $10015 $100 to $14913 $150 to $199157 $200 to $24987 $250 to $29942 $300 to $349122 $350 to $39962 $400 to $449342 $450 to $499208 $500 to $549374 $550 to $599686 $600 to $649393 $650 to $699722 $700 to $749277 $750 to $799550 $800 to $899220 $900 to $999377 $1,000 to $1,249286 $1,250 to $1,499182 $1,500 to $1,99952 $2,000 to $2,49915 $3,000 to $3,49982 $3,500 or more376 No cash rent
Percentage of workers working in this county: 72.8%Number of people working at home: 2,220 (10.7% of all workers )
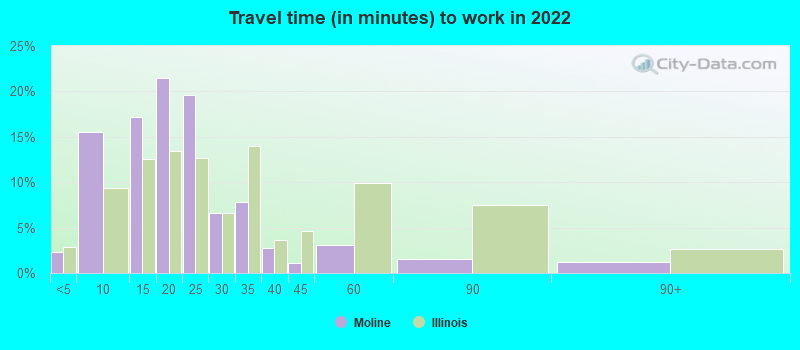
Travel time to work (commute)
Less than 5 minutes: 3905 to 9 minutes: 3,20210 to 14 minutes: 4,31515 to 19 minutes: 5,26420 to 24 minutes: 2,39425 to 29 minutes: 1,11730 to 34 minutes: 88635 to 39 minutes: 13340 to 44 minutes: 35645 to 59 minutes: 42960 to 89 minutes: 13790 or more minutes: 297
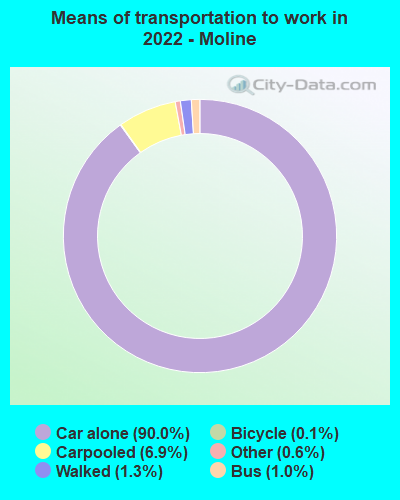
Means of transportation to work:
Drove a car alone: 19,008 (82.8%)Carpooled: 1,255 (5.5%)Bus : 177 (0.8%)Taxi: 265 (1.2%)Bicycle: 23 (0.1%)Walked: 216 (0.9%)Worked at home: 2,220 (9.7%)
Unemployment by race in 2022
Unemployment rate for White non-Hispanic residents 2.4% Males3.3% FemalesUnemployment rate for Black residents 24.2% Males32.2% FemalesUnemployment rate for Asian residents 3.4% MalesUnemployment rate for two or more race residents 8.5% Males1.9% FemalesUnemployment rate for Hispanic or Latino residents 3.0% Males2.6% Females
Year of entry for the foreign-born population in Moline, Illinois
1,424 2010 or later 1,060 2000 to 2009 690 1990 to 1999 636 1980 to 1989 446 1970 to 1979 438 Before 1970
First ancestries reported:
German: 2,117 (12.7%)
English: 1,287 (7.7%)
Irish: 1,005 (6.0%)
American: 971 (5.8%)
Swedish: 722 (4.3%)
European: 495 (3.0%)
Belgian: 376 (2.2%)
African: 290 (1.7%)
Italian: 215 (1.3%)
French: 161 (1.0%)
Polish: 140 (0.8%)
Norwegian: 139 (0.8%)
Scandinavian: 129 (0.8%)
Dutch: 126 (0.8%)
Scottish: 95 (0.6%)
Scotch-Irish: 93 (0.6%)
Northern European: 68 (0.4%)
Czech: 60 (0.4%)
Eastern European: 58 (0.3%)
Moroccan: 50 (0.3%)
Greek: 44 (0.3%)
British: 39 (0.2%)
Welsh: 34 (0.2%)
Lebanese: 33 (0.2%)
Finnish: 24 (0.1%)
Russian: 19 (0.1%)
Croatian: 15 (0.09%)
Hungarian: 14 (0.08%)
Belizean: 13 (0.08%)
Danish: 7 (0.04%)
Ukrainian: 7 (0.04%)
Brazilian: 6 (0.04%)
Turkish: 4 (0.02%)
Romanian: 2 (0.01%) Most common places of birth for foreign-born residents (%): Mexico Moline:
52.5% (1,983)Illinois:
34.7% (626,958)
India Moline:
7.9% (300)Illinois:
9.2% (166,409)
Africa, n.e.c. Moline:
7.0% (264)Illinois:
0.3% (5,397)
Philippines Moline:
5.6% (210)Illinois:
5.2% (93,003)
Venezuela Moline:
1.6% (60)Illinois:
0.5% (9,688)
Togo Moline:
1.6% (59)Illinois:
0.1% (1,861)
Burma (Myanmar) Moline:
1.5% (57)Illinois:
0.3% (4,552)
Place of birth for U.S.-born residents:
This state: 27,417Other state: 10,828Northeast: 805Midwest: 6,981South: 2,331West: 745 86.8% of Moline residents lived in the same house 1 years ago.
Out of people who lived in different houses, 31.3% lived in this county.
Out of people who lived in different counties, 52.9% lived in Illinois.
Moline:
86.8%State average:
88.3%
Education attainment for males 25 years and older:
No schooling: 168Nursery to 4th grade: 155th and 6th grade: 1407th and 8th grade: 929th grade: 43310th grade: 8811th grade: 16712th grade, no diploma: 185High school graduate (or equivalency): 4,331Less than 1 year of college: 1,284Some college more than 1 year, no degree: 1,912Associate degree: 1,358Bachelor's degree: 2,638Master's degree: 1,109Professional school degree: 448Doctorate degree: 217
Education attainment for females 25 years and older:
No schooling: 362Nursery to 4th grade: 225th and 6th grade: 1857th and 8th grade: 939th grade: 15710th grade: 6311th grade: 21712th grade, no diploma: 335High school graduate (or equivalency): 3,784Less than 1 year of college: 1,817Some college more than 1 year, no degree: 2,096Associate degree: 1,581Bachelor's degree: 2,916Master's degree: 1,373Professional school degree: 95Doctorate degree: 151
Housing units in structures:
One, detached: 13,558One, attached: 1,198Two: 6993 or 4: 8115 to 9: 1,06510 to 19: 77620 to 49: 65550 or more: 824Mobile homes: 213Median worth of mobile homes: $10,300
Housing units lacking complete plumbing facilities in 2022: 1.8%Housing units lacking complete kitchen facilities in 2022: 2.7%House/condo owner moved in on average 13 years ago
Renter moved in on average 3 years ago
Private vs. public school enrollment:
Students in private schools in grades 1 to 8 (elementary and middle school): 392 Students in private schools in grades 9 to 12 (high school): 262 Students in private undergraduate colleges: 233