Monterey Park, CA (California) Houses and Residents
| Monterey Park: | $847,299 |
| California: | $715,900 |
Mean price in 2022:
Detached houses: $959,999
Here: $959,999 State: $988,808 Townhouses or other attached units: $631,359
Here: $631,359 State: $838,546 In 2-unit structures: $720,123
Here: $720,123 State: $1,138,100 In 3-to-4-unit structures: $688,090
Here: $688,090 State: $824,253 In 5-or-more-unit structures: $604,841
Here: $604,841 State: $730,996 Mobile homes: $938,663
Here: $938,663 State: $184,506
Total population: 61,458 (Urban population: 59,933, Rural population: 0)
Houses: 21,986 (20,656 occupied: 10,461 owner occupied, 10,274 renter occupied)
| % of renters here: | 50% |
| State: | 44% |
Housing density: 2,881 houses/condos per square mile
Median price asked for vacant for-sale houses and condos in 2022: $786,527.
Median contract rent in 2022: $1,689 (lower quartile is $1,264, upper quartile is over $2,000)
Median rent asked for vacant for-rent units in 2022: $2,068
Median gross rent in Monterey Park, CA in 2022: $1,791
Housing units in Monterey Park with a mortgage: 5,189 (478 second mortgage, 28 home equity loan, 416 both second mortgage and home equity loan)
Houses without a mortgage: 45
Median household income for houses/condos with a mortgage: $126,572
Median household income for apartments without a mortgage: $83,043
Median monthly housing costs: $1,670
Compare current foreclosures near Monterey Park, CA:
| Photo | Address | Area | Beds / Baths | Price | Details |
|---|---|---|---|---|---|

|
#1
Mesa Way
Monterey Park, CA 91754
|
1,818 sq. feet
|
3 baths 3 beds |
$30,027
|
show details |

|
#2
Fulton Ave
Monterey Park, CA 91755
|
1,595 sq. feet
|
2 baths 4 beds |
show details | |

|
#3
Casuda Canyon Dr
Monterey Park, CA 91754
|
1,795 sq. feet
|
3 baths 4 beds |
show details | |

|
#4
S Garfield Ave Unit 73
Monterey Park, CA 91754
|
721 sq. feet
|
1 baths 1 beds |
show details | |

|
#5
W Floral Dr
Monterey Park, CA 91754
|
1,173 sq. feet
|
1 baths 3 beds |
show details | |

|
#6
S Sunrise Dr
Monterey Park, CA 91754
|
1,954 sq. feet
|
2 baths 3 beds |
show details | |

|
#7
Verde Vista Dr
Monterey Park, CA 91754
|
1,995 sq. feet
|
2 baths 4 beds |
show details | |

|
#8
N Sierra Vista St # 2
Monterey Park, CA 91755
|
2,031 sq. feet
|
3 baths 4 beds |
show details | |

|
#9
Florence Ave
Monterey Park, CA 91755
|
786 sq. feet
|
3 baths 6 beds |
show details | |

|
#10
S Ynez Ave
Monterey Park, CA 91754
|
878 sq. feet
|
1 baths 2 beds |
show details |
| Photo | Address | Area | Beds / Baths | Price | Details |
|---|---|---|---|---|---|

|
#11
Vancouver Ave
Monterey Park, CA 91754
|
- sq. feet
|
- baths - beds |
show details | |

|
#12
W Garvey Ave # B1198
Monterey Park, CA 91754
|
- sq. feet
|
- baths - beds |
show details | |

|
#13
S Ramona Ave
Monterey Park, CA 91754
|
- sq. feet
|
- baths - beds |
show details | |

|
#14
Edgley Dr Apt A
Monterey Park, CA 91755
|
- sq. feet
|
- baths - beds |
show details | |

|
#15
N Sierra Vista St Apt B
Monterey Park, CA 91755
|
- sq. feet
|
- baths - beds |
show details | |

|
#16
W Pomona Blvd # 783
Monterey Park, CA 91754
|
- sq. feet
|
- baths - beds |
show details | |

|
#17
E Hellman Ave Apt B
Monterey Park, CA 91755
|
- sq. feet
|
- baths - beds |
show details | |

|
#18
Russell Ave Apt A
Monterey Park, CA 91755
|
- sq. feet
|
- baths - beds |
show details | |

|
#19
N Lincoln Ave # 20
Monterey Park, CA 91755
|
- sq. feet
|
- baths - beds |
show details | |

|
#20
N New Ave
Monterey Park, CA 91755
|
- sq. feet
|
- baths - beds |
show details |
| Photo | Address | Area | Beds / Baths | Price | Details |
|---|---|---|---|---|---|

|
#21
N Mcpherrin Ave
Monterey Park, CA 91754
|
- sq. feet
|
- baths - beds |
show details | |

|
#22
S Lincoln Ave Apt A
Monterey Park, CA 91755
|
- sq. feet
|
- baths - beds |
show details | |

|
#23
Horn Ave Apt 618
West Hollywood, CA 90069
|
797 sq. feet
|
1 baths 1 beds |
$650,000
|
show details |

|
#24
E Norma Ave
West Covina, CA 91791
|
1,134 sq. feet
|
2 baths 3 beds |
$599,000
|
show details |

|
#25
Flicker Way
West Hollywood, CA 90069
|
1,612 sq. feet
|
3 baths 3 beds |
$2,195,500
|
show details |

|
#26
Hawkstone Ave
Whittier, CA 90605
|
1,444 sq. feet
|
2 baths 4 beds |
$674,900
|
show details |

|
#27
Cedarbrook Dr
Beverly Hills, CA 90210
|
2,371 sq. feet
|
2 baths 3 beds |
$2,350,000
|
show details |

|
#28
Millbury Ave
Baldwin Park, CA 91706
|
1,632 sq. feet
|
2 baths 4 beds |
$895,000
|
show details |

|
#29
W Florence Ave
Los Angeles, CA 90044
|
1,040 sq. feet
|
2 baths 3 beds |
$112,069
|
show details |

|
#30
Mobile Ave
Los Angeles, CA 90022
|
1,037 sq. feet
|
3 baths 4 beds |
$37,878
|
show details |
| Photo | Address | Area | Beds / Baths | Price | Details |
|---|---|---|---|---|---|

|
#31
Queens Rd
West Hollywood, CA 90069
|
2,730 sq. feet
|
4 baths 3 beds |
$278,041
|
show details |

|
#32
Lexington Gallatin Rd
Pico Rivera, CA 90660
|
1,425 sq. feet
|
2 baths 3 beds |
$23,795
|
show details |

|
#33
Donner Dr
Walnut, CA 91789
|
1,643 sq. feet
|
2 baths 4 beds |
$145,237
|
show details |

|
#34
Arvid St
La Puente, CA 91744
|
1,437 sq. feet
|
2 baths 4 beds |
$18,566
|
show details |

|
#35
Parron Ave
Gardena, CA 90249
|
1,058 sq. feet
|
1 baths 3 beds |
$102,148
|
show details |

|
#36
Elaine Ave
Norwalk, CA 90650
|
1,230 sq. feet
|
2 baths 2 beds |
$65,742
|
show details |

|
#37
E Desford St
Carson, CA 90745
|
1,613 sq. feet
|
2 baths 4 beds |
$85,513
|
show details |

|
#38
Belle River Dr
Hacienda Heights, CA 91745
|
2,028 sq. feet
|
3 baths 3 beds |
$38,273
|
show details |

|
#39
N 19th St
Montebello, CA 90640
|
1,141 sq. feet
|
1 baths 3 beds |
$38,542
|
show details |

|
#40
Walnut St
El Monte, CA 91731
|
1,012 sq. feet
|
1 baths 2 beds |
$12,525
|
show details |
| Photo | Address | Area | Beds / Baths | Price | Details |
|---|---|---|---|---|---|

|
#41
Armley Ave
Whittier, CA 90603
|
1,461 sq. feet
|
2 baths 2 beds |
$102,885
|
show details |

|
#42
Burton Rd
Glendora, CA 91740
|
1,302 sq. feet
|
2 baths 4 beds |
$21,523
|
show details |

|
#43
Calle Parral
West Covina, CA 91792
|
1,325 sq. feet
|
2 baths 2 beds |
$6,341
|
show details |

|
#44
Hepburn Ave
Los Angeles, CA 90008
|
1,909 sq. feet
|
2 baths 2 beds |
$23,869
|
show details |

|
#45
Lafayette St
San Gabriel, CA 91776
|
852 sq. feet
|
1 baths 2 beds |
$14,806
|
show details |

|
#46
E Holton St
West Covina, CA 91791
|
- sq. feet
|
2 baths 3 beds |
$450,000
|
show details |

|
#47
Pacific View Dr
Los Angeles, CA 90068
|
2,590 sq. feet
|
3 baths 3 beds |
$120,291
|
show details |

|
#48
N Hamilton Dr Unit 309
Beverly Hills, CA 90211
|
1,258 sq. feet
|
2 baths 2 beds |
$126,223
|
show details |

|
#49
Ramona St Unit 7
Bellflower, CA 90706
|
2,493 sq. feet
|
2 baths 3 beds |
$157,255
|
show details |

|
Check over 1 million property listings on Foreclosure.com!
|
browse all offers | |||


Median year apartment built: 1967
Household type by relationship:
Households: 59,076- Male householders: 10,792 (1,318 living alone), Female householders: 9,180 (2,249 living alone)
9,986 spouses (9,804 opposite-sex spouses), 945 unmarried partners, (865 opposite-sex unmarried partners), 16,229 children (15,754 natural, 196 adopted, 277 stepchildren), 1,149 grandchildren, 1,956 brothers or sisters, 3,088 parents, 0 foster children, 2,248 other relatives, 3,203 non-relatives
- In group quarters: 295
Size of family households: 5,973 2-persons, 3,715 3-persons, 3,240 4-persons, 1,783 5-persons, 368 6-persons, 308 7-or-more-persons.
Size of nonfamily households: 3,827 1-person, 881 2-persons, 339 3-persons, 197 4-persons, 24 5-persons, 24 6-persons, 22 7-or-more-persons.
6,280 married couples with children.
2,272 single-parent households (550 men, 1,722 women).
27.7% of residents of Monterey Park speak English at home.
17.2% of residents speak Spanish at home (78% speak English very well, 15% speak English well, 6% speak English not well, 1% don't speak English at all).
1.5% of residents speak other Indo-European language at home (87% speak English very well, 9% speak English well, 4% speak English not well).
52.8% of residents speak Asian or Pacific Island language at home (33% speak English very well, 23% speak English well, 28% speak English not well, 16% don't speak English at all).
0.7% of residents speak other language at home (96% speak English very well, 4% speak English not well).
Foreign born population: 30,268 (51.2%)
(64.3% of them are naturalized citizens)
| Here: | 5.4 |
| State: | 6.0 |
| Here: | 3.9 |
| State: | 3.9 |

- Bedrooms in owner-occupied houses and condos in Monterey Park, California
- 29no bedroom
- 1891 bedroom
- 1,6262 bedrooms
- 5,5433 bedrooms
- 2,5384 bedrooms
- 5355+ bedrooms

- Bedrooms in renter-occupied apartments in Monterey Park, California
- 479no bedroom
- 2,2191 bedroom
- 4,2002 bedrooms
- 2,7493 bedrooms
- 5824 bedrooms
- 455+ bedrooms

- Cars and other vehicles available in Monterey Park in owner-occupied houses/condos
- 599no vehicle
- 2,2171 vehicle
- 4,5972 vehicles
- 1,8123 vehicles
- 9664 vehicles
- 2705+ vehicles

- Cars and other vehicles available in Monterey Park in renter-occupied apartments
- 1,496no vehicle
- 3,2471 vehicle
- 3,4982 vehicles
- 1,3063 vehicles
- 6584 vehicles
- 695+ vehicles

- Rooms in owner-occupied houses in Monterey Park, California
- 221 room
- 1182 rooms
- 5423 rooms
- 2,0264 rooms
- 2,6155 rooms
- 2,5206 rooms
- 1,1287 rooms
- 1,0188 rooms
- 4719+ rooms

- Rooms in renter-occupied apartments in Monterey Park, California
- 4341 room
- 8212 rooms
- 2,7593 rooms
- 3,2004 rooms
- 1,8395 rooms
- 7086 rooms
- 3227 rooms
- 1498 rooms
- 439+ rooms


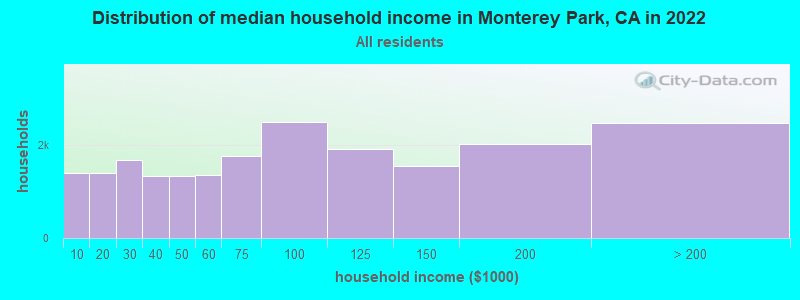
Monterey Park, CA household income distribution

- 1,405Less than $10,000
- 1,402$10,000 to $19,999
- 1,681$20,000 to $29,999
- 1,332$30,000 to $39,999
- 1,325$40,000 to $49,999
- 1,353$50,000 to $59,999
- 1,764$60,000 to $74,999
- 2,496$75,000 to $99,999
- 1,907$100,000 to $124,999
- 1,556$125,000 to $149,999
- 2,026$150,000 to $199,999
- 2,480$200,000 or more
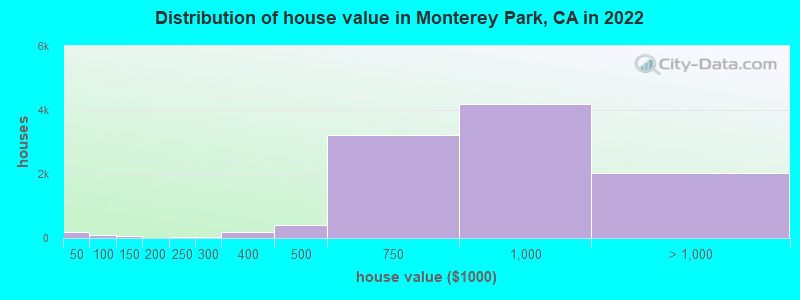
Home value of owner - occupied houses in 2022 in Monterey Park, CA
-
- 165Less than $10,000
- 10$10,000 to $14,999
- 4$20,000 to $24,999
- 43$50,000 to $59,999
- 8$60,000 to $69,999
- 9$70,000 to $79,999
- 18$80,000 to $89,999
- 39$100,000 to $124,999
- 24$125,000 to $149,999
- 11$175,000 to $199,999
- 37$200,000 to $249,999
- 35$250,000 to $299,999
- 178$300,000 to $399,999
- 420$400,000 to $499,999
- 3,232$500,000 to $749,999
- 4,183$750,000 to $999,999
- 1,576$1,000,000 to $1,499,999
- 437$1,500,000 to $1,999,999
- 27$2,000,000 or more
Rent paid by renters in 2022 in Monterey Park, CA
-
- 23Less than $100
- 8$100 to $149
- 26$150 to $199
- 108$200 to $249
- 122$250 to $299
- 70$300 to $349
- 3$350 to $399
- 52$450 to $499
- 138$500 to $549
- 118$550 to $599
- 10$600 to $649
- 30$650 to $699
- 70$700 to $749
- 38$750 to $799
- 289$800 to $899
- 233$900 to $999
- 907$1,000 to $1,249
- 1,380$1,250 to $1,499
- 2,956$1,500 to $1,999
- 1,757$2,000 to $2,499
- 624$2,500 to $2,999
- 475$3,000 to $3,499
- 30$3,500 or more
- 871No cash rent


Percentage of workers working in this county: 95.7%
Number of people working at home: 4,795 (17.3% of all workers)
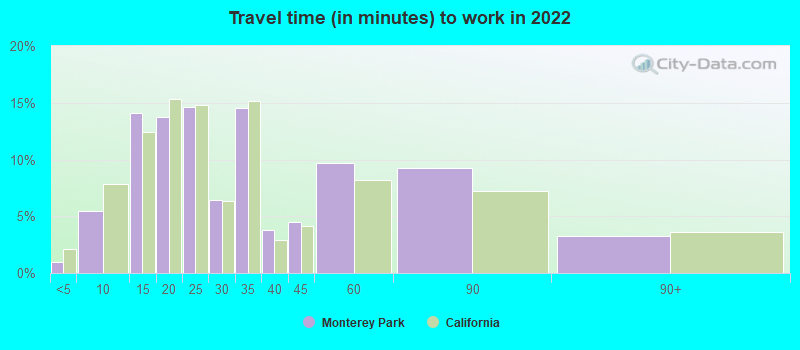
Travel time to work (commute)
- Less than 5 minutes: 262
- 5 to 9 minutes: 1,155
- 10 to 14 minutes: 2,825
- 15 to 19 minutes: 3,758
- 20 to 24 minutes: 3,230
- 25 to 29 minutes: 1,252
- 30 to 34 minutes: 4,248
- 35 to 39 minutes: 692
- 40 to 44 minutes: 1,189
- 45 to 59 minutes: 2,398
- 60 to 89 minutes: 1,652
- 90 or more minutes: 406
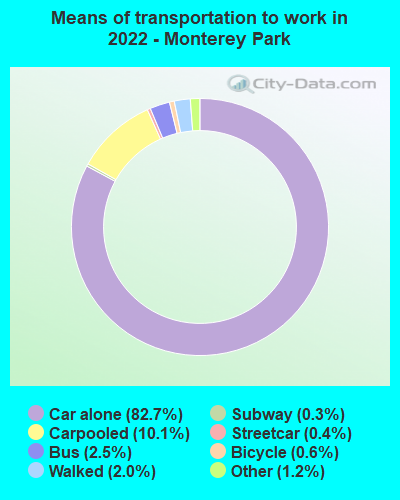
Means of transportation to work:
- Drove a car alone: 16,702 (66.8%)
- Carpooled: 2,261 (9.0%)
- Bus: 456 (1.8%)
- Subway or elevated rail: 67 (0.3%)
- Long-distance train or commuter rail: 42 (0.2%)
- Ferryboat: 9 (0.0%)
- Taxi: 276 (1.1%)
- Bicycle: 116 (0.5%)
- Walked: 444 (1.8%)
- Worked at home: 4,795 (19.2%)

- Unemployment by race in 2022
- Unemployment rate for White non-Hispanic residents
- 9.5%Males
- 9.6%Females
- Unemployment rate for Black residents
- 22.7%Females
- Unemployment rate for American Indian and Alaska Native residents
- 6.6%Males
- Unemployment rate for Asian residents
- 4.9%Males
- 4.3%Females
- Unemployment rate for other race residents
- 2.1%Males
- 4.3%Females
- Unemployment rate for two or more race residents
- 10.2%Males
- 1.0%Females
- Unemployment rate for Hispanic or Latino residents
- 3.3%Males
- 2.4%Females

- Year of entry for the foreign-born population in Monterey Park, California
- 9,6452010 or later
- 4,6542000 to 2009
- 4,9321990 to 1999
- 10,8341980 to 1989
- 6,0911970 to 1979
- 4,271Before 1970
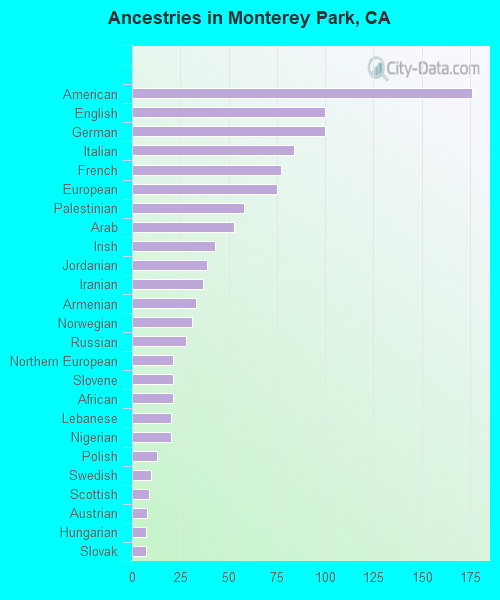
First ancestries reported:
- American: 176 (0.4%)
- English: 100 (0.2%)
- German: 100 (0.2%)
- Italian: 84 (0.2%)
- French: 77 (0.2%)
- European: 75 (0.2%)
- Palestinian: 58 (0.1%)
- Arab: 53 (0.1%)
- Irish: 43 (0.1%)
- Jordanian: 39 (0.09%)
- Iranian: 37 (0.09%)
- Armenian: 33 (0.08%)
- Norwegian: 31 (0.07%)
- Russian: 28 (0.07%)
- Northern European: 21 (0.05%)
- Slovene: 21 (0.05%)
- African: 21 (0.05%)
- Lebanese: 20 (0.05%)
- Nigerian: 20 (0.05%)
- Polish: 13 (0.03%)
- Swedish: 10 (0.02%)
- Scottish: 9 (0.02%)
- Austrian: 8 (0.02%)
- Hungarian: 7 (0.02%)
- Slovak: 7 (0.02%)
- Egyptian: 6 (0.01%)
- Belgian: 5 (0.01%)
- Eastern European: 5 (0.01%)
Most common places of birth for foreign-born residents (%):
| Monterey Park: | 45.5% (13,777) |
| California: | 6.6% (684,672) |
| Monterey Park: | 13.7% (4,150) |
| California: | 4.9% (512,335) |
| Monterey Park: | 8.1% (2,451) |
| California: | 1.0% (105,215) |
| Monterey Park: | 7.3% (2,223) |
| California: | 37.2% (3,881,193) |
| Monterey Park: | 5.4% (1,642) |
| California: | 1.7% (176,274) |
| Monterey Park: | 3.1% (925) |
| California: | 7.8% (818,297) |
| Monterey Park: | 2.0% (604) |
| California: | 0.5% (51,974) |
| Monterey Park: | 1.9% (571) |
| California: | 3.0% (315,248) |
| Monterey Park: | 1.8% (559) |
| California: | 0.3% (28,176) |
| Monterey Park: | 1.7% (523) |
| California: | 1.0% (103,575) |
Place of birth for U.S.-born residents:
- This state: 24,993
- Other state: 3,037
- Northeast: 508
- Midwest: 615
- South: 941
- West: 926
91.1% of Monterey Park residents lived in the same house 1 years ago.
Out of people who lived in different houses, 44.1% lived in this county.
Out of people who lived in different counties, 72.8% lived in California.
| Monterey Park: | 91.1% |
| State average: | 88.9% |
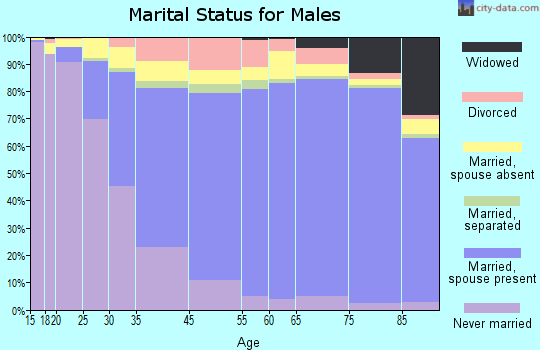
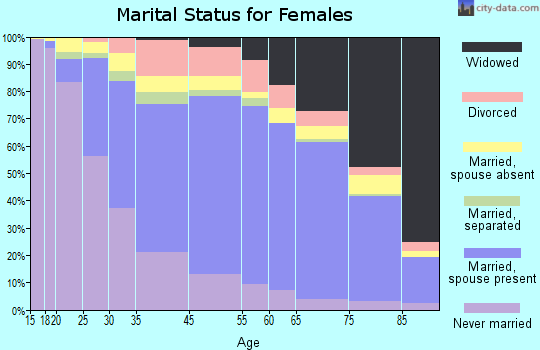
Education attainment for males 25 years and older:
- No schooling: 1,876
- Nursery to 4th grade: 171
- 5th and 6th grade: 515
- 7th and 8th grade: 229
- 9th grade: 466
- 10th grade: 117
- 11th grade: 132
- 12th grade, no diploma: 851
- High school graduate (or equivalency): 5,346
- Less than 1 year of college: 852
- Some college more than 1 year, no degree: 2,096
- Associate degree: 1,454
- Bachelor's degree: 5,259
- Master's degree: 1,674
- Professional school degree: 414
- Doctorate degree: 277

Education attainment for females 25 years and older:
- No schooling: 2,423
- Nursery to 4th grade: 266
- 5th and 6th grade: 857
- 7th and 8th grade: 305
- 9th grade: 386
- 10th grade: 171
- 11th grade: 107
- 12th grade, no diploma: 667
- High school graduate (or equivalency): 5,839
- Less than 1 year of college: 745
- Some college more than 1 year, no degree: 2,345
- Associate degree: 1,712
- Bachelor's degree: 5,608
- Master's degree: 1,743
- Professional school degree: 407
- Doctorate degree: 138

Housing units in structures:
- One, detached: 12,552
- One, attached: 2,251
- Two: 627
- 3 or 4: 1,358
- 5 to 9: 1,437
- 10 to 19: 1,181
- 20 to 49: 1,208
- 50 or more: 1,333
- Mobile homes: 36
Housing units lacking complete kitchen facilities in 2022: 3.5%
House/condo owner moved in on average 20 years ago
Renter moved in on average 6 years ago

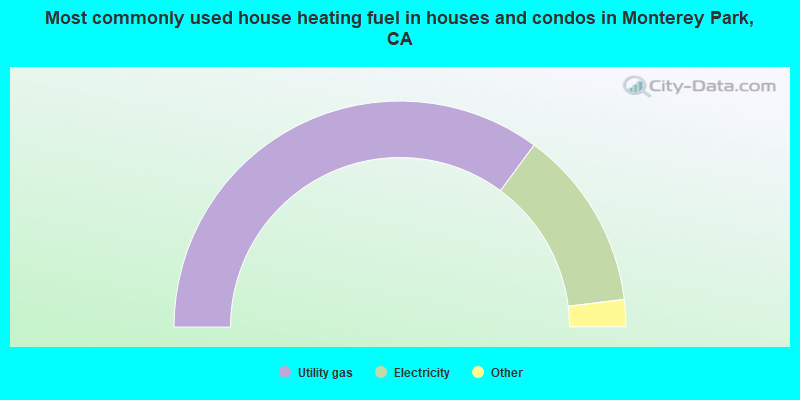
- 70.3%Utility gas
- 25.9%Electricity
- 1.8%Bottled, tank, or LP gas
- 1.4%No fuel used
- 0.3%Wood
- 0.3%Solar energy
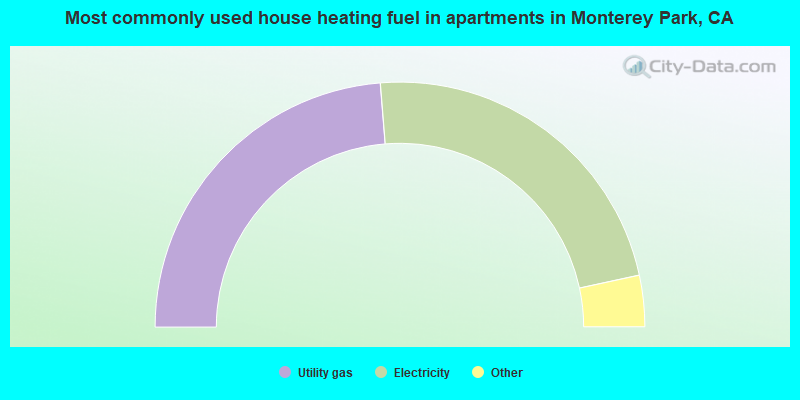
- 47.5%Utility gas
- 45.8%Electricity
- 3.3%Bottled, tank, or LP gas
- 2.9%No fuel used
- 0.3%Other fuel
- 0.2%Wood
- 0.1%Fuel oil, kerosene, etc.
Private vs. public school enrollment:
| Here: | 13.8% |
| California: | 10.5% |
| Here: | 3.8% |
| California: | 8.5% |
| Here: | 10.1% |
| California: | 15.9% |


