Moorestown-Lenola, NJ (New Jersey) Houses and Residents
| Moorestown-Lenola: | $530,923 |
| New Jersey: | $428,900 |
Mean price in 2022:
Detached houses: $736,501
Here: $736,501 State: $537,591 Townhouses or other attached units: $473,718
Here: $473,718 State: $381,113 In 5-or-more-unit structures: $359,545
Here: $359,545 State: $368,745
Total population: 14,217 (Urban population: 13,804, Rural population: 0)
Houses: 5,868 (5,421 occupied: 4,584 owner occupied, 855 renter occupied)
| % of renters here: | 16% |
| State: | 35% |
Housing density: 833 houses/condos per square mile
Median price asked for vacant for-sale houses and condos in 2022: $760,499.
Median contract rent in 2022: $1,196 (lower quartile is $784, upper quartile is $1,753)
Median rent asked for vacant for-rent units in 2022: $2,304
Median gross rent in Moorestown-Lenola, NJ in 2022: $1,279
Housing units in Moorestown-Lenola with a mortgage: 2,896 (290 second mortgage, 0 home equity loan, 265 both second mortgage and home equity loan)
Houses without a mortgage: 127
Median household income for houses/condos with a mortgage: $168,392
Median household income for apartments without a mortgage: $147,826
Median monthly housing costs: $1,941
Compare current foreclosures near Moorestown-Lenola, NJ:
| Photo | Address | Area | Beds / Baths | Price | Details |
|---|---|---|---|---|---|

|
#1
Arneys Mount Rd
Pemberton, NJ 08068
|
2,514 sq. feet
|
2 baths 3 beds |
$399,000
|
show details |

|
#2
N 5th St
Philadelphia, PA 19126
|
1,420 sq. feet
|
2 baths 3 beds |
$313,900
|
show details |

|
#3
Harmer St
Philadelphia, PA 19131
|
1,134 sq. feet
|
1 baths 3 beds |
$70,000
|
show details |

|
#4
Covered Bridge Rd
Cherry Hill, NJ 08034
|
1,343 sq. feet
|
1 baths 3 beds |
$465,000
|
show details |

|
#5
Jessamine Ave
Oaklyn, NJ 08107
|
864 sq. feet
|
2 baths 5 beds |
$415,000
|
show details |

|
#6
Princeton Ave
Philadelphia, PA 19149
|
1,224 sq. feet
|
1 baths 3 beds |
$215,000
|
show details |

|
#7
N Philip St
Philadelphia, PA 19140
|
894 sq. feet
|
1 baths 3 beds |
$42,500
|
show details |

|
#8
Freeland Ave
Philadelphia, PA 19128
|
1,114 sq. feet
|
1 baths 3 beds |
$355,000
|
show details |

|
#9
Christian St
Philadelphia, PA 19146
|
1,612 sq. feet
|
2 baths 5 beds |
$474,050
|
show details |

|
#10
N Cedar St
Bristol, PA 19007
|
841 sq. feet
|
1 baths 1 beds |
$315,500
|
show details |
| Photo | Address | Area | Beds / Baths | Price | Details |
|---|---|---|---|---|---|

|
#11
N Forklanding Rd
Maple Shade, NJ 08052
|
1,450 sq. feet
|
1 baths 3 beds |
$259,900
|
show details |

|
#12
Manchester Rd
Elkins Park, PA 19027
|
3,444 sq. feet
|
2 baths 3 beds |
$570,000
|
show details |

|
#13
Edwards Ave
Barrington, NJ 08007
|
1,112 sq. feet
|
1 baths 3 beds |
$325,500
|
show details |

|
#14
Foxglove Dr
Riverside, NJ 08075
|
840 sq. feet
|
1 baths 2 beds |
$113,683
|
show details |

|
#15
Farragut Ct
Willingboro, NJ 08046
|
954 sq. feet
|
1 baths 2 beds |
$174,900
|
show details |

|
#16
Broadway
Westville, NJ 08093
|
1,548 sq. feet
|
1 baths 3 beds |
$259,900
|
show details |

|
#17
Kershaw St
Philadelphia, PA 19131
|
1,284 sq. feet
|
1 baths 3 beds |
$139,900
|
show details |

|
#18
Benjamin Ct # 141
Philadelphia, PA 19114
|
1,553 sq. feet
|
3 baths 2 beds |
$251,000
|
show details |

|
#19
Edgewood Ave
Audubon, NJ 08106
|
1,250 sq. feet
|
1 baths 4 beds |
$389,900
|
show details |

|
#20
N 10th St
Philadelphia, PA 19141
|
1,154 sq. feet
|
2 baths 2 beds |
$78,000
|
show details |
| Photo | Address | Area | Beds / Baths | Price | Details |
|---|---|---|---|---|---|

|
#21
N Front St Apt B
Philadelphia, PA 19123
|
2,491 sq. feet
|
2 baths 3 beds |
$677,500
|
show details |

|
#22
Harvey Ave
Pennsauken, NJ 08110
|
1,555 sq. feet
|
2 baths 4 beds |
$429,900
|
show details |

|
#23
Maple Ave
Woodbury Heights, NJ 08097
|
1,390 sq. feet
|
2 baths 3 beds |
$279,900
|
show details |

|
#24
Rawle St
Philadelphia, PA 19149
|
1,152 sq. feet
|
1 baths 3 beds |
$40,900
|
show details |

|
#25
N 8th St
Philadelphia, PA 19120
|
1,140 sq. feet
|
1 baths 3 beds |
$10,357
|
show details |

|
#26
Cobbs Creek Pkwy
Philadelphia, PA 19143
|
1,664 sq. feet
|
1 baths 4 beds |
$158,886
|
show details |

|
#27
E Courtland St
Philadelphia, PA 19120
|
800 sq. feet
|
1 baths 3 beds |
$76,008
|
show details |

|
#28
N 20th St
Philadelphia, PA 19140
|
1,324 sq. feet
|
1 baths 4 beds |
$3,600
|
show details |

|
#29
E Pastorius St
Philadelphia, PA 19138
|
1,434 sq. feet
|
1 baths 3 beds |
$78,248
|
show details |

|
#30
Fanshawe St
Philadelphia, PA 19149
|
1,100 sq. feet
|
1 baths 3 beds |
$191,268
|
show details |
| Photo | Address | Area | Beds / Baths | Price | Details |
|---|---|---|---|---|---|

|
#31
Presidential Blvd Unit 915b
Bala Cynwyd, PA 19004
|
579 sq. feet
|
1 baths 1 beds |
$104,531
|
show details |

|
#32
N Willington St
Philadelphia, PA 19121
|
960 sq. feet
|
1 baths 3 beds |
$69,647
|
show details |

|
#33
Jasper St
Philadelphia, PA 19134
|
1,130 sq. feet
|
1 baths 3 beds |
$200,456
|
show details |

|
#34
Watkins St
Philadelphia, PA 19148
|
840 sq. feet
|
1 baths 3 beds |
$153,383
|
show details |

|
#35
Kingsessing Ave
Philadelphia, PA 19143
|
1,200 sq. feet
|
1 baths 3 beds |
$150,353
|
show details |

|
#36
Mifflin St
Philadelphia, PA 19145
|
1,100 sq. feet
|
1 baths 3 beds |
$237,714
|
show details |

|
#37
Scattergood St
Philadelphia, PA 19124
|
992 sq. feet
|
1 baths 3 beds |
$65,864
|
show details |

|
#38
E Cornwall St
Philadelphia, PA 19134
|
1,140 sq. feet
|
1 baths 3 beds |
$65,832
|
show details |

|
#39
E Haines St
Philadelphia, PA 19138
|
6,817 sq. feet
|
2 baths 5 beds |
$335,289
|
show details |

|
#40
S 19th St
Philadelphia, PA 19146
|
1,338 sq. feet
|
1 baths 3 beds |
$195,061
|
show details |
| Photo | Address | Area | Beds / Baths | Price | Details |
|---|---|---|---|---|---|

|
#41
E Phil Ellena St
Philadelphia, PA 19150
|
1,170 sq. feet
|
2 baths 3 beds |
$158,152
|
show details |

|
#42
E Rittenhouse St
Philadelphia, PA 19138
|
1,614 sq. feet
|
1 baths 3 beds |
$114,894
|
show details |

|
#43
S 68th St
Philadelphia, PA 19142
|
1,140 sq. feet
|
1 baths 3 beds |
$706,157
|
show details |

|
#44
E Pacific St
Philadelphia, PA 19134
|
1,245 sq. feet
|
1 baths 3 beds |
$48,772
|
show details |

|
#45
Stenton Ave
Philadelphia, PA 19138
|
1,256 sq. feet
|
1 baths 3 beds |
$214,722
|
show details |

|
#46
Kershaw St
Philadelphia, PA 19131
|
1,190 sq. feet
|
1 baths 3 beds |
$70,880
|
show details |

|
#47
W Stiles St
Philadelphia, PA 19131
|
1,110 sq. feet
|
1 baths 3 beds |
$46,625
|
show details |

|
#48
W Stiles St
Philadelphia, PA 19131
|
1,110 sq. feet
|
1 baths 3 beds |
$46,754
|
show details |

|
#49
Church Rd
Philadelphia, PA 19131
|
1,280 sq. feet
|
1 baths 3 beds |
$201,955
|
show details |

|
Check over 1 million property listings on Foreclosure.com!
|
browse all offers | |||


 | Relocating from Long Island to Burlington County - Suggestions Wanted (9 replies) |

Median year apartment built: 1971
Household type by relationship:
Households: 14,511- Male householders: 2,624 (522 living alone), Female householders: 2,806 (796 living alone)
3,276 spouses (3,276 opposite-sex spouses), 172 unmarried partners, (172 opposite-sex unmarried partners), 4,636 children (4,411 natural, 24 adopted, 200 stepchildren), 335 grandchildren, 52 brothers or sisters, 125 parents, 0 foster children, 111 other relatives, 129 non-relatives
- In group quarters: 241
Size of family households: 1,927 2-persons, 766 3-persons, 756 4-persons, 404 5-persons, 75 6-persons, 51 7-or-more-persons.
Size of nonfamily households: 1,352 1-person, 79 2-persons, 43 3-persons.
2,435 married couples with children.
459 single-parent households (134 men, 325 women).
89.9% of residents of Moorestown-Lenola speak English at home.
4.0% of residents speak Spanish at home (61% speak English very well, 20% speak English well, 13% speak English not well, 6% don't speak English at all).
3.3% of residents speak other Indo-European language at home (88% speak English very well, 5% speak English well, 6% speak English not well).
1.0% of residents speak Asian or Pacific Island language at home (46% speak English very well, 42% speak English well, 12% speak English not well).
1.5% of residents speak other language at home (45% speak English very well, 22% speak English well, 34% speak English not well).
Foreign born population: 1,266 (8.7%)
(80.3% of them are naturalized citizens)
| Here: | 8.0 |
| State: | 6.8 |
| Here: | 4.5 |
| State: | 3.9 |

- Bedrooms in owner-occupied houses and condos in Moorestown-Lenola, New Jersey
- 0no bedroom
- 141 bedroom
- 3672 bedrooms
- 1,5473 bedrooms
- 1,8244 bedrooms
- 8325+ bedrooms

- Bedrooms in renter-occupied apartments in Moorestown-Lenola, New Jersey
- 62no bedroom
- 2081 bedroom
- 4172 bedrooms
- 1233 bedrooms
- 384 bedrooms
- 65+ bedrooms

- Cars and other vehicles available in Moorestown-Lenola in owner-occupied houses/condos
- 72no vehicle
- 1,0941 vehicle
- 2,0692 vehicles
- 9313 vehicles
- 2364 vehicles
- 1845+ vehicles

- Cars and other vehicles available in Moorestown-Lenola in renter-occupied apartments
- 181no vehicle
- 4431 vehicle
- 1512 vehicles
- 403 vehicles
- 84 vehicles
- 325+ vehicles

- Rooms in owner-occupied houses in Moorestown-Lenola, New Jersey
- 01 room
- 02 rooms
- 493 rooms
- 1404 rooms
- 2145 rooms
- 4566 rooms
- 8297 rooms
- 9428 rooms
- 1,9559+ rooms

- Rooms in renter-occupied apartments in Moorestown-Lenola, New Jersey
- 621 room
- 1242 rooms
- 1323 rooms
- 954 rooms
- 1975 rooms
- 1466 rooms
- 417 rooms
- 408 rooms
- 179+ rooms


Moorestown-Lenola, NJ household income distribution

- 162Less than $10,000
- 392$10,000 to $19,999
- 225$20,000 to $29,999
- 116$30,000 to $39,999
- 126$40,000 to $49,999
- 205$50,000 to $59,999
- 172$60,000 to $74,999
- 610$75,000 to $99,999
- 523$100,000 to $124,999
- 523$125,000 to $149,999
- 553$150,000 to $199,999
- 1,814$200,000 or more
Home value of owner - occupied houses in 2022 in Moorestown-Lenola, NJ
-
- 11$60,000 to $69,999
- 53$100,000 to $124,999
- 18$125,000 to $149,999
- 21$150,000 to $174,999
- 81$175,000 to $199,999
- 190$200,000 to $249,999
- 413$250,000 to $299,999
- 969$300,000 to $399,999
- 649$400,000 to $499,999
- 1,641$500,000 to $749,999
- 516$750,000 to $999,999
- 201$1,000,000 to $1,499,999
- 77$1,500,000 to $1,999,999
Rent paid by renters in 2022 in Moorestown-Lenola, NJ
-
- 6$100 to $149
- 11$200 to $249
- 66$550 to $599
- 5$600 to $649
- 147$650 to $699
- 25$700 to $749
- 148$800 to $899
- 47$900 to $999
- 88$1,000 to $1,249
- 63$1,250 to $1,499
- 208$1,500 to $1,999
- 98$2,000 to $2,499
- 44No cash rent


Percentage of workers working in this county: 61.2%
Number of people working at home: 1,530 (21.3% of all workers)
Travel time to work (commute)
- Less than 5 minutes: 281
- 5 to 9 minutes: 826
- 10 to 14 minutes: 857
- 15 to 19 minutes: 891
- 20 to 24 minutes: 486
- 25 to 29 minutes: 311
- 30 to 34 minutes: 711
- 35 to 39 minutes: 131
- 40 to 44 minutes: 251
- 45 to 59 minutes: 450
- 60 to 89 minutes: 427
- 90 or more minutes: 104
Means of transportation to work:
- Drove a car alone: 11,847 (78.9%)
- Carpooled: 1,114 (7.4%)
- Bus: 51 (0.3%)
- Taxi: 112 (0.7%)
- Bicycle: 16 (0.1%)
- Walked: 93 (0.6%)
- Worked at home: 1,530 (10.2%)

- Unemployment by race in 2022
- Unemployment rate for White non-Hispanic residents
- 2.9%Males
- 4.4%Females
- Unemployment rate for Black residents
- 5.4%Males
- 3.5%Females
- Unemployment rate for two or more race residents
- 3.8%Males
- 10.1%Females
- Unemployment rate for Hispanic or Latino residents
- 4.5%Males
- 2.9%Females

- Year of entry for the foreign-born population in Moorestown-Lenola, New Jersey
- 2602010 or later
- 2592000 to 2009
- 1981990 to 1999
- 1021980 to 1989
- 1181970 to 1979
- 258Before 1970
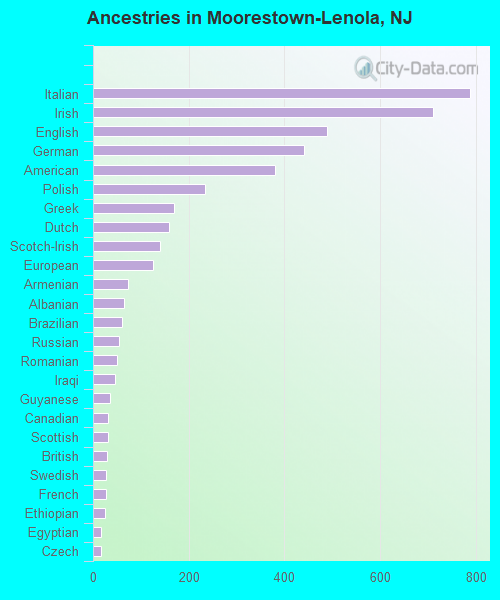
First ancestries reported:
- Italian: 788 (14.1%)
- Irish: 711 (12.7%)
- English: 488 (8.7%)
- German: 440 (7.9%)
- American: 380 (6.8%)
- Polish: 234 (4.2%)
- Greek: 170 (3.0%)
- Dutch: 159 (2.8%)
- Scotch-Irish: 141 (2.5%)
- European: 126 (2.3%)
- Armenian: 73 (1.3%)
- Albanian: 65 (1.2%)
- Brazilian: 61 (1.1%)
- Russian: 55 (1.0%)
- Romanian: 51 (0.9%)
- Iraqi: 46 (0.8%)
- Guyanese: 36 (0.6%)
- Canadian: 31 (0.6%)
- Scottish: 31 (0.6%)
- British: 30 (0.5%)
- Swedish: 28 (0.5%)
- French: 27 (0.5%)
- Ethiopian: 26 (0.5%)
- Egyptian: 16 (0.3%)
- Czech: 16 (0.3%)
- Ukrainian: 16 (0.3%)
- Turkish: 14 (0.3%)
- Lebanese: 13 (0.2%)
- Hungarian: 13 (0.2%)
- Eastern European: 12 (0.2%)
- Syrian: 11 (0.2%)
- French Canadian: 10 (0.2%)
- Lithuanian: 10 (0.2%)
- Carpatho Rusyn: 9 (0.2%)
- Liberian: 8 (0.1%)
- Portuguese: 7 (0.1%)
- Welsh: 6 (0.1%)
- Estonian: 3 (0.05%)
- Nigerian: 3 (0.05%)
Most common places of birth for foreign-born residents (%):
| Moorestown-Lenola: | 6.9% (77) |
| New Jersey: | 3.3% (70,512) |
| Moorestown-Lenola: | 6.3% (71) |
| New Jersey: | 0.7% (14,848) |
| Moorestown-Lenola: | 5.8% (65) |
| New Jersey: | 0.3% (6,130) |
| Moorestown-Lenola: | 5.3% (59) |
| New Jersey: | 0.2% (4,324) |
| Moorestown-Lenola: | 5.2% (58) |
| New Jersey: | 12.8% (274,609) |
| Moorestown-Lenola: | 5.1% (57) |
| New Jersey: | 3.7% (78,969) |
| Moorestown-Lenola: | 4.6% (52) |
| New Jersey: | 2.1% (46,020) |
| Moorestown-Lenola: | 4.6% (51) |
| New Jersey: | 4.2% (90,817) |
| Moorestown-Lenola: | 3.9% (44) |
| New Jersey: | 0.3% (6,033) |
| Moorestown-Lenola: | 3.4% (38) |
| New Jersey: | 1.2% (26,173) |
| Moorestown-Lenola: | 3.3% (37) |
| New Jersey: | 9.7% (209,055) |
| Moorestown-Lenola: | 3.1% (35) |
| New Jersey: | 4.8% (102,527) |
| Moorestown-Lenola: | 3.1% (35) |
| New Jersey: | 0.8% (17,217) |
| Moorestown-Lenola: | 2.9% (33) |
| New Jersey: | 0.9% (18,317) |
| Moorestown-Lenola: | 2.9% (32) |
| New Jersey: | 0.1% (1,815) |
| Moorestown-Lenola: | 2.7% (30) |
| New Jersey: | 0.6% (12,793) |
| Moorestown-Lenola: | 2.4% (27) |
| New Jersey: | 1.5% (33,198) |
| Moorestown-Lenola: | 2.1% (24) |
| New Jersey: | 2.7% (58,563) |
| Moorestown-Lenola: | 2.0% (22) |
| New Jersey: | 0.5% (10,975) |
| Moorestown-Lenola: | 2.0% (22) |
| New Jersey: | 0.0% (736) |
| Moorestown-Lenola: | 1.8% (20) |
| New Jersey: | 0.1% (2,083) |
| Moorestown-Lenola: | 1.8% (20) |
| New Jersey: | 2.3% (48,811) |
Place of birth for U.S.-born residents:
- This state: 7,064
- Other state: 6,009
- Northeast: 4,239
- Midwest: 516
- South: 1,004
- West: 239
90.9% of Moorestown-Lenola residents lived in the same house 1 years ago.
Out of people who lived in different houses, 30.8% lived in this county.
Out of people who lived in different counties, 39.8% lived in New Jersey.
| Moorestown-Lenola: | 90.9% |
| State average: | 90.4% |
Education attainment for males 25 years and older:
- No schooling: 19
- Nursery to 4th grade: 5
- 5th and 6th grade: 1
- 7th and 8th grade: 0
- 9th grade: 14
- 10th grade: 0
- 11th grade: 10
- 12th grade, no diploma: 89
- High school graduate (or equivalency): 682
- Less than 1 year of college: 215
- Some college more than 1 year, no degree: 382
- Associate degree: 296
- Bachelor's degree: 1,594
- Master's degree: 966
- Professional school degree: 318
- Doctorate degree: 173

Education attainment for females 25 years and older:
- No schooling: 65
- Nursery to 4th grade: 8
- 5th and 6th grade: 9
- 7th and 8th grade: 0
- 9th grade: 35
- 10th grade: 11
- 11th grade: 19
- 12th grade, no diploma: 35
- High school graduate (or equivalency): 723
- Less than 1 year of college: 449
- Some college more than 1 year, no degree: 357
- Associate degree: 269
- Bachelor's degree: 1,868
- Master's degree: 1,145
- Professional school degree: 265
- Doctorate degree: 159


Housing units in structures:
- One, detached: 4,504
- One, attached: 626
- Two: 116
- 3 or 4: 231
- 5 to 9: 55
- 10 to 19: 171
- 20 to 49: 93
- 50 or more: 68
Housing units lacking complete kitchen facilities in 2022: 1.9%
House/condo owner moved in on average 16 years ago
Renter moved in on average 5 years ago

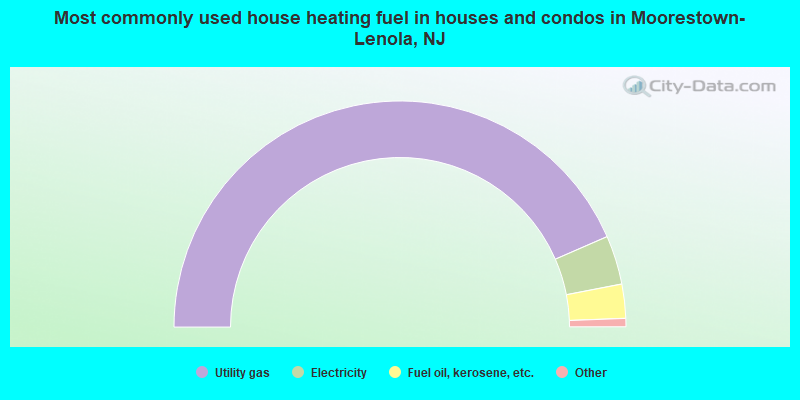
- 87.0%Utility gas
- 7.0%Electricity
- 4.9%Fuel oil, kerosene, etc.
- 0.7%Bottled, tank, or LP gas
- 0.3%Other fuel
- 0.2%Solar energy
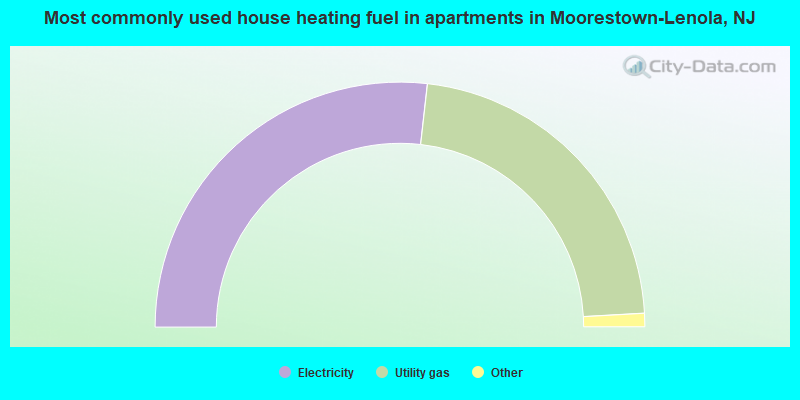
- 53.7%Electricity
- 44.7%Utility gas
- 0.9%Other fuel
- 0.7%No fuel used
Private vs. public school enrollment:
| Here: | 3.0% |
| New Jersey: | 12.3% |
| Here: | 15.8% |
| New Jersey: | 13.1% |
| Here: | 10.3% |
| New Jersey: | 33.2% |


