New Castle, PA (Pennsylvania) Houses and Residents
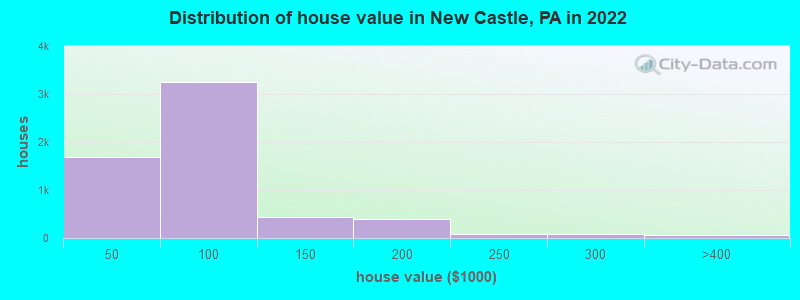
Estimated median house or condo value in 2022: $70,246 (it was $43,000 in 2000 )
New Castle:
$70,246Pennsylvania:
$245,500
Lower value quartile - upper value quartile: $43,368 - $109,012Mean price in 2022: Detached houses: $115,413 Here:
$115,413State:
$317,202
Townhouses or other attached units: $166,978 Here:
$166,978State:
$254,369
In 2-unit structures: $66,124 Here:
$66,124State:
$249,182
Mobile homes: $58,651 Here:
$58,651State:
$92,414
Total population: 22,575 (All urban)
Houses: 10,588 (9,135 occupied: 4,844 owner occupied, 4,239 renter occupied )
% of renters here:
47%State:
31%
Housing density: 1,240 houses/condos per square mile
Median price asked for vacant for-sale houses and condos in 2022: $59,084.
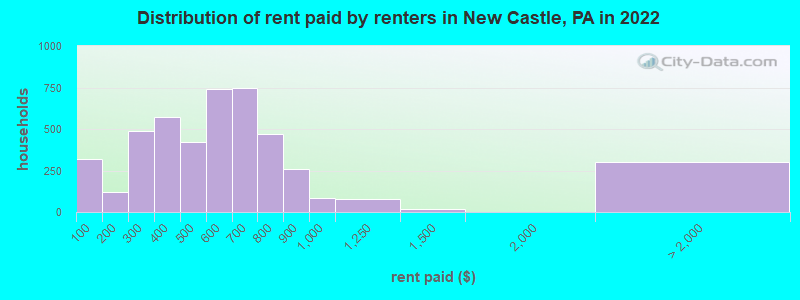
Median contract rent in 2022: $544 (lower quartile is $349, upper quartile is $680)
Median rent asked for vacant for-rent units in 2022: $559
Median gross rent in New Castle, PA in 2022: $728
Housing units in New Castle with a mortgage: 2,379 (236 second mortgage, 40 home equity loan, 174 both second mortgage and home equity loan )Houses without a mortgage: 196
Median household income for houses/condos with a mortgage: $60,081
Median household income for apartments without a mortgage: $42,859
Median monthly housing costs: $723
Data:
Median house or condo value ($)
Median house or condo value ($ change since 2000)
Median house or condo value ($) - White
Median house or condo value ($) - Black or African American
Median house or condo value ($) - Asian
Median house or condo value ($) - Hispanic or Latino
Median house or condo value ($) - American Indian and Alaska Native
Median house or condo value ($) - Multirace
Median house or condo value ($) - Other Race
Median price asked for mobile homes ($)
Household density (households per square mile)
Mean house or condo value by units in structure - 1, detached ($)
Mean house or condo value by units in structure - 1, attached ($)
Mean house or condo value by units in structure - 2 ($)
Mean house or condo value by units in structure by units in structure - 3 or 4 ($)
Mean house or condo value by units in structure - 5 or more ($)
Mean house or condo value by units in structure - Boat, RV, van, etc. ($)
Mean house or condo value by units in structure - Mobile home ($)
Median contract rent ($)
Median contract rent - Lower quartile ($)
Median contract rent - Upper quartile ($)
Median gross rent ($)
Urban houses (%)
Rural houses (%)
Houses occupied (%)
Houses occupied (% change since 2000)
Houses owner occupied (%)
Houses owner occupied (% change since 2000)
Houses renter occupied (%)
Houses renter occupied (% change since 2000)
Vacant housing units - For rent (%)
Vacant housing units - For rent (% change since 2000)
Vacant housing units - For sale only (%)
Vacant housing units - For sale only (% change since 2000)
Vacant housing units - Rented or sold, not occupied (%)
Vacant housing units - Rented or sold, not occupied (% change since 2000)
Vacant housing units - For seasonal, recreational, or occasional use (%)
Vacant housing units - For seasonal, recreational, or occasional use (% change since 2000)
Vacant housing units - For migrant workers (%)
Vacant housing units - For migrant workers (% change since 2000)
Vacant housing units - Other vacant (%)
Vacant housing units - Other vacant (% change since 2000)
Median monthly housing costs ($)
Median household income for houses/condos with a mortgage ($)
Median household income for houses/condos without a mortgage ($)
Median household income ($)
Median household income ($) - White
Median household income ($) - Black or African American
Median household income ($) - Asian
Median household income ($) - Hispanic or Latino
Median household income ($) - American Indian and Alaska Native
Median household income ($) - Multirace
Median household income ($) - Other Race
Mortgage status - with mortgage (%)
Mortgage status - with second mortgage (%)
Mortgage status - with home equity loan (%)
Mortgage status - with both second mortgage and home equity loan (%)
Mortgage status - without a mortgage (%)
Median year house/condo built
Median year apartment built
Household type by relationship - Male householder living alone (%)
Household type by relationship - Male householder not living alone (%)
Household type by relationship - Female householder living alone (%)
Household type by relationship - Female householder not living alone (%)
Household type by relationship - Opposite-Sex spouse (%)
Household type by relationship - Same-Sex spouse (%)
Household type by relationship - Opposite-Sex unmarried partner (%)
Household type by relationship - Same-Sex unmarried partner (%)
Household type by relationship - In group quarters (%)
Size of family households - 2-person household (%)
Size of family households - 3-person household (%)
Size of family households - 4-person household (%)
Size of family households - 5-person household (%)
Size of family households - 6-person household (%)
Size of family households - 7-or-more-person household (%)
Size of nonfamily households - 1-person household (%)
Size of nonfamily households - 2-person household (%)
Size of nonfamily households - 3-person household (%)
Size of nonfamily households - 4-person household (%)
Size of nonfamily households - 5-person household (%)
Size of nonfamily households - 6-person household (%)
Size of nonfamily households - 7-or-moreperson household (%)
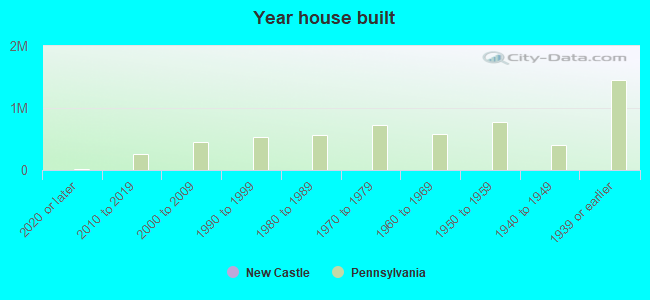
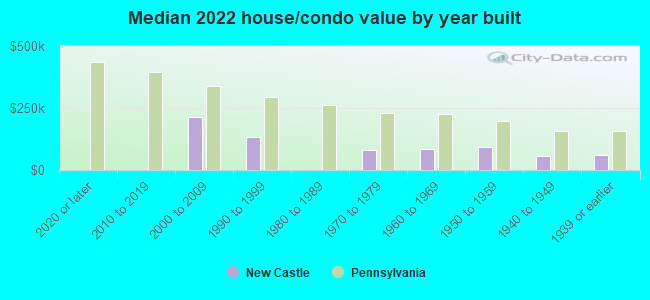
Year house built - Built 2010 or later (%)
Year house built - Built 2000 to 2009 (%)
Year house built - Built 1990 to 1999 (%)
Year house built - Built 1980 to 1989 (%)
Year house built - Built 1970 to 1979 (%)
Year house built - Built 1960 to 1969 (%)
Year house built - Built 1950 to 1959 (%)
Year house built - Built 1940 to 1949 (%)
Year house built - Built 1939 or earlier (%)
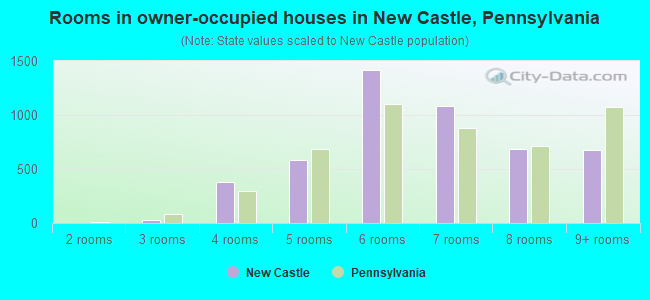
Median number of rooms in houses and condos
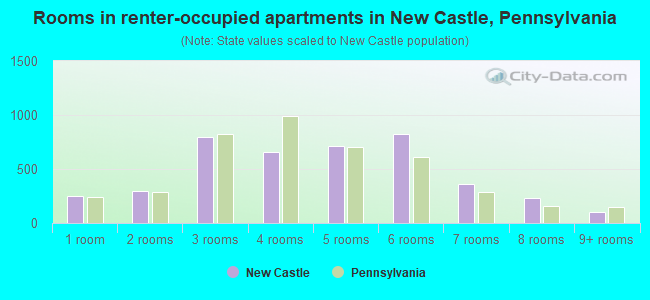
Median number of rooms in apartments
Median number of bedrooms in owner occupied houses
Mean number of bedrooms in owner occupied houses
Median number of bedrooms in renter occupied houses
Mean number of bedrooms in renter occupied houses
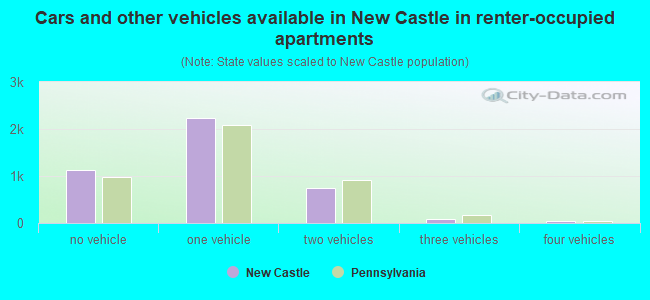
Median number of vehichles in owner occupied houses
Mean number of vehichles in owner occupied houses
Median number of vehichles in renter occupied houses
Mean number of vehichles in renter occupied houses
Rooms in owner-occupied houses - 1 room (%)
Rooms in owner-occupied houses - 2 rooms (%)
Rooms in owner-occupied houses - 3 rooms (%)
Rooms in owner-occupied houses - 4 rooms (%)
Rooms in owner-occupied houses - 5 rooms (%)
Rooms in owner-occupied houses - 6 rooms (%)
Rooms in owner-occupied houses - 7 rooms (%)
Rooms in owner-occupied houses - 8 rooms (%)
Rooms in owner-occupied houses - 9+ rooms (%)
Rooms in renter-occupied houses - 1 room (%)
Rooms in renter-occupied houses - 2 rooms (%)
Rooms in renter-occupied houses - 3 rooms (%)
Rooms in renter-occupied houses - 4 rooms (%)
Rooms in renter-occupied houses - 5 rooms (%)
Rooms in renter-occupied houses - 6 rooms (%)
Rooms in renter-occupied houses - 7 rooms (%)
Rooms in renter-occupied houses - 8 rooms (%)
Rooms in renter-occupied houses - 9+ rooms (%)
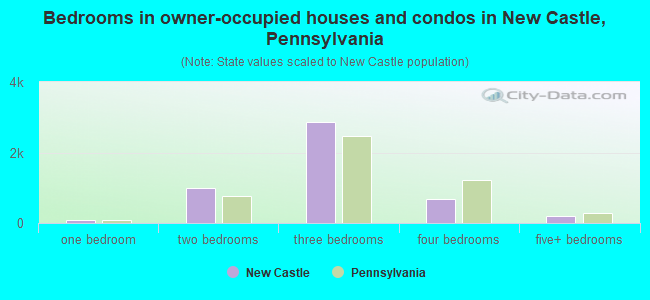
Bedrooms in owner-occupied houses - no bedrooms (%)
Bedrooms in owner-occupied houses - 1 bedroom (%)
Bedrooms in owner-occupied houses - 2 bedrooms (%)
Bedrooms in owner-occupied houses - 3 bedrooms (%)
Bedrooms in owner-occupied houses - 4 bedrooms (%)
Bedrooms in owner-occupied houses - 5+ bedrooms (%)
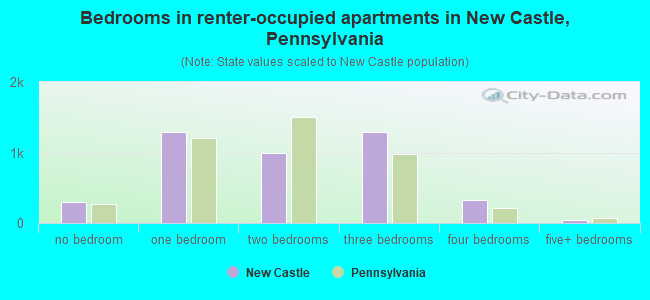
Bedrooms in renter-occupied houses - no bedrooms (%)
Bedrooms in renter-occupied houses - 1 bedroom (%)
Bedrooms in renter-occupied houses - 2 bedrooms (%)
Bedrooms in renter-occupied houses - 3 bedrooms (%)
Bedrooms in renter-occupied houses - 4 bedrooms (%)
Bedrooms in renter-occupied houses - 5+ bedrooms (%)
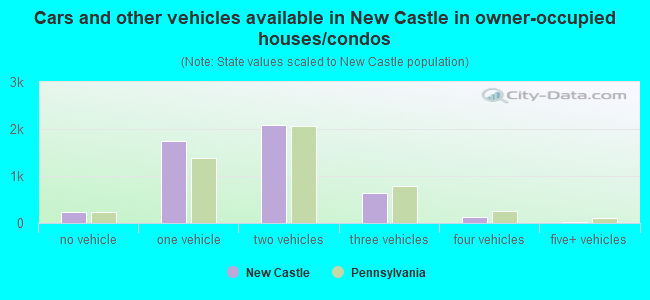
Vehicles available in owner-occupied houses - no vehicle available (%)
Vehicles available in owner-occupied houses - 1 vehicle available(%)
Vehicles available in owner-occupied houses - 2 Vehicles available (%)
Vehicles available in owner-occupied houses - 3 Vehicles available (%)
Vehicles available in owner-occupied houses - 4 Vehicles available (%)
Vehicles available in owner-occupied houses - 5+ Vehicles available (%)
Vehicles available in renter-occupied houses - no vehicle available (%)
Vehicles available in renter-occupied houses - 1 vehicle available (%)
Vehicles available in renter-occupied houses - 2 Vehicles available (%)
Vehicles available in renter-occupied houses - 3 Vehicles available (%)
Vehicles available in renter-occupied houses - 4 Vehicles available (%)
Vehicles available in renter-occupied houses - 5+ Vehicles available (%)
Housing units in structures - 1, detached (%)
Housing units in structures - 1, attached (%)
Housing units in structures - 2 (%)
Housing units in structures - 3 or 4 (%)
Housing units in structures - 5 to 9 (%)
Housing units in structures - 10 to 19 (%)
Housing units in structures - 20 to 49 (%)
Housing units in structures - 50 or more (%)
Housing units in structures - Mobile home (%)
Housing units in structures - Boat, RV, van, etc. (%)
Housing units in structures - Owners - 1, detached (%)
Housing units in structures - Owners - 1, attached (%)
Housing units in structures - Owners - 2 (%)
Housing units in structures - Owners - 3 or 4 (%)
Housing units in structures - Owners - 5 to 9 (%)
Housing units in structures - Owners - 10 to 19 (%)
Housing units in structures - Owners - 20 to 49 (%)
Housing units in structures - Owners - 50 or more (%)
Housing units in structures - Owners - Mobile home (%)
Housing units in structures - Owners - Boat, RV, van, etc. (%)
Housing units in structures - Renters - 1, detached (%)
Housing units in structures - Renters - 1, attached (%)
Housing units in structures - Renters - 2 (%)
Housing units in structures - Renters - 3 or 4 (%)
Housing units in structures - Renters - 5 to 9 (%)
Housing units in structures - Renters - 10 to 19 (%)
Housing units in structures - Renters - 20 to 49 (%)
Housing units in structures - Renters - 50 or more (%)
Housing units in structures - Renters - Mobile home (%)
Housing units in structures - Renters - Boat, RV, van, etc. (%)
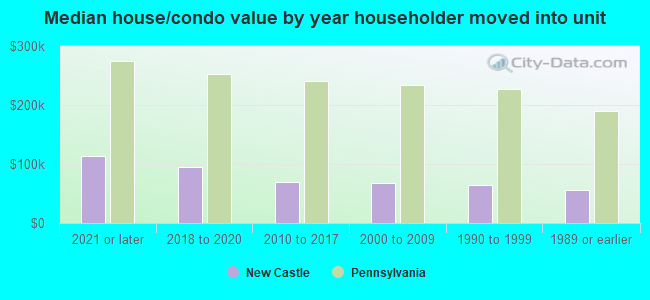
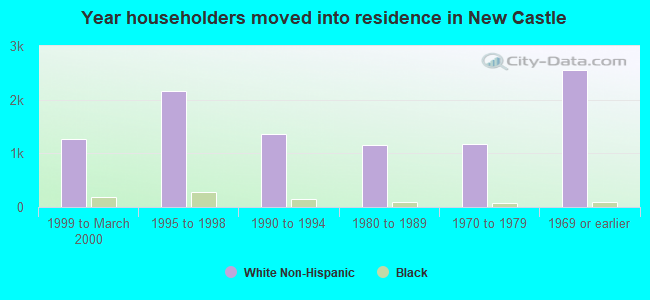
House/condo owner moved in on average (years ago)
Renter moved in on average (years ago)
Year householder moved into unit - Moved in 1999 to March 2000 (%)
Year householder moved into unit - Moved in 1999 to March 2000 (%) - White
Year householder moved into unit - Moved in 1999 to March 2000 (%) - Black or African American
Year householder moved into unit - Moved in 1999 to March 2000 (%) - Asian
Year householder moved into unit - Moved in 1999 to March 2000 (%) - Hispanic or Latino
Year householder moved into unit - Moved in 1999 to March 2000 (%) - American Indian and Alaska Native
Year householder moved into unit - Moved in 1999 to March 2000 (%) - Multirace
Year householder moved into unit - Moved in 1999 to March 2000 (%) - Other Race
Year householder moved into unit - Moved in 1995 to 1998 (%)
Year householder moved into unit - Moved in 1995 to 1998 (%) - White
Year householder moved into unit - Moved in 1995 to 1998 (%) - Black or African American
Year householder moved into unit - Moved in 1995 to 1998 (%) - Asian
Year householder moved into unit - Moved in 1995 to 1998 (%) - Hispanic or Latino
Year householder moved into unit - Moved in 1995 to 1998 (%) - American Indian and Alaska Native
Year householder moved into unit - Moved in 1995 to 1998 (%) - Multirace
Year householder moved into unit - Moved in 1995 to 1998 (%) - Other Race
Year householder moved into unit - Moved in 1990 to 1994 (%)
Year householder moved into unit - Moved in 1990 to 1994 (%) - White
Year householder moved into unit - Moved in 1990 to 1994 (%) - Black or African American
Year householder moved into unit - Moved in 1990 to 1994 (%) - Asian
Year householder moved into unit - Moved in 1990 to 1994 (%) - Hispanic or Latino
Year householder moved into unit - Moved in 1990 to 1994 (%) - American Indian and Alaska Native
Year householder moved into unit - Moved in 1990 to 1994 (%) - Multirace
Year householder moved into unit - Moved in 1990 to 1994 (%) - Other Race
Year householder moved into unit - Moved in 1980 to 1989 (%)
Year householder moved into unit - Moved in 1980 to 1989 (%) - White
Year householder moved into unit - Moved in 1980 to 1989 (%) - Black or African American
Year householder moved into unit - Moved in 1980 to 1989 (%) - Asian
Year householder moved into unit - Moved in 1980 to 1989 (%) - Hispanic or Latino
Year householder moved into unit - Moved in 1980 to 1989 (%) - American Indian and Alaska Native
Year householder moved into unit - Moved in 1980 to 1989 (%) - Multirace
Year householder moved into unit - Moved in 1980 to 1989 (%) - Other Race
Year householder moved into unit - Moved in 1970 to 1979 (%)
Year householder moved into unit - Moved in 1970 to 1979 (%) - White
Year householder moved into unit - Moved in 1970 to 1979 (%) - Black or African American
Year householder moved into unit - Moved in 1970 to 1979 (%) - Asian
Year householder moved into unit - Moved in 1970 to 1979 (%) - Hispanic or Latino
Year householder moved into unit - Moved in 1970 to 1979 (%) - American Indian and Alaska Native
Year householder moved into unit - Moved in 1970 to 1979 (%) - Multirace
Year householder moved into unit - Moved in 1970 to 1979 (%) - Other Race
Year householder moved into unit - Moved in 1969 or earlier (%)
Year householder moved into unit - Moved in 1969 or earlier (%) - White
Year householder moved into unit - Moved in 1969 or earlier (%) - Black or African American
Year householder moved into unit - Moved in 1969 or earlier (%) - Asian
Year householder moved into unit - Moved in 1969 or earlier (%) - Hispanic or Latino
Year householder moved into unit - Moved in 1969 or earlier (%) - American Indian and Alaska Native
Year householder moved into unit - Moved in 1969 or earlier (%) - Multirace
Year householder moved into unit - Moved in 1969 or earlier (%) - Other Race
Housing units lacking complete plumbing facilities (%)
Housing units lacking complete kitchen facilities (%)
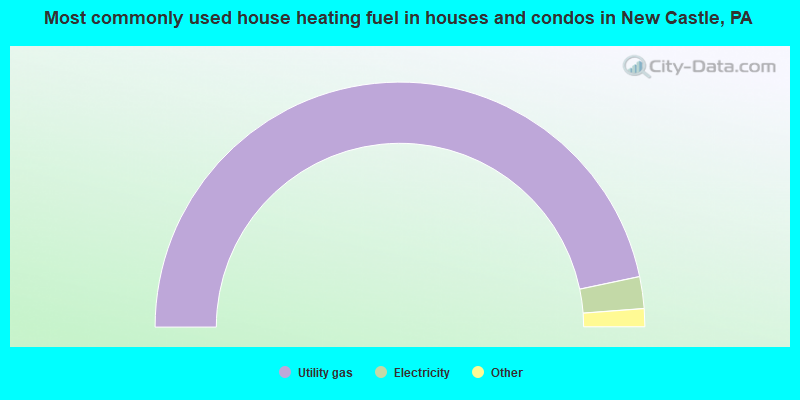
House heating fuel used in houses and condos - Utility gas (%)
House heating fuel used in houses and condos - Bottled, tank, or LP gas (%)
House heating fuel used in houses and condos - Electricity (%)
House heating fuel used in houses and condos - Fuel oil, kerosene, etc. (%)
House heating fuel used in houses and condos - Coal or coke (%)
House heating fuel used in houses and condos - Wood (%)
House heating fuel used in houses and condos - Solar energy (%)
House heating fuel used in houses and condos - Other fuel (%)
House heating fuel used in houses and condos - No fuel used (%)
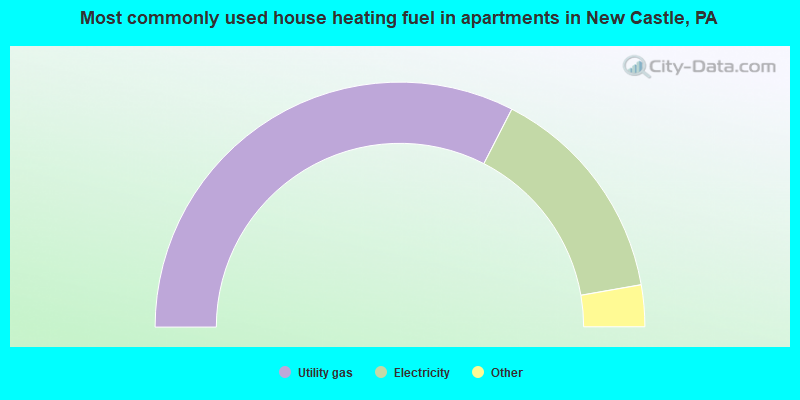
House heating fuel used in apartments - Utility gas (%)
House heating fuel used in apartments - Bottled, tank, or LP gas (%)
House heating fuel used in apartments - Electricity (%)
House heating fuel used in apartments - Fuel oil, kerosene, etc. (%)
House heating fuel used in apartments - Coal or coke (%)
House heating fuel used in apartments - Wood (%)
House heating fuel used in apartments - Solar energy (%)
House heating fuel used in apartments - Other fuel (%)
House heating fuel used in apartments - No fuel used (%)
Median year house/condo built: 1937Median year apartment built: 1958Household type by relationship:
Households: 21,593
Male householders: 3,861 (1,587 living alone ), Female householders: 5,170 (1,945 living alone )2,767 spouses (2,756 opposite-sex spouses ), 919 unmarried partners , (918 opposite-sex unmarried partners ), 6,389 children (5,802 natural , 365 adopted , 221 stepchildren ), 646 grandchildren , 88 brothers or sisters , 260 parents , 0 foster children , 213 other relatives , 498 non-relatives In group quarters: 776
Size of family households: 2,168 2-persons , 1,006 3-persons , 992 4-persons , 299 5-persons , 290 6-persons , 209 7-or-more-persons .
Size of nonfamily households: 3,759 1-person , 321 2-persons , 91 3-persons , 15 4-persons , 16 5-persons .
1,585 married couples with children. single-parent households (967 men , 2,119 women ).
94.6% of residents of New Castle speak English at home. of residents speak Spanish at home (64% speak English very well , 18% speak English well , 12% speak English not well , 6% don't speak English at all ).of residents speak other Indo-European language at home (49% speak English very well , 24% speak English well , 27% speak English not well ).of residents speak Asian or Pacific Island language at home (100% speak English very well ).of residents speak other language at home (100% speak English very well ).
Foreign born population: 288 (1.3%)of them are naturalized citizens )
Median number of rooms in houses and condos:
Median number of rooms in apartments
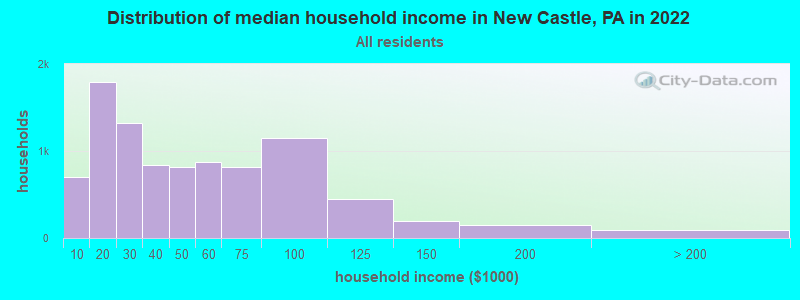
New Castle, PA household income distribution 705 Less than $10,0001,795 $10,000 to $19,9991,321 $20,000 to $29,999842 $30,000 to $39,999816 $40,000 to $49,999870 $50,000 to $59,999811 $60,000 to $74,9991,151 $75,000 to $99,999451 $100,000 to $124,999195 $125,000 to $149,999154 $150,000 to $199,99991 $200,000 or more
Home value of owner - occupied houses in 2022 in New Castle, PA 58 Less than $10,00043 $10,000 to $14,99922 $15,000 to $19,999208 $20,000 to $24,999153 $25,000 to $29,999106 $30,000 to $34,999296 $35,000 to $39,999788 $40,000 to $49,999644 $50,000 to $59,999499 $60,000 to $69,999577 $70,000 to $79,999521 $80,000 to $89,999225 $90,000 to $99,999296 $100,000 to $124,999137 $125,000 to $149,999183 $150,000 to $174,999203 $175,000 to $199,99982 $200,000 to $249,99973 $250,000 to $299,99913 $300,000 to $399,99936 $400,000 to $499,9996 $500,000 to $749,9997 $2,000,000 or moreRent paid by renters in 2022 in New Castle, PA 319 Less than $10053 $100 to $14968 $150 to $199347 $200 to $249137 $250 to $299327 $300 to $349244 $350 to $399298 $400 to $449120 $450 to $499544 $500 to $549199 $550 to $599448 $600 to $649299 $650 to $699228 $700 to $749239 $750 to $799261 $800 to $89983 $900 to $99980 $1,000 to $1,24920 $1,250 to $1,49923 $2,000 to $2,49924 $3,000 to $3,499252 No cash rent
Percentage of workers working in this county: 74.8%Number of people working at home: 697 (9.0% of all workers )
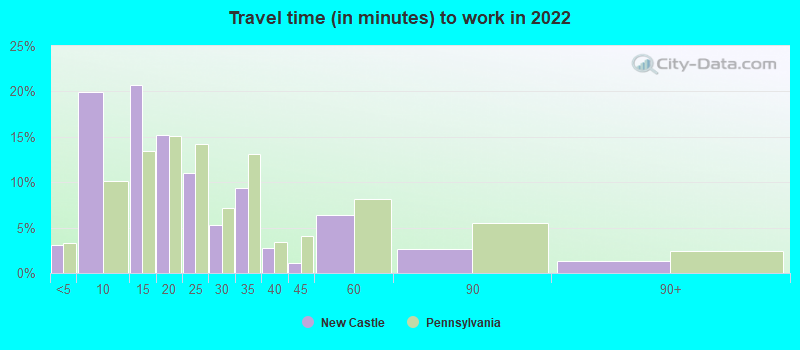
Travel time to work (commute)
Less than 5 minutes: 3925 to 9 minutes: 1,51310 to 14 minutes: 1,32815 to 19 minutes: 89520 to 24 minutes: 25325 to 29 minutes: 25830 to 34 minutes: 68435 to 39 minutes: 18740 to 44 minutes: 11845 to 59 minutes: 58560 to 89 minutes: 45190 or more minutes: 54
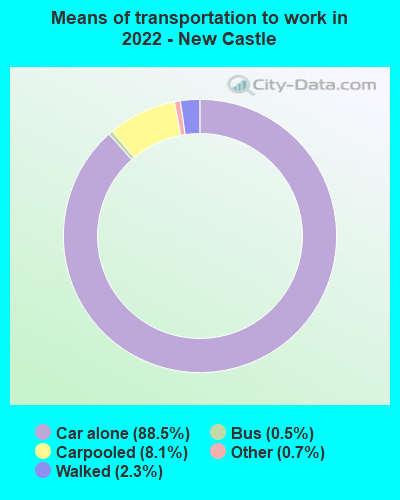
Means of transportation to work:
Drove a car alone: 7,834 (80.8%)Carpooled: 713 (7.4%)Bus : 32 (0.3%)Taxi: 68 (0.7%)Bicycle: 6 (0.1%)Walked: 201 (2.1%)Worked at home: 697 (7.2%)
Unemployment by race in 2022
Unemployment rate for White non-Hispanic residents 12.6% Males12.8% FemalesUnemployment rate for Black residents 27.0% Males15.3% FemalesUnemployment rate for two or more race residents 30.4% Males17.7% FemalesUnemployment rate for Hispanic or Latino residents 49.0% Males11.8% Females
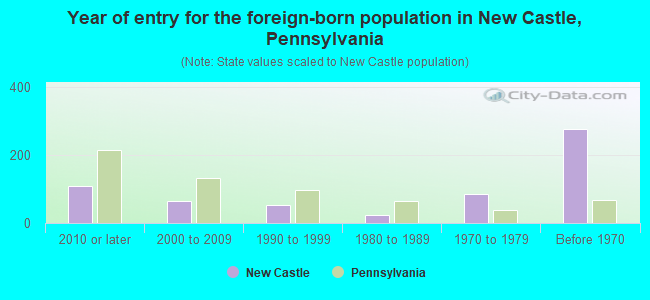
Year of entry for the foreign-born population in New Castle, Pennsylvania
110 2010 or later 66 2000 to 2009 54 1990 to 1999 25 1980 to 1989 84 1970 to 1979 277 Before 1970
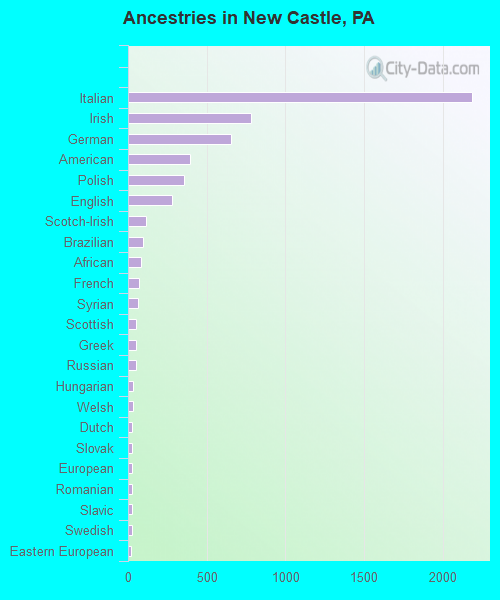
First ancestries reported:
Italian: 2,186 (25.6%)
Irish: 780 (9.1%)
German: 655 (7.7%)
American: 393 (4.6%)
Polish: 359 (4.2%)
English: 277 (3.2%)
Scotch-Irish: 113 (1.3%)
Brazilian: 94 (1.1%)
African: 84 (1.0%)
French: 67 (0.8%)
Syrian: 62 (0.7%)
Scottish: 53 (0.6%)
Greek: 51 (0.6%)
Russian: 50 (0.6%)
Hungarian: 31 (0.4%)
Welsh: 29 (0.3%)
Dutch: 27 (0.3%)
Slovak: 27 (0.3%)
European: 26 (0.3%)
Romanian: 24 (0.3%)
Slavic: 24 (0.3%)
Swedish: 24 (0.3%)
Eastern European: 20 (0.2%)
Bahamian: 19 (0.2%)
Finnish: 18 (0.2%)
Croatian: 14 (0.2%)
French Canadian: 10 (0.1%)
Ukrainian: 8 (0.09%)
British: 7 (0.08%)
Northern European: 6 (0.07%)
Slovene: 4 (0.05%) Most common places of birth for foreign-born residents (%): Brazil New Castle:
34.3% (120)Pennsylvania:
1.4% (13,077)
Dominican Republic New Castle:
15.4% (54)Pennsylvania:
9.2% (86,544)
Italy New Castle:
13.7% (48)Pennsylvania:
1.8% (16,884)
Mexico New Castle:
9.4% (33)Pennsylvania:
5.8% (54,190)
Bahamas New Castle:
7.1% (25)Pennsylvania:
0.1% (564)
Honduras New Castle:
4.6% (16)Pennsylvania:
0.9% (8,463)
England New Castle:
3.4% (12)Pennsylvania:
1.0% (9,205)
Greece New Castle:
3.4% (12)Pennsylvania:
0.6% (5,438)
Germany New Castle:
2.9% (10)Pennsylvania:
1.9% (18,065)
Cuba New Castle:
2.3% (8)Pennsylvania:
0.6% (6,036)
Place of birth for U.S.-born residents:
This state: 17,045Other state: 3,955Northeast: 333Midwest: 1,577South: 1,559West: 356 82.4% of New Castle residents lived in the same house 1 years ago.
Out of people who lived in different houses, 34.8% lived in this county.
Out of people who lived in different counties, 45.4% lived in Pennsylvania.
New Castle:
82.4%State average:
89.3%
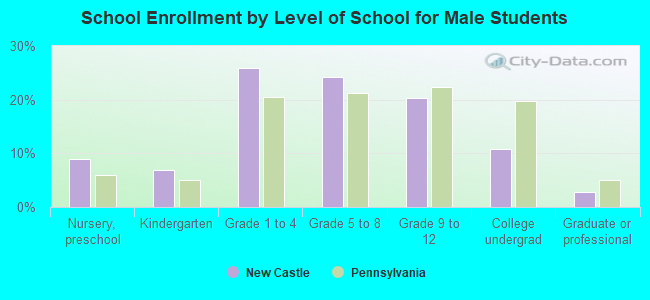
Education attainment for males 25 years and older:
No schooling: 168Nursery to 4th grade: 05th and 6th grade: 157th and 8th grade: 1399th grade: 3710th grade: 9411th grade: 29912th grade, no diploma: 255High school graduate (or equivalency): 2,916Less than 1 year of college: 446Some college more than 1 year, no degree: 693Associate degree: 514Bachelor's degree: 846Master's degree: 271Professional school degree: 39Doctorate degree: 16
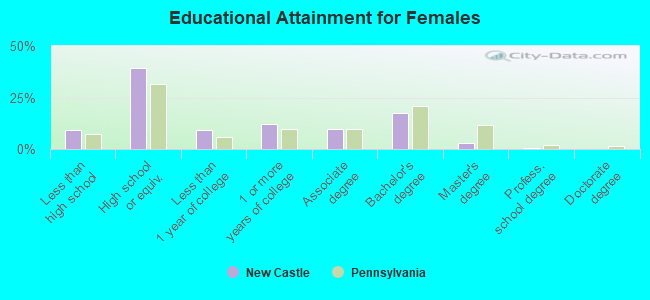
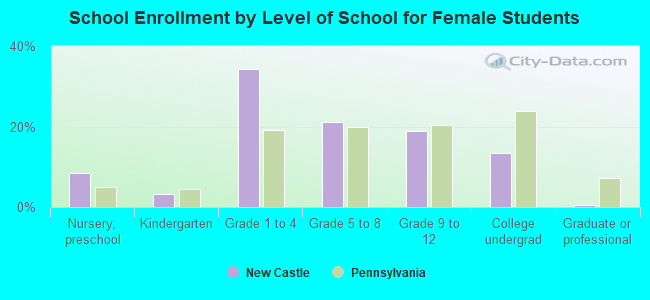
Education attainment for females 25 years and older:
No schooling: 61Nursery to 4th grade: 105th and 6th grade: 87th and 8th grade: 259th grade: 20210th grade: 8911th grade: 15112th grade, no diploma: 180High school graduate (or equivalency): 3,123Less than 1 year of college: 750Some college more than 1 year, no degree: 962Associate degree: 789Bachelor's degree: 1,378Master's degree: 224Professional school degree: 24Doctorate degree: 1
Housing units in structures:
One, detached: 7,495One, attached: 407Two: 4883 or 4: 5165 to 9: 59410 to 19: 16620 to 49: 23150 or more: 608Mobile homes: 78Housing units lacking complete plumbing facilities in 2022: 5.7%Housing units lacking complete kitchen facilities in 2022: 7.3%House/condo owner moved in on average 15 years ago
Renter moved in on average 3 years ago
Private vs. public school enrollment:
Students in private schools in grades 1 to 8 (elementary and middle school): 256 Here:
9.5%Pennsylvania:
15.7%
Students in private schools in grades 9 to 12 (high school): 99 Here:
10.1%Pennsylvania:
13.4%
Students in private undergraduate colleges: 56 Here:
8.5%Pennsylvania:
39.8%