New Haven, CT (Connecticut) Houses and Residents
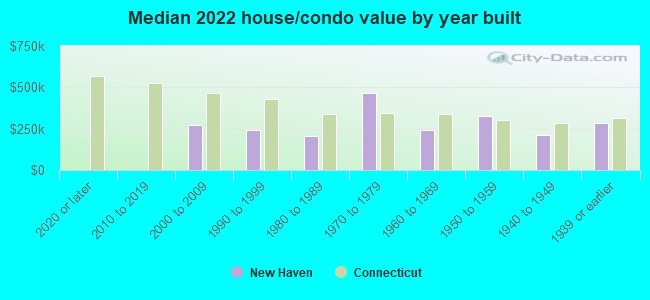
| New Haven: | $266,900 |
| Connecticut: | $347,200 |
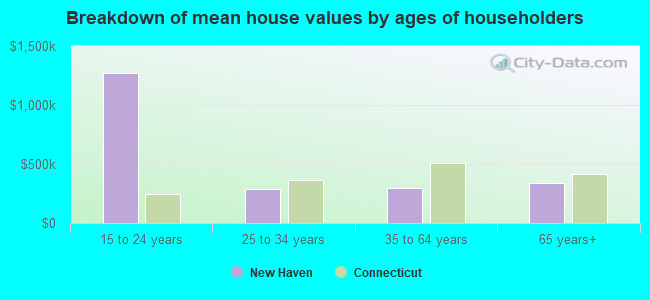
Mean price in 2022:
Detached houses: $351,024
Here: $351,024 State: $503,946 Townhouses or other attached units: $276,965
Here: $276,965 State: $304,959 In 2-unit structures: $299,514
Here: $299,514 State: $304,133 In 3-to-4-unit structures: $261,603
Here: $261,603 State: $272,970 In 5-or-more-unit structures: $226,280
Here: $226,280 State: $249,308 Mobile homes: $863,787
Here: $863,787 State: $151,361
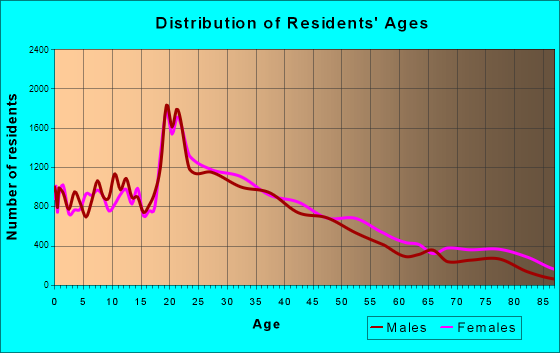
Total population: 130,282 (Urban population: 123,626, Rural population: 0)
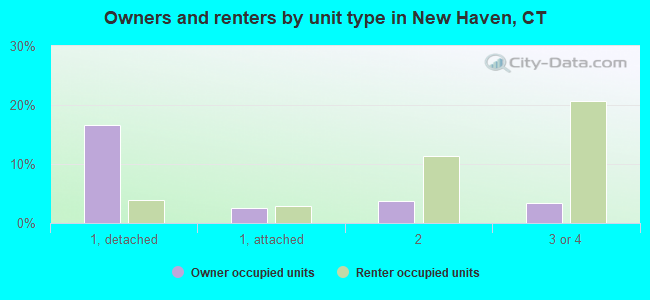
Houses: 61,782 (56,174 occupied: 16,036 owner occupied, 40,138 renter occupied)
| % of renters here: | 71% |
| State: | 34% |
Housing density: 3,278 houses/condos per square mile
Median price asked for vacant for-sale houses and condos in 2022: $441,499.
Median contract rent in 2022: $1,214 (lower quartile is $879, upper quartile is $1,574)
Median rent asked for vacant for-rent units in 2022: $1,358
Median gross rent in New Haven, CT in 2022: $1,441
Housing units in New Haven with a mortgage: 10,163 (1,242 second mortgage, 56 home equity loan, 1,028 both second mortgage and home equity loan)
Houses without a mortgage: 0
Median household income for houses/condos with a mortgage: $133,554
Median household income for apartments without a mortgage: $112,081
Median monthly housing costs: $1,509
Compare current foreclosures in New Haven, CT:
| Photo | Address | Area | Beds / Baths | Price | Details |
|---|---|---|---|---|---|

|
#1
Howard Ave
New Haven, CT 06519
|
2,418 sq. feet
|
3 baths 4 beds |
show details | |

|
#2
Roydon Rd
New Haven, CT 06511
|
2,392 sq. feet
|
2 baths 4 beds |
show details | |

|
#3
Crest Ave # 1
New Haven, CT 06513
|
3,044 sq. feet
|
3 baths 5 beds |
show details | |

|
#4
Florence St
New Haven, CT 06513
|
1,700 sq. feet
|
1 baths 3 beds |
show details | |

|
#5
Emily Rd
New Haven, CT 06513
|
720 sq. feet
|
1 baths 1 beds |
show details | |

|
#6
Elizabeth St
New Haven, CT 06511
|
2,895 sq. feet
|
2 baths 6 beds |
show details | |

|
#7
Thompson St Apt 11d
New Haven, CT 06513
|
1,210 sq. feet
|
1 baths 2 beds |
show details | |

|
#8
Hobart St
New Haven, CT 06511
|
1,926 sq. feet
|
1 baths 3 beds |
show details | |

|
#9
Osborn Ave
New Haven, CT 06511
|
2,364 sq. feet
|
1 baths 3 beds |
show details | |

|
#10
Winthrop Ave
New Haven, CT 06511
|
3,247 sq. feet
|
3 baths 5 beds |
show details |
| Photo | Address | Area | Beds / Baths | Price | Details |
|---|---|---|---|---|---|

|
#11
Portsea St
New Haven, CT 06519
|
2,073 sq. feet
|
2 baths 3 beds |
show details | |

|
#12
Short Beach Rd
New Haven, CT 06512
|
1,280 sq. feet
|
1 baths 2 beds |
show details | |

|
#13
Laura Cir
New Haven, CT 06513
|
1,960 sq. feet
|
2 baths 4 beds |
show details | |

|
#14
Quinnipiac Ave
New Haven, CT 06513
|
1,124 sq. feet
|
2 baths 2 beds |
show details | |

|
#15
Frances Hunter Dr
New Haven, CT 06511
|
1,344 sq. feet
|
2 baths 3 beds |
show details | |

|
#16
1st Ave
New Haven, CT 06513
|
1,990 sq. feet
|
2 baths 3 beds |
show details | |

|
#17
Seneca Rd
New Haven, CT 06515
|
1,212 sq. feet
|
1 baths 3 beds |
show details | |

|
#18
Whittier Rd
New Haven, CT 06515
|
2,820 sq. feet
|
3 baths 4 beds |
show details | |

|
#19
Bellevue Rd
New Haven, CT 06511
|
1,640 sq. feet
|
1 baths 3 beds |
show details | |

|
#20
Colony Rd
New Haven, CT 06511
|
1,937 sq. feet
|
2 baths 3 beds |
show details |
| Photo | Address | Area | Beds / Baths | Price | Details |
|---|---|---|---|---|---|

|
#21
Redfield St
New Haven, CT 06519
|
1,279 sq. feet
|
1 baths 4 beds |
show details | |

|
#22
Hall St
New Haven, CT 06512
|
1,372 sq. feet
|
1 baths 3 beds |
show details | |

|
#23
Ellsworth Ave
New Haven, CT 06511
|
4,456 sq. feet
|
3 baths 7 beds |
show details | |

|
#24
Sherman Ave # 1
New Haven, CT 06511
|
3,972 sq. feet
|
3 baths 6 beds |
show details | |

|
#25
Frederick St
New Haven, CT 06515
|
988 sq. feet
|
1 baths 3 beds |
show details | |

|
#26
Fitch St
New Haven, CT 06515
|
2,340 sq. feet
|
4 baths 8 beds |
show details | |

|
#27
Crescent St
New Haven, CT 06511
|
1,440 sq. feet
|
1 baths 3 beds |
show details | |

|
#28
1st Ave
New Haven, CT 06513
|
1,328 sq. feet
|
1 baths 3 beds |
show details | |

|
#29
Batter Ter
New Haven, CT 06511
|
4,853 sq. feet
|
5 baths 9 beds |
show details | |

|
#30
S End Rd
New Haven, CT Array
|
984 sq. feet
|
1 baths 3 beds |
show details |
| Photo | Address | Area | Beds / Baths | Price | Details |
|---|---|---|---|---|---|

|
#31
N Bank St
New Haven, CT 06511
|
2,117 sq. feet
|
2 baths 3 beds |
show details | |

|
#32
Crest Ave
New Haven, CT 06513
|
1,248 sq. feet
|
1 baths 2 beds |
show details | |

|
#33
Ruby St
New Haven, CT 06515
|
2,306 sq. feet
|
2 baths 3 beds |
show details | |

|
#34
Fountain Ter
New Haven, CT 06515
|
960 sq. feet
|
1 baths 3 beds |
show details | |

|
#35
Brooklawn Cir
New Haven, CT 06515
|
1,344 sq. feet
|
1 baths 3 beds |
show details | |

|
#36
Ashmun St
New Haven, CT 06511
|
1,210 sq. feet
|
1 baths 3 beds |
show details | |

|
#37
Palmieri Ave
New Haven, CT 06513
|
2,855 sq. feet
|
2 baths 4 beds |
show details | |

|
#38
Valley Pl N
New Haven, CT 06515
|
816 sq. feet
|
1 baths 3 beds |
show details | |

|
#39
Diamond St
New Haven, CT 06515
|
1,846 sq. feet
|
1 baths 3 beds |
show details | |

|
#40
Spencer Pl
New Haven, CT 06515
|
1,961 sq. feet
|
2 baths 3 beds |
show details |
| Photo | Address | Area | Beds / Baths | Price | Details |
|---|---|---|---|---|---|

|
#41
Houston St
New Haven, CT 06513
|
1,798 sq. feet
|
3 baths 3 beds |
show details | |

|
#42
Hubinger St # 3
New Haven, CT 06511
|
3,826 sq. feet
|
2 baths 5 beds |
show details | |

|
#43
Whalley Ave Unit 1e
New Haven, CT 06515
|
1,190 sq. feet
|
2 baths 2 beds |
show details | |

|
#44
S Dale St
New Haven, CT 06513
|
1,868 sq. feet
|
2 baths 2 beds |
show details | |

|
#45
Pequot St
New Haven, CT 06513
|
1,298 sq. feet
|
1 baths 3 beds |
show details | |

|
#46
Mead St
New Haven, CT 06511
|
3,085 sq. feet
|
3 baths 5 beds |
show details | |

|
#47
Highland Ave
New Haven, CT 06513
|
1,954 sq. feet
|
2 baths 6 beds |
show details | |

|
#48
Dorman St
New Haven, CT 06511
|
1,958 sq. feet
|
2 baths 5 beds |
show details | |

|
#49
Beacon St
New Haven, CT 06514
|
2,039 sq. feet
|
1 baths 5 beds |
show details | |

|
Check over 1 million property listings on Foreclosure.com!
|
browse all offers | |||


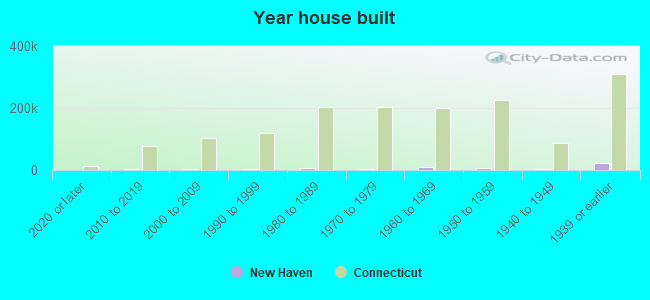
Median year apartment built: 1959
Household type by relationship:
Households: 138,909- Male householders: 24,855 (12,580 living alone), Female householders: 31,319 (10,816 living alone)
13,118 spouses (13,052 opposite-sex spouses), 3,992 unmarried partners, (3,565 opposite-sex unmarried partners), 38,635 children (37,779 natural, 78 adopted, 778 stepchildren), 3,423 grandchildren, 1,266 brothers or sisters, 1,383 parents, 0 foster children, 1,951 other relatives, 6,875 non-relatives
- In group quarters: 12,092
Size of family households: 10,006 2-persons, 7,111 3-persons, 6,316 4-persons, 1,827 5-persons, 599 6-persons, 623 7-or-more-persons.
Size of nonfamily households: 23,396 1-person, 4,913 2-persons, 719 3-persons, 483 4-persons, 181 6-persons.
10,209 married couples with children.
16,583 single-parent households (2,888 men, 13,695 women).
65.8% of residents of New Haven speak English at home.
24.6% of residents speak Spanish at home (59% speak English very well, 16% speak English well, 16% speak English not well, 9% don't speak English at all).
5.2% of residents speak other Indo-European language at home (69% speak English very well, 16% speak English well, 9% speak English not well, 6% don't speak English at all).
2.7% of residents speak Asian or Pacific Island language at home (63% speak English very well, 30% speak English well, 7% speak English not well).
1.8% of residents speak other language at home (67% speak English very well, 10% speak English well, 20% speak English not well, 3% don't speak English at all).
Foreign born population: 24,140 (17.4%)
(36.5% of them are naturalized citizens)
| Here: | 5.6 |
| State: | 6.5 |
| Here: | 4.1 |
| State: | 4.0 |
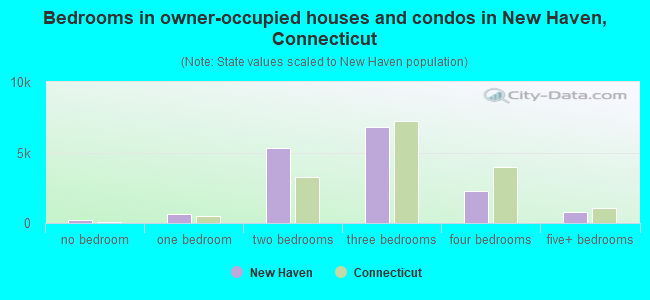
- Bedrooms in owner-occupied houses and condos in New Haven, Connecticut
- 248no bedroom
- 6251 bedroom
- 5,2982 bedrooms
- 6,7793 bedrooms
- 2,2904 bedrooms
- 7965+ bedrooms
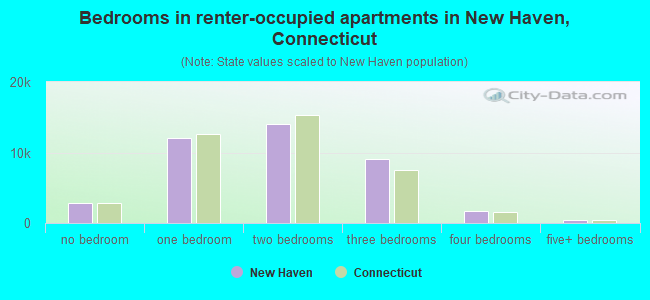
- Bedrooms in renter-occupied apartments in New Haven, Connecticut
- 2,798no bedroom
- 11,9911 bedroom
- 14,0722 bedrooms
- 9,0753 bedrooms
- 1,7404 bedrooms
- 4625+ bedrooms
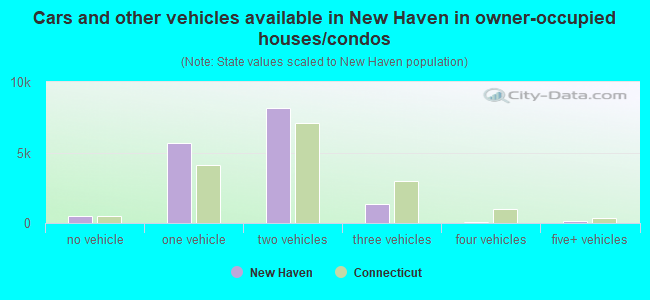
- Cars and other vehicles available in New Haven in owner-occupied houses/condos
- 509no vehicle
- 5,7091 vehicle
- 8,1882 vehicles
- 1,3723 vehicles
- 994 vehicles
- 1595+ vehicles
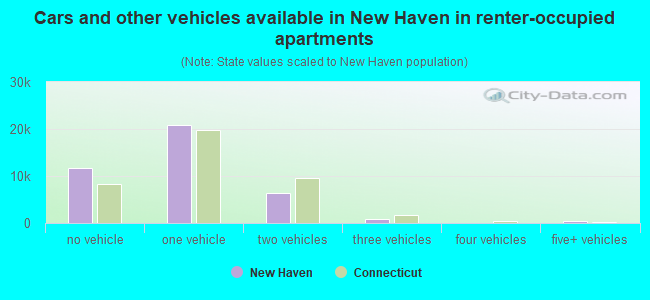
- Cars and other vehicles available in New Haven in renter-occupied apartments
- 11,681no vehicle
- 20,8451 vehicle
- 6,3292 vehicles
- 9273 vehicles
- 04 vehicles
- 3565+ vehicles
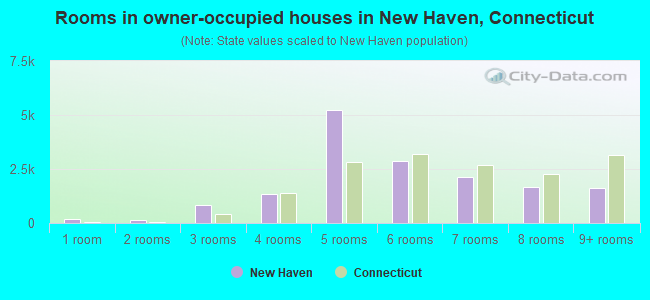
- Rooms in owner-occupied houses in New Haven, Connecticut
- 1911 room
- 1452 rooms
- 8273 rooms
- 1,3514 rooms
- 5,2495 rooms
- 2,8646 rooms
- 2,1157 rooms
- 1,6778 rooms
- 1,6179+ rooms
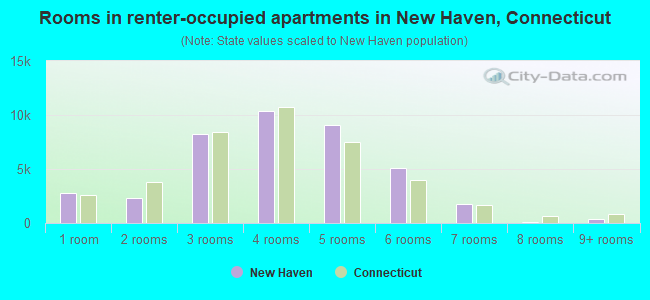
- Rooms in renter-occupied apartments in New Haven, Connecticut
- 2,7461 room
- 2,3532 rooms
- 8,2753 rooms
- 10,3384 rooms
- 9,0865 rooms
- 5,0666 rooms
- 1,8007 rooms
- 1258 rooms
- 3499+ rooms
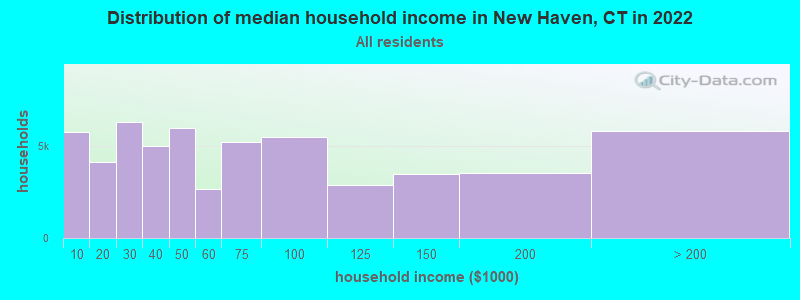
New Haven, CT household income distribution

- 5,730Less than $10,000
- 4,123$10,000 to $19,999
- 6,291$20,000 to $29,999
- 5,006$30,000 to $39,999
- 5,968$40,000 to $49,999
- 2,674$50,000 to $59,999
- 5,228$60,000 to $74,999
- 5,463$75,000 to $99,999
- 2,894$100,000 to $124,999
- 3,446$125,000 to $149,999
- 3,529$150,000 to $199,999
- 5,822$200,000 or more
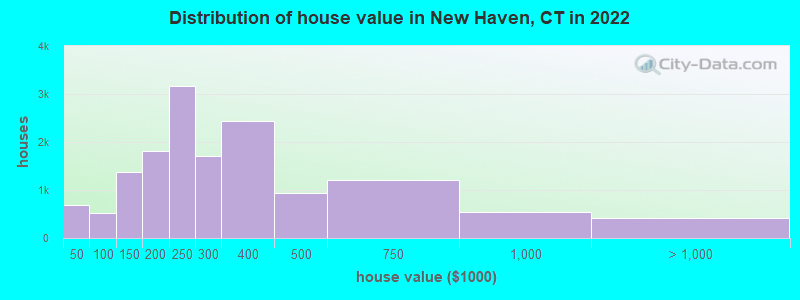
Home value of owner - occupied houses in 2022 in New Haven, CT
-
- 395Less than $10,000
- 55$10,000 to $14,999
- 26$15,000 to $19,999
- 86$20,000 to $24,999
- 21$25,000 to $29,999
- 13$30,000 to $34,999
- 91$40,000 to $49,999
- 42$50,000 to $59,999
- 63$60,000 to $69,999
- 81$70,000 to $79,999
- 142$80,000 to $89,999
- 97$90,000 to $99,999
- 1,088$100,000 to $124,999
- 278$125,000 to $149,999
- 958$150,000 to $174,999
- 855$175,000 to $199,999
- 3,166$200,000 to $249,999
- 1,702$250,000 to $299,999
- 2,441$300,000 to $399,999
- 937$400,000 to $499,999
- 1,200$500,000 to $749,999
- 532$750,000 to $999,999
- 213$1,000,000 to $1,499,999
- 91$1,500,000 to $1,999,999
- 114$2,000,000 or more
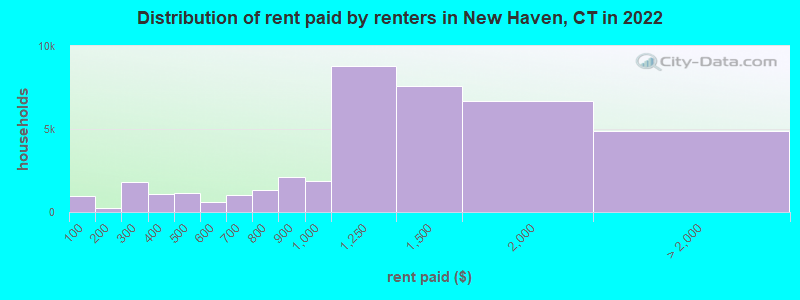
Rent paid by renters in 2022 in New Haven, CT
-
- 960Less than $100
- 263$100 to $149
- 1,639$200 to $249
- 178$250 to $299
- 431$300 to $349
- 664$350 to $399
- 632$400 to $449
- 492$450 to $499
- 375$500 to $549
- 207$550 to $599
- 694$600 to $649
- 314$650 to $699
- 681$700 to $749
- 637$750 to $799
- 2,125$800 to $899
- 1,849$900 to $999
- 8,792$1,000 to $1,249
- 7,599$1,250 to $1,499
- 6,709$1,500 to $1,999
- 2,388$2,000 to $2,499
- 786$2,500 to $2,999
- 383$3,000 to $3,499
- 562$3,500 or more
- 778No cash rent
Percentage of workers working in this county: 85.8%
Number of people working at home: 9,886 (15.1% of all workers)
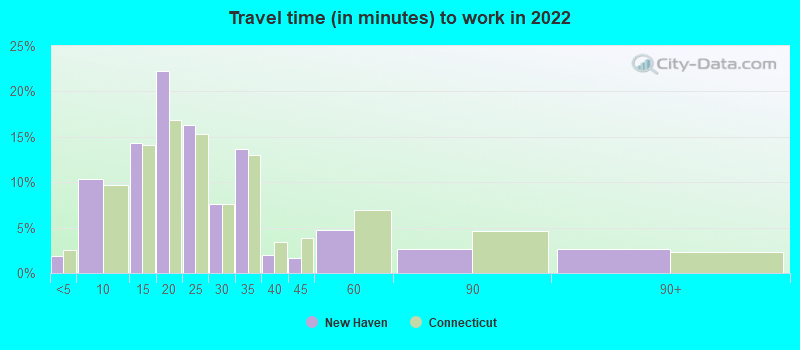
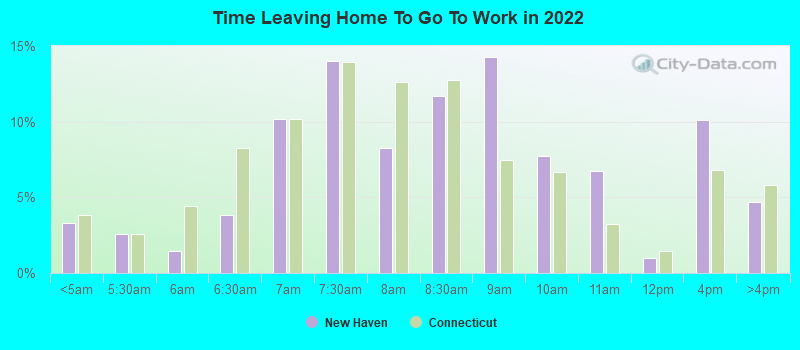
Travel time to work (commute)
- Less than 5 minutes: 1,357
- 5 to 9 minutes: 7,368
- 10 to 14 minutes: 9,679
- 15 to 19 minutes: 14,561
- 20 to 24 minutes: 7,859
- 25 to 29 minutes: 2,659
- 30 to 34 minutes: 5,976
- 35 to 39 minutes: 1,162
- 40 to 44 minutes: 667
- 45 to 59 minutes: 2,671
- 60 to 89 minutes: 1,535
- 90 or more minutes: 229
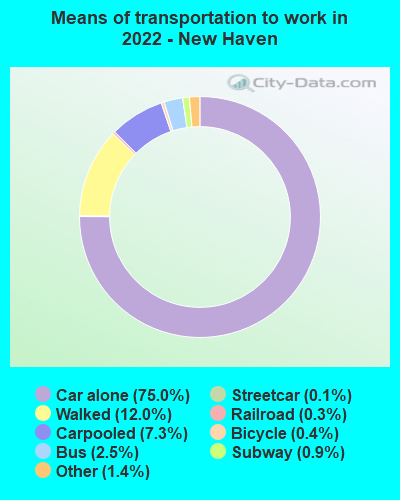
Means of transportation to work:
- Drove a car alone: 65,554 (67.4%)
- Carpooled: 6,373 (6.6%)
- Bus: 2,144 (2.2%)
- Subway or elevated rail: 113 (0.1%)
- Long-distance train or commuter rail: 780 (0.8%)
- Light rail, streetcar or trolley: 291 (0.3%)
- Taxi: 1,256 (1.3%)
- Bicycle: 379 (0.4%)
- Walked: 10,482 (10.8%)
- Worked at home: 9,886 (10.2%)
- Unemployment by race in 2022
- Unemployment rate for White non-Hispanic residents
- 4.4%Males
- 2.0%Females
- Unemployment rate for Black residents
- 15.0%Males
- 4.1%Females
- Unemployment rate for Asian residents
- 1.9%Males
- 4.1%Females
- Unemployment rate for other race residents
- 8.0%Males
- 11.6%Females
- Unemployment rate for two or more race residents
- 16.8%Males
- 1.4%Females
- Unemployment rate for Hispanic or Latino residents
- 9.8%Males
- 5.5%Females
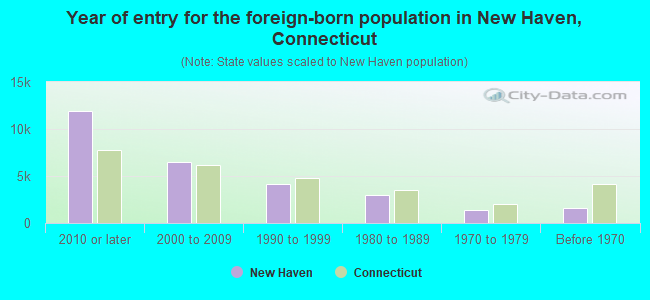
- Year of entry for the foreign-born population in New Haven, Connecticut
- 11,9012010 or later
- 6,4602000 to 2009
- 4,1791990 to 1999
- 2,9391980 to 1989
- 1,4291970 to 1979
- 1,620Before 1970
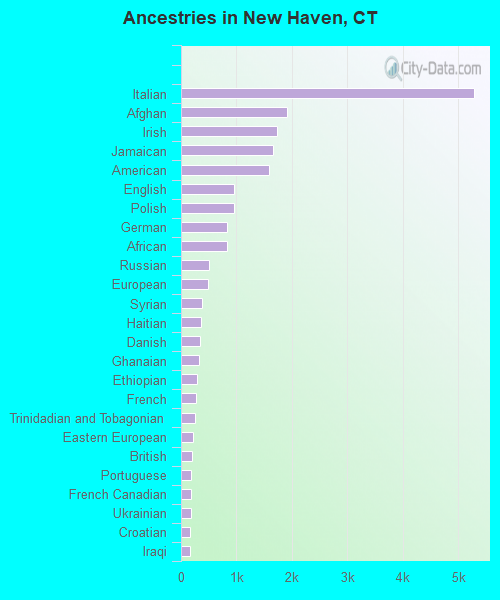
First ancestries reported:
- Italian: 5,287 (6.4%)
- Afghan: 1,914 (2.3%)
- Irish: 1,728 (2.1%)
- Jamaican: 1,667 (2.0%)
- American: 1,591 (1.9%)
- English: 958 (1.2%)
- Polish: 948 (1.1%)
- German: 829 (1.0%)
- African: 828 (1.0%)
- Russian: 509 (0.6%)
- European: 483 (0.6%)
- Syrian: 376 (0.5%)
- Haitian: 356 (0.4%)
- Danish: 339 (0.4%)
- Ghanaian: 316 (0.4%)
- Ethiopian: 290 (0.4%)
- French: 274 (0.3%)
- Trinidadian and Tobagonian: 249 (0.3%)
- Eastern European: 221 (0.3%)
- British: 197 (0.2%)
- Portuguese: 188 (0.2%)
- French Canadian: 180 (0.2%)
- Ukrainian: 174 (0.2%)
- Croatian: 169 (0.2%)
- Iraqi: 163 (0.2%)
- Arab: 153 (0.2%)
- Guyanese: 142 (0.2%)
- Scottish: 134 (0.2%)
- Dutch: 127 (0.2%)
- Nigerian: 126 (0.2%)
- Canadian: 117 (0.1%)
- Brazilian: 115 (0.1%)
- Cape Verdean: 107 (0.1%)
- Greek: 106 (0.1%)
- Norwegian: 104 (0.1%)
- Hungarian: 98 (0.1%)
- Slovak: 96 (0.1%)
- British West Indian: 95 (0.1%)
- Swedish: 84 (0.1%)
- Moroccan: 75 (0.09%)
- Serbian: 74 (0.09%)
- Scotch-Irish: 69 (0.08%)
- Kenyan: 62 (0.08%)
- Latvian: 60 (0.07%)
- Israeli: 59 (0.07%)
- South African: 59 (0.07%)
- Czech: 57 (0.07%)
- Zimbabwean: 53 (0.06%)
- Egyptian: 48 (0.06%)
- Lithuanian: 43 (0.05%)
- Lebanese: 43 (0.05%)
- Austrian: 43 (0.05%)
- Swiss: 40 (0.05%)
- Iranian: 39 (0.05%)
- Northern European: 38 (0.05%)
- Turkish: 34 (0.04%)
- Liberian: 34 (0.04%)
- Yugoslavian: 34 (0.04%)
- West Indian: 33 (0.04%)
- Scandinavian: 28 (0.03%)
- Welsh: 28 (0.03%)
- Finnish: 27 (0.03%)
- Slavic: 22 (0.03%)
- Pennsylvania German: 20 (0.02%)
- Armenian: 20 (0.02%)
- Romanian: 19 (0.02%)
- Albanian: 19 (0.02%)
- Palestinian: 17 (0.02%)
- Jordanian: 10 (0.01%)
- Australian: 9 (0.01%)
- Sudanese: 8 (0.01%)
- U.S. Virgin Islander: 7 (0.01%)
Most common places of birth for foreign-born residents (%):
| New Haven: | 14.7% (3,648) |
| Connecticut: | 4.8% (25,802) |
| New Haven: | 8.9% (2,222) |
| Connecticut: | 0.4% (1,946) |
| New Haven: | 7.4% (1,829) |
| Connecticut: | 7.5% (40,568) |
| New Haven: | 7.0% (1,739) |
| Connecticut: | 4.4% (24,001) |
| New Haven: | 6.1% (1,527) |
| Connecticut: | 4.4% (24,026) |
| New Haven: | 5.7% (1,409) |
| Connecticut: | 3.2% (17,617) |
| New Haven: | 3.5% (877) |
| Connecticut: | 5.0% (27,361) |
| New Haven: | 2.9% (729) |
| Connecticut: | 3.3% (18,124) |
| New Haven: | 2.4% (601) |
| Connecticut: | 1.2% (6,448) |
| New Haven: | 2.4% (597) |
| Connecticut: | 7.3% (39,879) |
| New Haven: | 2.2% (547) |
| Connecticut: | 2.3% (12,380) |
| New Haven: | 2.2% (547) |
| Connecticut: | 1.4% (7,495) |
| New Haven: | 1.5% (378) |
| Connecticut: | 0.6% (3,109) |
Place of birth for U.S.-born residents:
- This state: 63,654
- Other state: 41,991
- Northeast: 22,191
- Midwest: 6,763
- South: 9,075
- West: 3,962
84.1% of New Haven residents lived in the same house 1 years ago.
Out of people who lived in different houses, 26.1% lived in this county.
Out of people who lived in different counties, 12.6% lived in Connecticut.
| New Haven: | 84.1% |
| State average: | 88.4% |
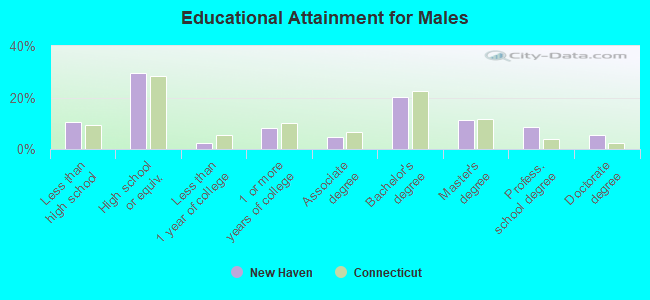
Education attainment for males 25 years and older:
- No schooling: 456
- Nursery to 4th grade: 665
- 5th and 6th grade: 691
- 7th and 8th grade: 0
- 9th grade: 787
- 10th grade: 592
- 11th grade: 450
- 12th grade, no diploma: 679
- High school graduate (or equivalency): 12,258
- Less than 1 year of college: 1,019
- Some college more than 1 year, no degree: 3,327
- Associate degree: 1,980
- Bachelor's degree: 8,418
- Master's degree: 4,631
- Professional school degree: 3,485
- Doctorate degree: 2,286
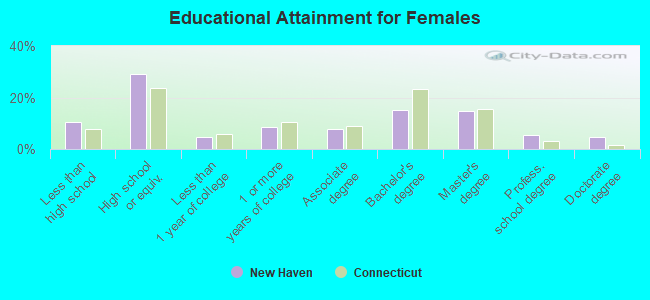
Education attainment for females 25 years and older:
- No schooling: 570
- Nursery to 4th grade: 104
- 5th and 6th grade: 619
- 7th and 8th grade: 228
- 9th grade: 546
- 10th grade: 301
- 11th grade: 1,753
- 12th grade, no diploma: 342
- High school graduate (or equivalency): 12,384
- Less than 1 year of college: 1,917
- Some college more than 1 year, no degree: 3,685
- Associate degree: 3,268
- Bachelor's degree: 6,404
- Master's degree: 6,322
- Professional school degree: 2,356
- Doctorate degree: 1,997
Housing units in structures:
- One, detached: 13,240
- One, attached: 2,975
- Two: 9,599
- 3 or 4: 14,458
- 5 to 9: 4,285
- 10 to 19: 2,796
- 20 to 49: 4,950
- 50 or more: 9,409
- Mobile homes: 70
Housing units lacking complete kitchen facilities in 2022: 0.8%
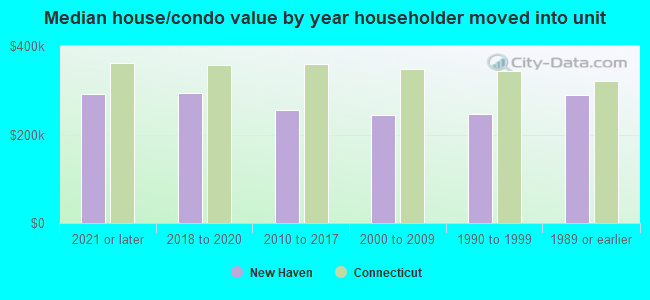
House/condo owner moved in on average 12 years ago
Renter moved in on average 3 years ago
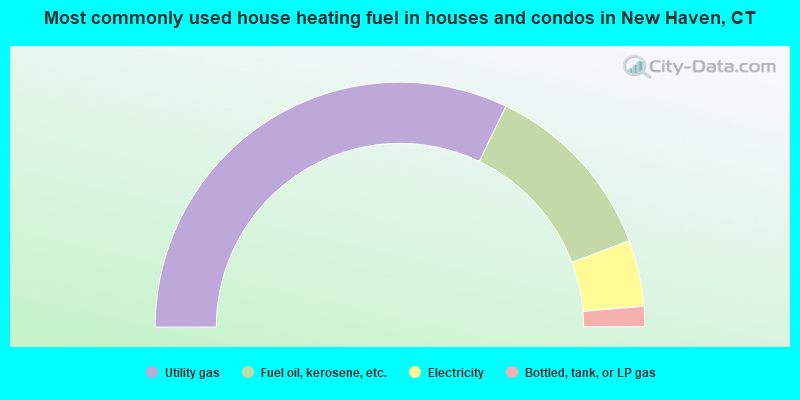
- 64.2%Utility gas
- 24.3%Fuel oil, kerosene, etc.
- 8.7%Electricity
- 2.7%Bottled, tank, or LP gas
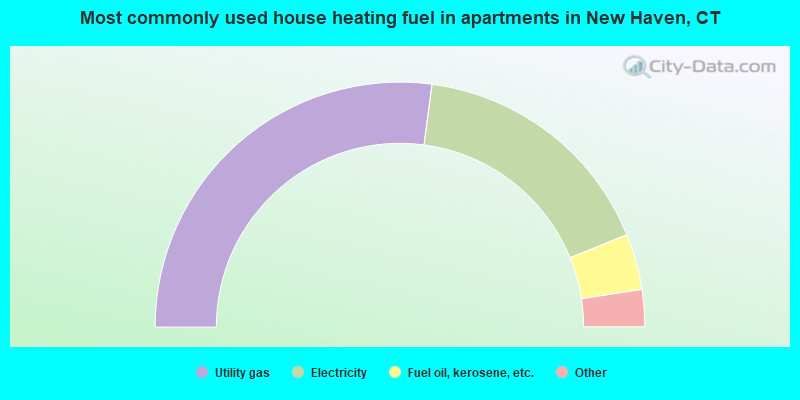
- 54.2%Utility gas
- 33.5%Electricity
- 7.4%Fuel oil, kerosene, etc.
- 3.2%Bottled, tank, or LP gas
- 0.9%Other fuel
- 0.7%No fuel used
- 0.3%Solar energy
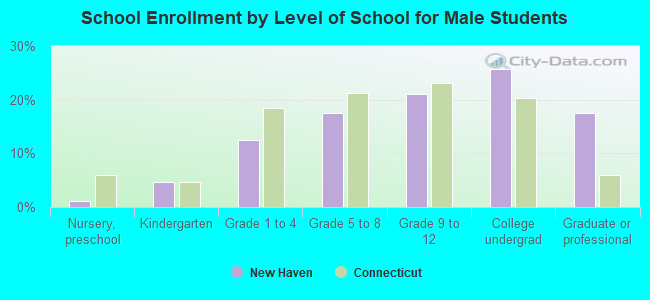
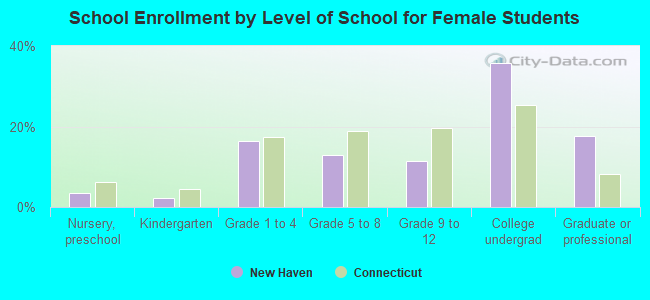
Private vs. public school enrollment:
| Here: | 10.8% |
| Connecticut: | 9.5% |
| Here: | 17.3% |
| Connecticut: | 12.9% |
| Here: | 58.6% |
| Connecticut: | 35.5% |