Newton, MA (Massachusetts) Houses and Residents
Estimated median house or condo value in 2022: $1,134,600 (it was $416,600 in 2000 )
Newton:
$1,134,600Massachusetts:
$534,700
Lower value quartile - upper value quartile: $827,800 - $1,688,000Mean price in 2022: Detached houses: $1,532,716 Here:
$1,532,716State:
$651,570
Townhouses or other attached units: $1,069,255 Here:
$1,069,255State:
$617,749
In 2-unit structures: $860,259 Here:
$860,259State:
$594,808
In 3-to-4-unit structures: $728,970 Here:
$728,970State:
$601,912
In 5-or-more-unit structures: $786,687 Here:
$786,687State:
$555,768
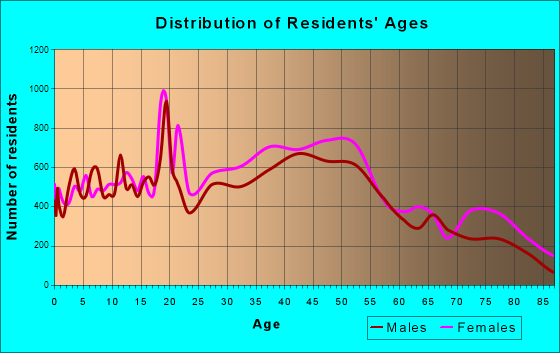
Total population: 88,287 (Urban population: 83,829, Rural population: 0)
Houses: 34,575 (33,196 occupied: 23,121 owner occupied, 10,075 renter occupied )
% of renters here:
30%State:
38%
Housing density: 1,915 houses/condos per square mile
Median price asked for vacant for-sale houses and condos in 2022: $1,107,121.
Median contract rent in 2022: over $2,000 (lower quartile is $1,552, upper quartile is over $2,000)
Median rent asked for vacant for-rent units in 2022: $2,994
Median gross rent in Newton, MA in 2022: over $2,000
Housing units in Newton with a mortgage: 13,695 (2,458 second mortgage, 66 home equity loan, 2,347 both second mortgage and home equity loan )Houses without a mortgage: 717
Median household income for houses/condos with a mortgage: $250,001
Median household income for apartments without a mortgage: $148,387
Median monthly housing costs: $2,640
Data:
Median house or condo value ($)
Median house or condo value ($ change since 2000)
Median house or condo value ($) - White
Median house or condo value ($) - Black or African American
Median house or condo value ($) - Asian
Median house or condo value ($) - Hispanic or Latino
Median house or condo value ($) - American Indian and Alaska Native
Median house or condo value ($) - Multirace
Median house or condo value ($) - Other Race
Median price asked for mobile homes ($)
Household density (households per square mile)
Mean house or condo value by units in structure - 1, detached ($)
Mean house or condo value by units in structure - 1, attached ($)
Mean house or condo value by units in structure - 2 ($)
Mean house or condo value by units in structure by units in structure - 3 or 4 ($)
Mean house or condo value by units in structure - 5 or more ($)
Mean house or condo value by units in structure - Boat, RV, van, etc. ($)
Mean house or condo value by units in structure - Mobile home ($)
Median contract rent ($)
Median contract rent - Lower quartile ($)
Median contract rent - Upper quartile ($)
Median gross rent ($)
Urban houses (%)
Rural houses (%)
Houses occupied (%)
Houses occupied (% change since 2000)
Houses owner occupied (%)
Houses owner occupied (% change since 2000)
Houses renter occupied (%)
Houses renter occupied (% change since 2000)
Vacant housing units - For rent (%)
Vacant housing units - For rent (% change since 2000)
Vacant housing units - For sale only (%)
Vacant housing units - For sale only (% change since 2000)
Vacant housing units - Rented or sold, not occupied (%)
Vacant housing units - Rented or sold, not occupied (% change since 2000)
Vacant housing units - For seasonal, recreational, or occasional use (%)
Vacant housing units - For seasonal, recreational, or occasional use (% change since 2000)
Vacant housing units - For migrant workers (%)
Vacant housing units - For migrant workers (% change since 2000)
Vacant housing units - Other vacant (%)
Vacant housing units - Other vacant (% change since 2000)
Median monthly housing costs ($)
Median household income for houses/condos with a mortgage ($)
Median household income for houses/condos without a mortgage ($)
Median household income ($)
Median household income ($) - White
Median household income ($) - Black or African American
Median household income ($) - Asian
Median household income ($) - Hispanic or Latino
Median household income ($) - American Indian and Alaska Native
Median household income ($) - Multirace
Median household income ($) - Other Race
Mortgage status - with mortgage (%)
Mortgage status - with second mortgage (%)
Mortgage status - with home equity loan (%)
Mortgage status - with both second mortgage and home equity loan (%)
Mortgage status - without a mortgage (%)
Median year house/condo built
Median year apartment built
Household type by relationship - Male householder living alone (%)
Household type by relationship - Male householder not living alone (%)
Household type by relationship - Female householder living alone (%)
Household type by relationship - Female householder not living alone (%)
Household type by relationship - Opposite-Sex spouse (%)
Household type by relationship - Same-Sex spouse (%)
Household type by relationship - Opposite-Sex unmarried partner (%)
Household type by relationship - Same-Sex unmarried partner (%)
Household type by relationship - In group quarters (%)
Size of family households - 2-person household (%)
Size of family households - 3-person household (%)
Size of family households - 4-person household (%)
Size of family households - 5-person household (%)
Size of family households - 6-person household (%)
Size of family households - 7-or-more-person household (%)
Size of nonfamily households - 1-person household (%)
Size of nonfamily households - 2-person household (%)
Size of nonfamily households - 3-person household (%)
Size of nonfamily households - 4-person household (%)
Size of nonfamily households - 5-person household (%)
Size of nonfamily households - 6-person household (%)
Size of nonfamily households - 7-or-moreperson household (%)
Year house built - Built 2010 or later (%)
Year house built - Built 2000 to 2009 (%)
Year house built - Built 1990 to 1999 (%)
Year house built - Built 1980 to 1989 (%)
Year house built - Built 1970 to 1979 (%)
Year house built - Built 1960 to 1969 (%)
Year house built - Built 1950 to 1959 (%)
Year house built - Built 1940 to 1949 (%)
Year house built - Built 1939 or earlier (%)
Median number of rooms in houses and condos
Median number of rooms in apartments
Median number of bedrooms in owner occupied houses
Mean number of bedrooms in owner occupied houses
Median number of bedrooms in renter occupied houses
Mean number of bedrooms in renter occupied houses
Median number of vehichles in owner occupied houses
Mean number of vehichles in owner occupied houses
Median number of vehichles in renter occupied houses
Mean number of vehichles in renter occupied houses
Rooms in owner-occupied houses - 1 room (%)
Rooms in owner-occupied houses - 2 rooms (%)
Rooms in owner-occupied houses - 3 rooms (%)
Rooms in owner-occupied houses - 4 rooms (%)
Rooms in owner-occupied houses - 5 rooms (%)
Rooms in owner-occupied houses - 6 rooms (%)
Rooms in owner-occupied houses - 7 rooms (%)
Rooms in owner-occupied houses - 8 rooms (%)
Rooms in owner-occupied houses - 9+ rooms (%)
Rooms in renter-occupied houses - 1 room (%)
Rooms in renter-occupied houses - 2 rooms (%)
Rooms in renter-occupied houses - 3 rooms (%)
Rooms in renter-occupied houses - 4 rooms (%)
Rooms in renter-occupied houses - 5 rooms (%)
Rooms in renter-occupied houses - 6 rooms (%)
Rooms in renter-occupied houses - 7 rooms (%)
Rooms in renter-occupied houses - 8 rooms (%)
Rooms in renter-occupied houses - 9+ rooms (%)
Bedrooms in owner-occupied houses - no bedrooms (%)
Bedrooms in owner-occupied houses - 1 bedroom (%)
Bedrooms in owner-occupied houses - 2 bedrooms (%)
Bedrooms in owner-occupied houses - 3 bedrooms (%)
Bedrooms in owner-occupied houses - 4 bedrooms (%)
Bedrooms in owner-occupied houses - 5+ bedrooms (%)
Bedrooms in renter-occupied houses - no bedrooms (%)
Bedrooms in renter-occupied houses - 1 bedroom (%)
Bedrooms in renter-occupied houses - 2 bedrooms (%)
Bedrooms in renter-occupied houses - 3 bedrooms (%)
Bedrooms in renter-occupied houses - 4 bedrooms (%)
Bedrooms in renter-occupied houses - 5+ bedrooms (%)
Vehicles available in owner-occupied houses - no vehicle available (%)
Vehicles available in owner-occupied houses - 1 vehicle available(%)
Vehicles available in owner-occupied houses - 2 Vehicles available (%)
Vehicles available in owner-occupied houses - 3 Vehicles available (%)
Vehicles available in owner-occupied houses - 4 Vehicles available (%)
Vehicles available in owner-occupied houses - 5+ Vehicles available (%)
Vehicles available in renter-occupied houses - no vehicle available (%)
Vehicles available in renter-occupied houses - 1 vehicle available (%)
Vehicles available in renter-occupied houses - 2 Vehicles available (%)
Vehicles available in renter-occupied houses - 3 Vehicles available (%)
Vehicles available in renter-occupied houses - 4 Vehicles available (%)
Vehicles available in renter-occupied houses - 5+ Vehicles available (%)
Housing units in structures - 1, detached (%)
Housing units in structures - 1, attached (%)
Housing units in structures - 2 (%)
Housing units in structures - 3 or 4 (%)
Housing units in structures - 5 to 9 (%)
Housing units in structures - 10 to 19 (%)
Housing units in structures - 20 to 49 (%)
Housing units in structures - 50 or more (%)
Housing units in structures - Mobile home (%)
Housing units in structures - Boat, RV, van, etc. (%)
Housing units in structures - Owners - 1, detached (%)
Housing units in structures - Owners - 1, attached (%)
Housing units in structures - Owners - 2 (%)
Housing units in structures - Owners - 3 or 4 (%)
Housing units in structures - Owners - 5 to 9 (%)
Housing units in structures - Owners - 10 to 19 (%)
Housing units in structures - Owners - 20 to 49 (%)
Housing units in structures - Owners - 50 or more (%)
Housing units in structures - Owners - Mobile home (%)
Housing units in structures - Owners - Boat, RV, van, etc. (%)
Housing units in structures - Renters - 1, detached (%)
Housing units in structures - Renters - 1, attached (%)
Housing units in structures - Renters - 2 (%)
Housing units in structures - Renters - 3 or 4 (%)
Housing units in structures - Renters - 5 to 9 (%)
Housing units in structures - Renters - 10 to 19 (%)
Housing units in structures - Renters - 20 to 49 (%)
Housing units in structures - Renters - 50 or more (%)
Housing units in structures - Renters - Mobile home (%)
Housing units in structures - Renters - Boat, RV, van, etc. (%)
House/condo owner moved in on average (years ago)
Renter moved in on average (years ago)
Year householder moved into unit - Moved in 1999 to March 2000 (%)
Year householder moved into unit - Moved in 1999 to March 2000 (%) - White
Year householder moved into unit - Moved in 1999 to March 2000 (%) - Black or African American
Year householder moved into unit - Moved in 1999 to March 2000 (%) - Asian
Year householder moved into unit - Moved in 1999 to March 2000 (%) - Hispanic or Latino
Year householder moved into unit - Moved in 1999 to March 2000 (%) - American Indian and Alaska Native
Year householder moved into unit - Moved in 1999 to March 2000 (%) - Multirace
Year householder moved into unit - Moved in 1999 to March 2000 (%) - Other Race
Year householder moved into unit - Moved in 1995 to 1998 (%)
Year householder moved into unit - Moved in 1995 to 1998 (%) - White
Year householder moved into unit - Moved in 1995 to 1998 (%) - Black or African American
Year householder moved into unit - Moved in 1995 to 1998 (%) - Asian
Year householder moved into unit - Moved in 1995 to 1998 (%) - Hispanic or Latino
Year householder moved into unit - Moved in 1995 to 1998 (%) - American Indian and Alaska Native
Year householder moved into unit - Moved in 1995 to 1998 (%) - Multirace
Year householder moved into unit - Moved in 1995 to 1998 (%) - Other Race
Year householder moved into unit - Moved in 1990 to 1994 (%)
Year householder moved into unit - Moved in 1990 to 1994 (%) - White
Year householder moved into unit - Moved in 1990 to 1994 (%) - Black or African American
Year householder moved into unit - Moved in 1990 to 1994 (%) - Asian
Year householder moved into unit - Moved in 1990 to 1994 (%) - Hispanic or Latino
Year householder moved into unit - Moved in 1990 to 1994 (%) - American Indian and Alaska Native
Year householder moved into unit - Moved in 1990 to 1994 (%) - Multirace
Year householder moved into unit - Moved in 1990 to 1994 (%) - Other Race
Year householder moved into unit - Moved in 1980 to 1989 (%)
Year householder moved into unit - Moved in 1980 to 1989 (%) - White
Year householder moved into unit - Moved in 1980 to 1989 (%) - Black or African American
Year householder moved into unit - Moved in 1980 to 1989 (%) - Asian
Year householder moved into unit - Moved in 1980 to 1989 (%) - Hispanic or Latino
Year householder moved into unit - Moved in 1980 to 1989 (%) - American Indian and Alaska Native
Year householder moved into unit - Moved in 1980 to 1989 (%) - Multirace
Year householder moved into unit - Moved in 1980 to 1989 (%) - Other Race
Year householder moved into unit - Moved in 1970 to 1979 (%)
Year householder moved into unit - Moved in 1970 to 1979 (%) - White
Year householder moved into unit - Moved in 1970 to 1979 (%) - Black or African American
Year householder moved into unit - Moved in 1970 to 1979 (%) - Asian
Year householder moved into unit - Moved in 1970 to 1979 (%) - Hispanic or Latino
Year householder moved into unit - Moved in 1970 to 1979 (%) - American Indian and Alaska Native
Year householder moved into unit - Moved in 1970 to 1979 (%) - Multirace
Year householder moved into unit - Moved in 1970 to 1979 (%) - Other Race
Year householder moved into unit - Moved in 1969 or earlier (%)
Year householder moved into unit - Moved in 1969 or earlier (%) - White
Year householder moved into unit - Moved in 1969 or earlier (%) - Black or African American
Year householder moved into unit - Moved in 1969 or earlier (%) - Asian
Year householder moved into unit - Moved in 1969 or earlier (%) - Hispanic or Latino
Year householder moved into unit - Moved in 1969 or earlier (%) - American Indian and Alaska Native
Year householder moved into unit - Moved in 1969 or earlier (%) - Multirace
Year householder moved into unit - Moved in 1969 or earlier (%) - Other Race
Housing units lacking complete plumbing facilities (%)
Housing units lacking complete kitchen facilities (%)
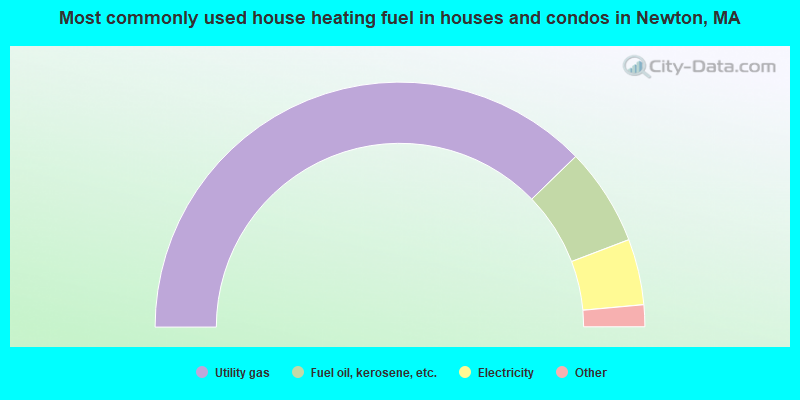
House heating fuel used in houses and condos - Utility gas (%)
House heating fuel used in houses and condos - Bottled, tank, or LP gas (%)
House heating fuel used in houses and condos - Electricity (%)
House heating fuel used in houses and condos - Fuel oil, kerosene, etc. (%)
House heating fuel used in houses and condos - Coal or coke (%)
House heating fuel used in houses and condos - Wood (%)
House heating fuel used in houses and condos - Solar energy (%)
House heating fuel used in houses and condos - Other fuel (%)
House heating fuel used in houses and condos - No fuel used (%)
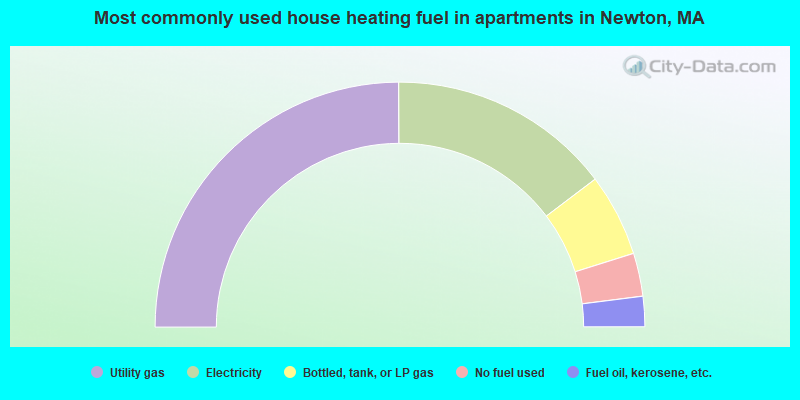
House heating fuel used in apartments - Utility gas (%)
House heating fuel used in apartments - Bottled, tank, or LP gas (%)
House heating fuel used in apartments - Electricity (%)
House heating fuel used in apartments - Fuel oil, kerosene, etc. (%)
House heating fuel used in apartments - Coal or coke (%)
House heating fuel used in apartments - Wood (%)
House heating fuel used in apartments - Solar energy (%)
House heating fuel used in apartments - Other fuel (%)
House heating fuel used in apartments - No fuel used (%)
Latest news about housing in Newton, MA collected exclusively by city-data.com from local newspapers, TV, and radio stations
Median year house/condo built: 1938Median year apartment built: 1961Household type by relationship:
Households: 87,382
Male householders: 16,361 (3,036 living alone ), Female householders: 16,835 (5,418 living alone )19,717 spouses (19,181 opposite-sex spouses ), 1,436 unmarried partners , (1,338 opposite-sex unmarried partners ), 23,461 children (22,554 natural , 472 adopted , 435 stepchildren ), 618 grandchildren , 325 brothers or sisters , 731 parents , 0 foster children , 526 other relatives , 1,165 non-relatives In group quarters: 6,207
Size of family households: 10,612 2-persons , 4,256 3-persons , 5,591 4-persons , 1,830 5-persons , 408 6-persons , 72 7-or-more-persons .
Size of nonfamily households: 8,454 1-person , 1,743 2-persons , 230 3-persons .
15,222 married couples with children. single-parent households (584 men , 1,573 women ).
73.5% of residents of Newton speak English at home. of residents speak Spanish at home (77% speak English very well , 12% speak English well , 8% speak English not well , 3% don't speak English at all ).of residents speak other Indo-European language at home (74% speak English very well , 11% speak English well , 12% speak English not well , 3% don't speak English at all ).of residents speak Asian or Pacific Island language at home (67% speak English very well , 22% speak English well , 9% speak English not well , 2% don't speak English at all ).of residents speak other language at home (80% speak English very well , 16% speak English well , 4% speak English not well ).
Foreign born population: 19,901 (22.8%)of them are naturalized citizens )
Median number of rooms in houses and condos:
Median number of rooms in apartments
Owner-occupied Renter-occupied
Rooms in owner-occupied houses in Newton, Massachusetts
0 1 room 253 2 rooms 625 3 rooms 1,442 4 rooms 1,867 5 rooms 3,508 6 rooms 3,809 7 rooms 3,556 8 rooms 8,061 9+ rooms
Rooms in renter-occupied apartments in Newton, Massachusetts
49 1 room 1,056 2 rooms 1,913 3 rooms 2,108 4 rooms 2,075 5 rooms 1,477 6 rooms 581 7 rooms 459 8 rooms 357 9+ rooms
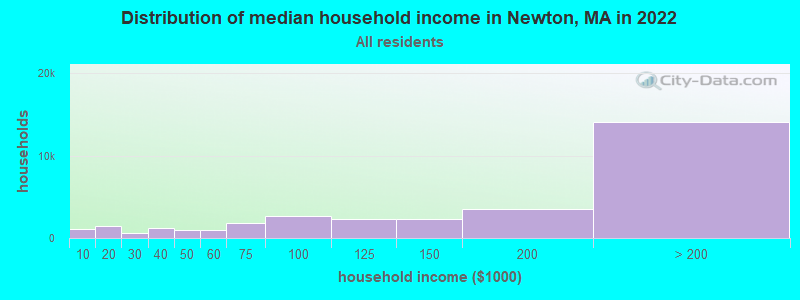
Newton, MA household income distribution 1,080 Less than $10,0001,449 $10,000 to $19,999650 $20,000 to $29,9991,254 $30,000 to $39,999994 $40,000 to $49,9991,021 $50,000 to $59,9991,852 $60,000 to $74,9992,637 $75,000 to $99,9992,333 $100,000 to $124,9992,296 $125,000 to $149,9993,569 $150,000 to $199,99914,061 $200,000 or more
Home value of owner - occupied houses in 2022 in Newton, MA 110 Less than $10,00017 $10,000 to $14,99918 $50,000 to $59,99912 $70,000 to $79,99985 $80,000 to $89,9999 $90,000 to $99,999182 $100,000 to $124,99930 $125,000 to $149,9998 $150,000 to $174,99929 $175,000 to $199,99976 $200,000 to $249,99938 $250,000 to $299,999230 $300,000 to $399,999396 $400,000 to $499,9992,615 $500,000 to $749,9995,748 $750,000 to $999,9997,156 $1,000,000 to $1,499,9994,081 $1,500,000 to $1,999,9994,131 $2,000,000 or moreRent paid by renters in 2022 in Newton, MA 71 Less than $10029 $100 to $14922 $150 to $19919 $200 to $249346 $250 to $299312 $300 to $34932 $350 to $39939 $450 to $49944 $500 to $549101 $550 to $59974 $600 to $64931 $650 to $69946 $700 to $74961 $750 to $79993 $800 to $899123 $900 to $999269 $1,000 to $1,249558 $1,250 to $1,4991,818 $1,500 to $1,9992,300 $2,000 to $2,499743 $2,500 to $2,999575 $3,000 to $3,4991,402 $3,500 or more350 No cash rent
Percentage of workers working in this county: 70.4%Number of people working at home: 14,769 (32.4% of all workers )
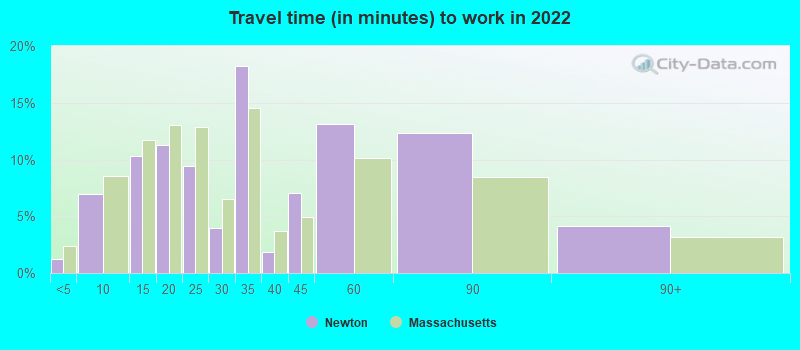
Travel time to work (commute)
Less than 5 minutes: 6345 to 9 minutes: 2,94510 to 14 minutes: 3,57215 to 19 minutes: 2,86320 to 24 minutes: 5,12925 to 29 minutes: 3,09330 to 34 minutes: 6,09435 to 39 minutes: 1,42940 to 44 minutes: 87245 to 59 minutes: 2,39960 to 89 minutes: 1,02090 or more minutes: 328
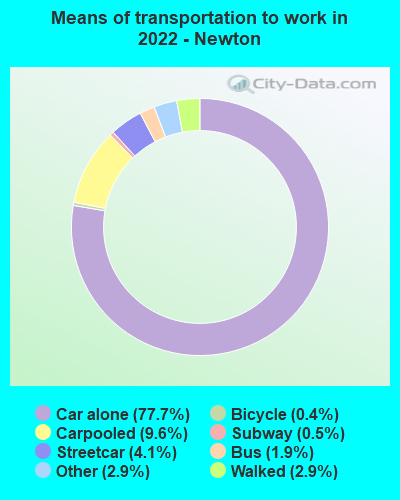
Means of transportation to work:
Drove a car alone: 34,689 (58.4%)Carpooled: 4,267 (7.2%)Bus : 864 (1.5%)Subway or elevated rail : 1,843 (3.1%)Long-distance train or commuter rail : 206 (0.3%)Taxi: 1,303 (2.2%)Bicycle: 159 (0.3%)Walked: 1,299 (2.2%)Worked at home: 14,734 (24.8%)
Unemployment by race in 2022
Unemployment rate for White non-Hispanic residents 2.8% Males5.5% FemalesUnemployment rate for Black residents 6.9% Males3.0% FemalesUnemployment rate for Asian residents 1.1% Males0.5% FemalesUnemployment rate for other race residents 1.7% Males0.3% FemalesUnemployment rate for two or more race residents 0.5% Males0.8% FemalesUnemployment rate for Hispanic or Latino residents 1.2% Males3.0% Females
Year of entry for the foreign-born population in Newton, Massachusetts
5,842 2010 or later 3,976 2000 to 2009 4,866 1990 to 1999 3,657 1980 to 1989 2,039 1970 to 1979 3,605 Before 1970
First ancestries reported:
Irish: 3,521 (8.1%)
Italian: 2,915 (6.7%)
Eastern European: 2,398 (5.5%)
American: 1,860 (4.3%)
Russian: 1,652 (3.8%)
English: 1,541 (3.6%)
European: 1,193 (2.8%)
German: 1,163 (2.7%)
Polish: 1,057 (2.4%)
Israeli: 1,005 (2.3%)
Brazilian: 672 (1.6%)
Albanian: 634 (1.5%)
Ukrainian: 585 (1.4%)
Romanian: 554 (1.3%)
Scottish: 471 (1.1%)
French Canadian: 344 (0.8%)
French: 341 (0.8%)
Canadian: 276 (0.6%)
Iranian: 238 (0.6%)
Lithuanian: 231 (0.5%)
Scotch-Irish: 218 (0.5%)
Greek: 191 (0.4%)
Norwegian: 172 (0.4%)
Haitian: 159 (0.4%)
British: 151 (0.3%)
Northern European: 148 (0.3%)
Armenian: 133 (0.3%)
Ugandan: 123 (0.3%)
Dutch: 122 (0.3%)
Afghan: 118 (0.3%)
Swiss: 101 (0.2%)
African: 92 (0.2%)
Danish: 91 (0.2%)
Bulgarian: 89 (0.2%)
Icelander: 85 (0.2%)
Swedish: 81 (0.2%)
Serbian: 78 (0.2%)
Austrian: 70 (0.2%)
Latvian: 68 (0.2%)
Syrian: 65 (0.2%)
Ethiopian: 63 (0.1%)
Moroccan: 56 (0.1%)
Kenyan: 56 (0.1%)
Portuguese: 51 (0.1%)
Nigerian: 49 (0.1%)
Jamaican: 46 (0.1%)
Belgian: 44 (0.1%)
Lebanese: 40 (0.09%)
U.S. Virgin Islander: 40 (0.09%)
Liberian: 39 (0.09%)
Hungarian: 38 (0.09%)
Ghanaian: 38 (0.09%)
Finnish: 37 (0.09%)
Cypriot: 37 (0.09%)
Slovak: 35 (0.08%)
Turkish: 33 (0.08%)
Egyptian: 31 (0.07%)
Barbadian: 29 (0.07%)
Iraqi: 25 (0.06%)
Croatian: 22 (0.05%)
South African: 20 (0.05%)
Welsh: 18 (0.04%)
Scandinavian: 12 (0.03%)
New Zealander: 9 (0.02%)
Estonian: 8 (0.02%)
Trinidadian and Tobagonian: 7 (0.02%)
Czech: 5 (0.01%)
British West Indian: 5 (0.01%)
Most common places of birth for foreign-born residents (%): China, excluding Hong Kong and Taiwan Newton:
14.4% (2,896)Massachusetts:
8.4% (103,233)
Israel Newton:
9.7% (1,944)Massachusetts:
0.5% (6,073)
India Newton:
6.6% (1,325)Massachusetts:
6.8% (82,934)
Russia Newton:
6.0% (1,199)Massachusetts:
1.5% (18,278)
Brazil Newton:
4.6% (923)Massachusetts:
7.6% (92,959)
Ukraine Newton:
4.5% (906)Massachusetts:
0.9% (10,808)
Korea Newton:
4.1% (819)Massachusetts:
1.4% (17,613)
Canada Newton:
3.2% (636)Massachusetts:
2.3% (28,158)
Other Eastern Europe Newton:
3.0% (606)Massachusetts:
0.3% (4,128)
Hong Kong Newton:
2.9% (581)Massachusetts:
0.7% (8,536)
Italy Newton:
2.4% (484)Massachusetts:
1.4% (16,886)
Albania Newton:
2.4% (482)Massachusetts:
1.1% (13,076)
Germany Newton:
2.3% (459)Massachusetts:
1.0% (12,529)
Taiwan Newton:
2.1% (424)Massachusetts:
0.7% (8,270)
England Newton:
1.7% (344)Massachusetts:
0.9% (10,698)
Romania Newton:
1.6% (325)Massachusetts:
0.3% (3,351)
Thailand Newton:
1.6% (324)Massachusetts:
0.5% (5,553)
Ireland Newton:
1.6% (318)Massachusetts:
1.1% (13,446)
Place of birth for U.S.-born residents:
This state: 38,944Other state: 27,280Northeast: 15,597Midwest: 3,888South: 4,666West: 3,129 86.6% of Newton residents lived in the same house 1 years ago.
Out of people who lived in different houses, 27.7% lived in this county.
Out of people who lived in different counties, 49.4% lived in Massachusetts.
Newton:
86.6%State average:
87.7%
Education attainment for males 25 years and older:
No schooling: 43Nursery to 4th grade: 05th and 6th grade: 1077th and 8th grade: 1589th grade: 1710th grade: 011th grade: 16612th grade, no diploma: 163High school graduate (or equivalency): 2,426Less than 1 year of college: 296Some college more than 1 year, no degree: 1,287Associate degree: 1,006Bachelor's degree: 7,498Master's degree: 6,295Professional school degree: 4,436Doctorate degree: 4,008
Education attainment for females 25 years and older:
No schooling: 296Nursery to 4th grade: 05th and 6th grade: 07th and 8th grade: 09th grade: 16510th grade: 011th grade: 3612th grade, no diploma: 458High school graduate (or equivalency): 2,280Less than 1 year of college: 630Some college more than 1 year, no degree: 1,086Associate degree: 1,665Bachelor's degree: 8,894Master's degree: 9,296Professional school degree: 2,816Doctorate degree: 3,324
Housing units in structures:
One, detached: 17,963One, attached: 3,071Two: 4,8313 or 4: 2,4795 to 9: 72410 to 19: 1,35120 to 49: 1,96950 or more: 2,187Housing units lacking complete plumbing facilities in 2022: 0.3%Housing units lacking complete kitchen facilities in 2022: 0.5%House/condo owner moved in on average 16 years ago
Renter moved in on average 2 years ago
Private vs. public school enrollment:
Students in private schools in grades 1 to 8 (elementary and middle school): 1,241 Here:
15.8%Massachusetts:
10.3%
Students in private schools in grades 9 to 12 (high school): 1,003 Here:
14.6%Massachusetts:
12.3%
Students in private undergraduate colleges: 5,506 Here:
80.0%Massachusetts:
51.2%