North Little Rock, AR (Arkansas) Houses and Residents
| North Little Rock: | $179,988 |
| Arkansas: | $179,800 |
Mean price in 2022:
Detached houses: $215,386
Here: $215,386 State: $243,881 Townhouses or other attached units: $338,700
Here: $338,700 State: $244,376 In 2-unit structures: $451,520
Here: $451,520 State: $229,180 In 3-to-4-unit structures: $1,399,234
Here: $1,399,234 State: $216,658 In 5-or-more-unit structures: $140,592
Here: $140,592 State: $227,195 Mobile homes: $46,434
Here: $46,434 State: $79,566
Total population: 66,810 (Urban population: 59,993, Rural population: 439 (8 farm, 431 nonfarm))
Houses: 33,521 (29,569 occupied: 14,430 owner occupied, 15,887 renter occupied)
| % of renters here: | 52% |
| State: | 34% |
Housing density: 748 houses/condos per square mile
Median price asked for vacant for-sale houses and condos in 2022: $89,777.
Median contract rent in 2022: $758 (lower quartile is $585, upper quartile is $926)
Median rent asked for vacant for-rent units in 2022: $996
Median gross rent in North Little Rock, AR in 2022: $944
Housing units in North Little Rock with a mortgage: 8,604 (599 second mortgage, 6 home equity loan, 364 both second mortgage and home equity loan)
Houses without a mortgage: 270
Median household income for houses/condos with a mortgage: $86,017
Median household income for apartments without a mortgage: $60,548
Median monthly housing costs: $920
Compare current foreclosures in North Little Rock, AR:
| Photo | Address | Area | Beds / Baths | Price | Details |
|---|---|---|---|---|---|

|
#1
Nicole Dr
North Little Rock, AR 72118
|
1,026 sq. feet
|
2 baths 3 beds |
$154,900
|
show details |

|
#2
Wayne Dr
North Little Rock, AR 72118
|
1,240 sq. feet
|
1 baths 3 beds |
$119,900
|
show details |

|
#3
Anemone Dr
North Little Rock, AR 72117
|
1,284 sq. feet
|
2 baths 3 beds |
show details | |

|
#4
Berkshire Mnr
North Little Rock, AR 72117
|
3,127 sq. feet
|
6 baths 6 beds |
show details | |

|
#5
Kansas Ave
North Little Rock, AR 72118
|
1,762 sq. feet
|
2 baths 3 beds |
show details | |

|
#6
N Magnolia St
North Little Rock, AR 72116
|
1,062 sq. feet
|
2 baths - beds |
show details | |

|
#7
W 48th St
North Little Rock, AR 72118
|
1,836 sq. feet
|
3 baths - beds |
show details | |

|
#8
Green Hills Dr
North Little Rock, AR 72118
|
1,509 sq. feet
|
2 baths - beds |
show details | |

|
#9
E 50th St
North Little Rock, AR 72117
|
2,026 sq. feet
|
2 baths - beds |
show details | |

|
#10
F St
North Little Rock, AR 72114
|
- sq. feet
|
- baths - beds |
$5,400
|
show details |
| Photo | Address | Area | Beds / Baths | Price | Details |
|---|---|---|---|---|---|

|
#11
W 21st St
North Little Rock, AR 72114
|
1,237 sq. feet
|
1 baths - beds |
show details | |

|
#12
Faulkner Lake Rd
North Little Rock, AR 72117
|
2,186 sq. feet
|
2 baths - beds |
show details | |

|
#13
Mosley St
North Little Rock, AR 72117
|
1,309 sq. feet
|
1 baths - beds |
show details | |

|
#14
Lindenhurst Dr
North Little Rock, AR 72118
|
1,020 sq. feet
|
1 baths - beds |
show details | |

|
#15
Medford Ln
North Little Rock, AR 72117
|
988 sq. feet
|
1 baths - beds |
show details | |

|
#16
Prospect Cv
North Little Rock, AR 72118
|
1,510 sq. feet
|
2 baths - beds |
show details | |

|
#17
S Woodland Dr
North Little Rock, AR 72117
|
1,233 sq. feet
|
1 baths - beds |
show details | |

|
#18
Oleary St
North Little Rock, AR 72118
|
1,512 sq. feet
|
1 baths - beds |
show details | |

|
#19
Brantley Ave
North Little Rock, AR 72117
|
984 sq. feet
|
2 baths - beds |
show details | |

|
#20
Sierra Ct
North Little Rock, AR 72118
|
1,572 sq. feet
|
1 baths - beds |
show details |
| Photo | Address | Area | Beds / Baths | Price | Details |
|---|---|---|---|---|---|

|
#21
W 57th St
North Little Rock, AR 72118
|
936 sq. feet
|
1 baths - beds |
show details | |

|
#22
Hyacinth St
North Little Rock, AR 72117
|
1,017 sq. feet
|
1 baths - beds |
show details | |

|
#23
Comanche Dr
North Little Rock, AR 72116
|
2,005 sq. feet
|
2 baths - beds |
show details | |

|
#24
E 20th St
North Little Rock, AR 72114
|
1,016 sq. feet
|
1 baths - beds |
show details | |

|
#25
Aztec Dr
North Little Rock, AR 72116
|
2,104 sq. feet
|
2 baths - beds |
show details | |

|
#26
Monticello Dr
North Little Rock, AR 72116
|
1,705 sq. feet
|
1 baths - beds |
show details | |

|
#27
Rustic Ln
North Little Rock, AR 72118
|
1,746 sq. feet
|
2 baths - beds |
show details | |

|
#28
N Locust St
North Little Rock, AR 72116
|
2,215 sq. feet
|
1 baths - beds |
show details | |

|
#29
Mundo Rd
North Little Rock, AR 72118
|
1,774 sq. feet
|
2 baths - beds |
show details | |

|
#30
Healy St
North Little Rock, AR 72117
|
1,305 sq. feet
|
1 baths - beds |
show details |
| Photo | Address | Area | Beds / Baths | Price | Details |
|---|---|---|---|---|---|

|
#31
Rock St
North Little Rock, AR 72118
|
1,627 sq. feet
|
2 baths - beds |
show details | |

|
#32
Pontiac Dr
North Little Rock, AR 72116
|
972 sq. feet
|
1 baths - beds |
show details | |

|
#33
Faulkner Lake Rd
North Little Rock, AR 72117
|
2,238 sq. feet
|
2 baths - beds |
show details | |

|
#34
Edmonds St
North Little Rock, AR 72117
|
884 sq. feet
|
1 baths - beds |
show details | |

|
#35
Ridge Rd
North Little Rock, AR 72116
|
1,633 sq. feet
|
1 baths - beds |
show details | |

|
#36
Hacienda Dr
North Little Rock, AR 72118
|
982 sq. feet
|
1 baths - beds |
show details | |

|
#37
Whippoorwill Ln
North Little Rock, AR 72117
|
1,219 sq. feet
|
1 baths - beds |
show details | |

|
#38
Greenbank Rd
North Little Rock, AR 72118
|
1,776 sq. feet
|
2 baths - beds |
show details | |

|
#39
Whippoorwill Ln
North Little Rock, AR 72117
|
952 sq. feet
|
1 baths - beds |
show details | |

|
#40
E 11th St
North Little Rock, AR 72114
|
1,400 sq. feet
|
1 baths - beds |
show details |
| Photo | Address | Area | Beds / Baths | Price | Details |
|---|---|---|---|---|---|

|
#41
S Woodland Dr
North Little Rock, AR 72117
|
1,369 sq. feet
|
2 baths - beds |
show details | |

|
#42
W 18th St
North Little Rock, AR 72114
|
1,346 sq. feet
|
2 baths - beds |
show details | |

|
#43
W 34th St
North Little Rock, AR 72118
|
1,294 sq. feet
|
1 baths - beds |
show details | |

|
#44
James Cutoff Rd
North Little Rock, AR 72117
|
1,144 sq. feet
|
1 baths - beds |
show details | |

|
#45
Allen St
North Little Rock, AR 72118
|
1,492 sq. feet
|
1 baths - beds |
show details | |

|
#46
Haywood St
North Little Rock, AR 72117
|
1,038 sq. feet
|
1 baths - beds |
show details | |

|
#47
Oakview Dr
North Little Rock, AR 72118
|
945 sq. feet
|
1 baths - beds |
show details | |

|
#48
Trethorne Cir
North Little Rock, AR 72117
|
1,553 sq. feet
|
2 baths - beds |
show details | |

|
#49
Faulkner Lake Rd
North Little Rock, AR 72117
|
2,149 sq. feet
|
2 baths - beds |
show details | |

|
Check over 1 million property listings on Foreclosure.com!
|
browse all offers | |||


Median year apartment built: 1979
Household type by relationship:
Households: 64,587- Male householders: 12,415 (4,790 living alone), Female householders: 16,771 (7,194 living alone)
9,074 spouses (8,834 opposite-sex spouses), 2,557 unmarried partners, (2,288 opposite-sex unmarried partners), 16,942 children (15,902 natural, 467 adopted, 572 stepchildren), 1,321 grandchildren, 759 brothers or sisters, 812 parents, 100 foster children, 1,274 other relatives, 1,781 non-relatives
- In group quarters: 774
Size of family households: 7,607 2-persons, 3,350 3-persons, 1,629 4-persons, 1,013 5-persons, 659 6-persons, 304 7-or-more-persons.
Size of nonfamily households: 14,156 1-person, 1,748 2-persons, 125 3-persons, 47 4-persons, 46 5-persons.
6,419 married couples with children.
5,846 single-parent households (967 men, 4,879 women).
93.9% of residents of North Little Rock speak English at home.
4.2% of residents speak Spanish at home (46% speak English very well, 17% speak English well, 30% speak English not well, 7% don't speak English at all).
0.7% of residents speak other Indo-European language at home (93% speak English very well, 1% speak English well, 6% speak English not well).
0.4% of residents speak Asian or Pacific Island language at home (65% speak English very well, 28% speak English well, 4% speak English not well, 3% don't speak English at all).
0.5% of residents speak other language at home (100% speak English very well).
Foreign born population: 2,197 (3.4%)
(44.5% of them are naturalized citizens)
| Here: | 6.3 |
| State: | 6.1 |
| Here: | 4.2 |
| State: | 4.3 |
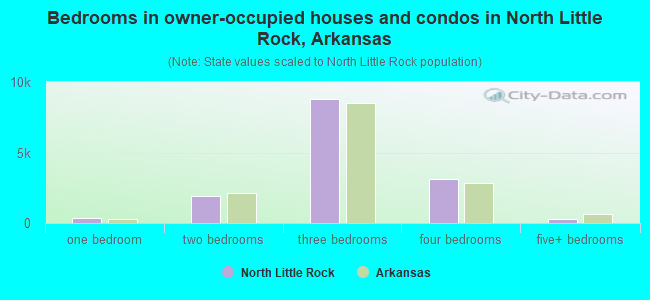
- Bedrooms in owner-occupied houses and condos in North Little Rock, Arkansas
- 12no bedroom
- 3291 bedroom
- 1,8822 bedrooms
- 8,7883 bedrooms
- 3,1014 bedrooms
- 3195+ bedrooms
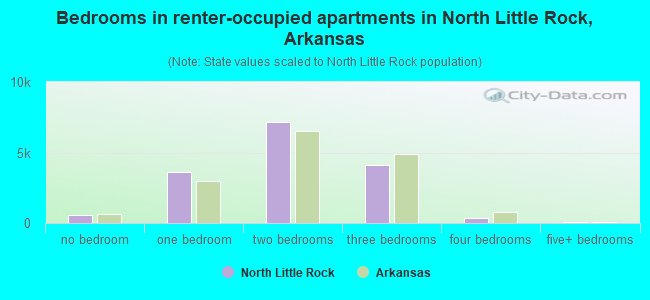
- Bedrooms in renter-occupied apartments in North Little Rock, Arkansas
- 578no bedroom
- 3,5831 bedroom
- 7,1632 bedrooms
- 4,1303 bedrooms
- 3874 bedrooms
- 465+ bedrooms
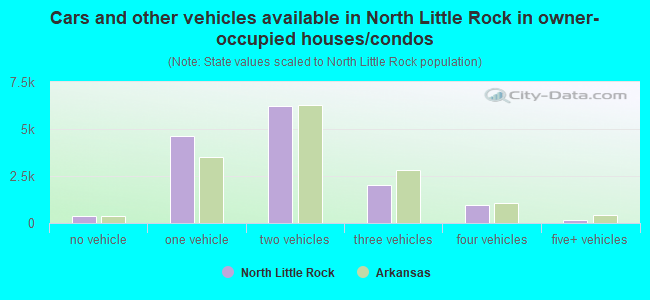
- Cars and other vehicles available in North Little Rock in owner-occupied houses/condos
- 388no vehicle
- 4,6431 vehicle
- 6,2392 vehicles
- 1,9963 vehicles
- 9844 vehicles
- 1805+ vehicles
- Cars and other vehicles available in North Little Rock in renter-occupied apartments
- 2,302no vehicle
- 8,9431 vehicle
- 3,4062 vehicles
- 1,0943 vehicles
- 1354 vehicles
- 65+ vehicles
- Rooms in owner-occupied houses in North Little Rock, Arkansas
- 101 room
- 502 rooms
- 3213 rooms
- 9684 rooms
- 3,4515 rooms
- 3,6846 rooms
- 2,2717 rooms
- 1,9588 rooms
- 1,7199+ rooms
- Rooms in renter-occupied apartments in North Little Rock, Arkansas
- 5781 room
- 7832 rooms
- 2,6973 rooms
- 4,9884 rooms
- 3,1665 rooms
- 2,2456 rooms
- 1,1307 rooms
- 1578 rooms
- 1439+ rooms
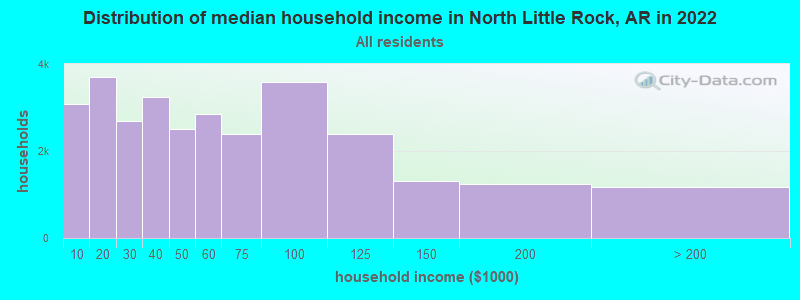
North Little Rock, AR household income distribution

- 3,077Less than $10,000
- 3,710$10,000 to $19,999
- 2,700$20,000 to $29,999
- 3,242$30,000 to $39,999
- 2,517$40,000 to $49,999
- 2,852$50,000 to $59,999
- 2,393$60,000 to $74,999
- 3,576$75,000 to $99,999
- 2,384$100,000 to $124,999
- 1,320$125,000 to $149,999
- 1,242$150,000 to $199,999
- 1,173$200,000 or more
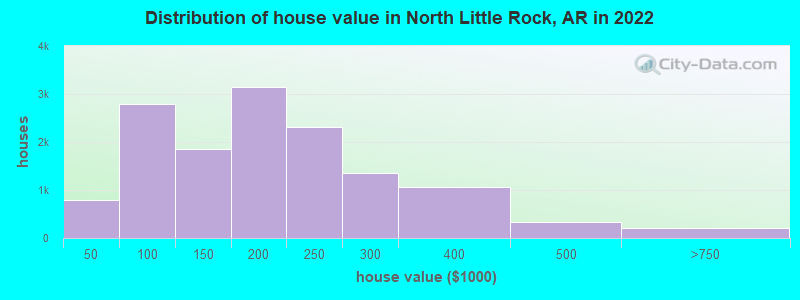
Home value of owner - occupied houses in 2022 in North Little Rock, AR
-
- 140Less than $10,000
- 32$10,000 to $14,999
- 43$15,000 to $19,999
- 156$20,000 to $24,999
- 107$25,000 to $29,999
- 80$30,000 to $34,999
- 52$35,000 to $39,999
- 184$40,000 to $49,999
- 280$50,000 to $59,999
- 371$60,000 to $69,999
- 350$70,000 to $79,999
- 830$80,000 to $89,999
- 784$90,000 to $99,999
- 1,098$100,000 to $124,999
- 758$125,000 to $149,999
- 1,768$150,000 to $174,999
- 1,385$175,000 to $199,999
- 2,321$200,000 to $249,999
- 1,346$250,000 to $299,999
- 1,062$300,000 to $399,999
- 328$400,000 to $499,999
- 170$500,000 to $749,999
- 18$750,000 to $999,999
- 26$1,000,000 to $1,499,999
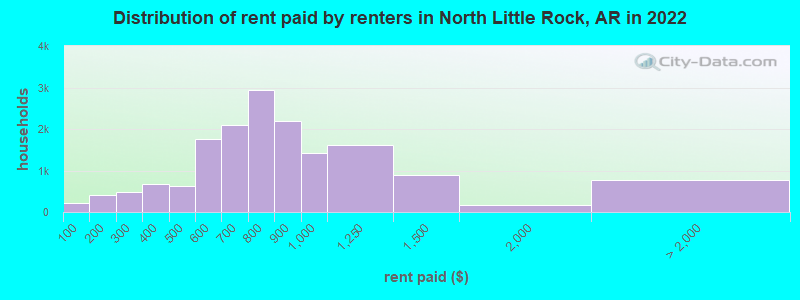
Rent paid by renters in 2022 in North Little Rock, AR
-
- 214Less than $100
- 37$100 to $149
- 378$150 to $199
- 269$200 to $249
- 212$250 to $299
- 330$300 to $349
- 352$350 to $399
- 152$400 to $449
- 481$450 to $499
- 879$500 to $549
- 882$550 to $599
- 1,262$600 to $649
- 827$650 to $699
- 1,129$700 to $749
- 1,811$750 to $799
- 2,182$800 to $899
- 1,420$900 to $999
- 1,619$1,000 to $1,249
- 882$1,250 to $1,499
- 179$1,500 to $1,999
- 39$2,000 to $2,499
- 743No cash rent
Percentage of workers working in this county: 94.0%
Number of people working at home: 2,356 (7.8% of all workers)
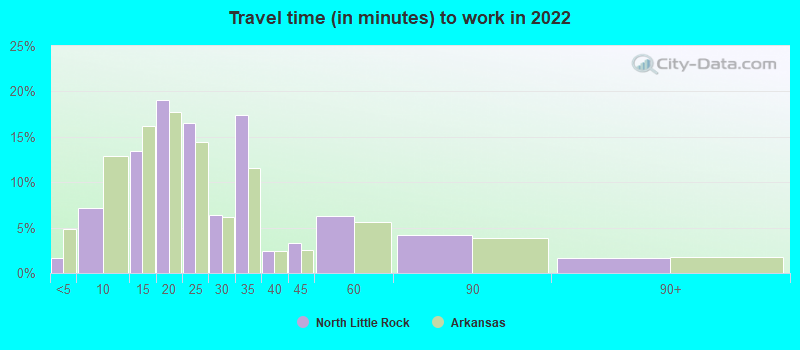
Travel time to work (commute)
- Less than 5 minutes: 464
- 5 to 9 minutes: 2,482
- 10 to 14 minutes: 4,351
- 15 to 19 minutes: 7,828
- 20 to 24 minutes: 5,515
- 25 to 29 minutes: 1,610
- 30 to 34 minutes: 3,226
- 35 to 39 minutes: 235
- 40 to 44 minutes: 391
- 45 to 59 minutes: 240
- 60 to 89 minutes: 837
- 90 or more minutes: 378
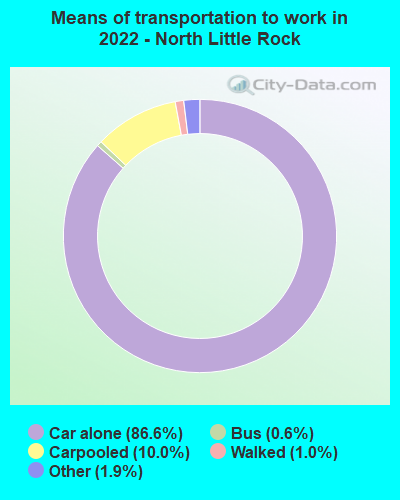
Means of transportation to work:
- Drove a car alone: 35,397 (82.9%)
- Carpooled: 2,901 (6.8%)
- Bus: 229 (0.5%)
- Subway or elevated rail: 8 (0.0%)
- Taxi: 838 (2.0%)
- Bicycle: 4 (0.0%)
- Walked: 523 (1.2%)
- Worked at home: 2,356 (5.5%)
- Unemployment by race in 2022
- Unemployment rate for White non-Hispanic residents
- 2.7%Males
- 3.3%Females
- Unemployment rate for Black residents
- 5.2%Males
- 13.4%Females
- Unemployment rate for American Indian and Alaska Native residents
- 28.0%Females
- Unemployment rate for Asian residents
- 15.5%Males
- Unemployment rate for other race residents
- 17.7%Males
- Unemployment rate for two or more race residents
- 3.6%Males
- 2.5%Females
- Unemployment rate for Hispanic or Latino residents
- 7.6%Males
- 4.6%Females
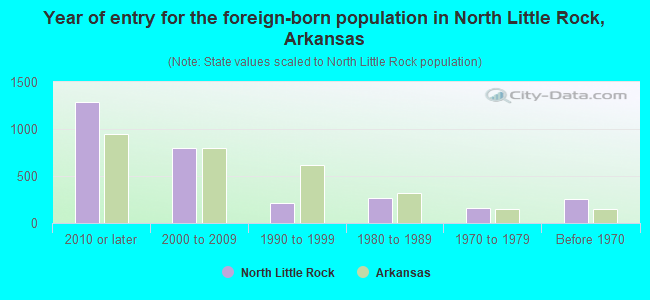
- Year of entry for the foreign-born population in North Little Rock, Arkansas
- 1,2872010 or later
- 7932000 to 2009
- 2101990 to 1999
- 2641980 to 1989
- 1581970 to 1979
- 258Before 1970
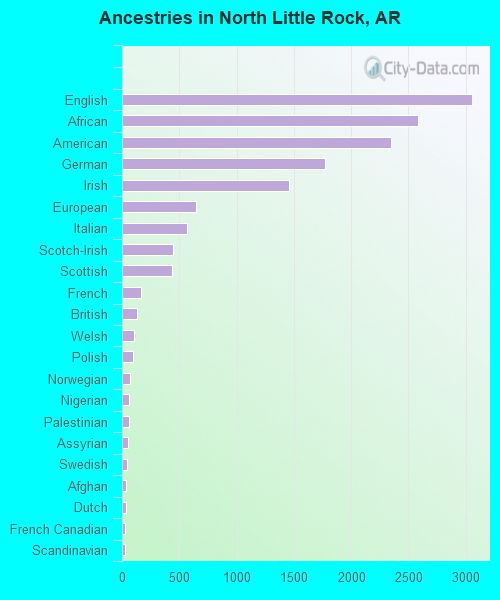
First ancestries reported:
- English: 3,050 (8.3%)
- African: 2,581 (7.0%)
- American: 2,345 (6.4%)
- German: 1,772 (4.8%)
- Irish: 1,454 (4.0%)
- European: 642 (1.8%)
- Italian: 564 (1.5%)
- Scotch-Irish: 442 (1.2%)
- Scottish: 438 (1.2%)
- French: 167 (0.5%)
- British: 127 (0.3%)
- Welsh: 106 (0.3%)
- Polish: 97 (0.3%)
- Norwegian: 71 (0.2%)
- Nigerian: 59 (0.2%)
- Palestinian: 59 (0.2%)
- Assyrian: 49 (0.1%)
- Swedish: 44 (0.1%)
- Afghan: 35 (0.10%)
- Dutch: 32 (0.09%)
- French Canadian: 30 (0.08%)
- Scandinavian: 29 (0.08%)
- Austrian: 22 (0.06%)
- Armenian: 21 (0.06%)
- Northern European: 20 (0.05%)
- Egyptian: 18 (0.05%)
- British West Indian: 15 (0.04%)
- Czech: 13 (0.04%)
- Hungarian: 12 (0.03%)
- Danish: 12 (0.03%)
- Slovak: 11 (0.03%)
- Iranian: 10 (0.03%)
- Eastern European: 9 (0.02%)
- Swiss: 7 (0.02%)
- Bulgarian: 6 (0.02%)
- Arab: 6 (0.02%)
- Lebanese: 6 (0.02%)
- Jordanian: 3 (0.01%)
Most common places of birth for foreign-born residents (%):
| North Little Rock: | 31.4% (821) |
| Arkansas: | 40.2% (61,075) |
| North Little Rock: | 18.8% (491) |
| Arkansas: | 10.7% (16,210) |
| North Little Rock: | 9.0% (235) |
| Arkansas: | 2.7% (4,128) |
| North Little Rock: | 6.7% (175) |
| Arkansas: | 0.1% (196) |
| North Little Rock: | 6.1% (159) |
| Arkansas: | 3.5% (5,376) |
| North Little Rock: | 2.4% (62) |
| Arkansas: | 0.2% (317) |
| North Little Rock: | 2.1% (55) |
| Arkansas: | 1.4% (2,174) |
| North Little Rock: | 2.1% (55) |
| Arkansas: | 1.0% (1,447) |
| North Little Rock: | 2.0% (52) |
| Arkansas: | 0.6% (889) |
| North Little Rock: | 1.9% (50) |
| Arkansas: | 0.2% (329) |
| North Little Rock: | 1.8% (46) |
| Arkansas: | 1.2% (1,813) |
| North Little Rock: | 1.6% (43) |
| Arkansas: | 0.8% (1,283) |
Place of birth for U.S.-born residents:
- This state: 42,258
- Other state: 19,695
- Northeast: 1,439
- Midwest: 5,470
- South: 9,146
- West: 3,622
84.0% of North Little Rock residents lived in the same house 1 years ago.
Out of people who lived in different houses, 34.3% lived in this county.
Out of people who lived in different counties, 60.8% lived in Arkansas.
| North Little Rock: | 84.0% |
| State average: | 87.0% |
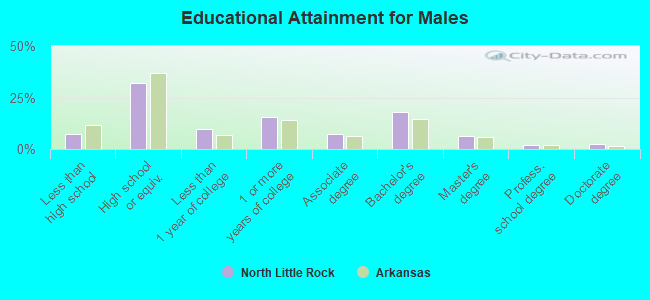
Education attainment for males 25 years and older:
- No schooling: 230
- Nursery to 4th grade: 23
- 5th and 6th grade: 134
- 7th and 8th grade: 205
- 9th grade: 216
- 10th grade: 220
- 11th grade: 280
- 12th grade, no diploma: 147
- High school graduate (or equivalency): 6,399
- Less than 1 year of college: 1,910
- Some college more than 1 year, no degree: 3,098
- Associate degree: 1,487
- Bachelor's degree: 3,587
- Master's degree: 1,281
- Professional school degree: 397
- Doctorate degree: 462
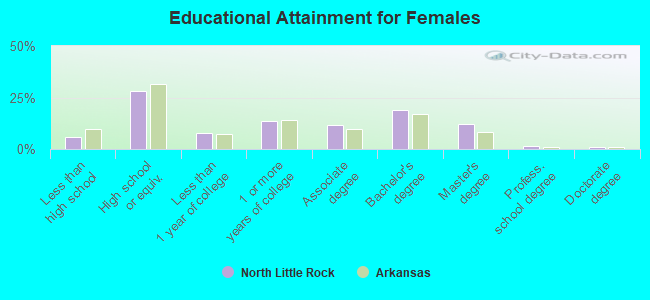
Education attainment for females 25 years and older:
- No schooling: 140
- Nursery to 4th grade: 105
- 5th and 6th grade: 71
- 7th and 8th grade: 121
- 9th grade: 218
- 10th grade: 230
- 11th grade: 345
- 12th grade, no diploma: 220
- High school graduate (or equivalency): 6,808
- Less than 1 year of college: 1,941
- Some college more than 1 year, no degree: 3,278
- Associate degree: 2,801
- Bachelor's degree: 4,637
- Master's degree: 2,936
- Professional school degree: 335
- Doctorate degree: 186
Housing units in structures:
- One, detached: 21,086
- One, attached: 603
- Two: 1,204
- 3 or 4: 1,728
- 5 to 9: 2,321
- 10 to 19: 3,180
- 20 to 49: 1,292
- 50 or more: 1,610
- Mobile homes: 485
- Boats, RVs, vans, etc.: 9
Median worth of mobile homes: $136,573
Housing units lacking complete kitchen facilities in 2022: 3.0%
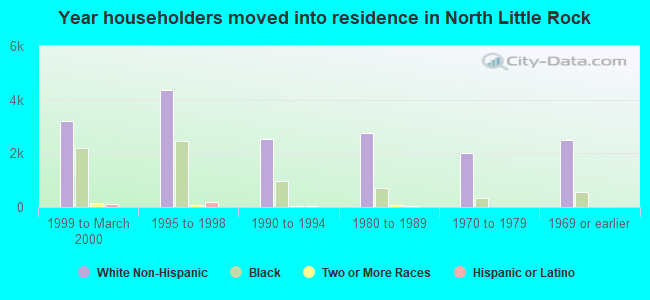
House/condo owner moved in on average 14 years ago
Renter moved in on average 3 years ago
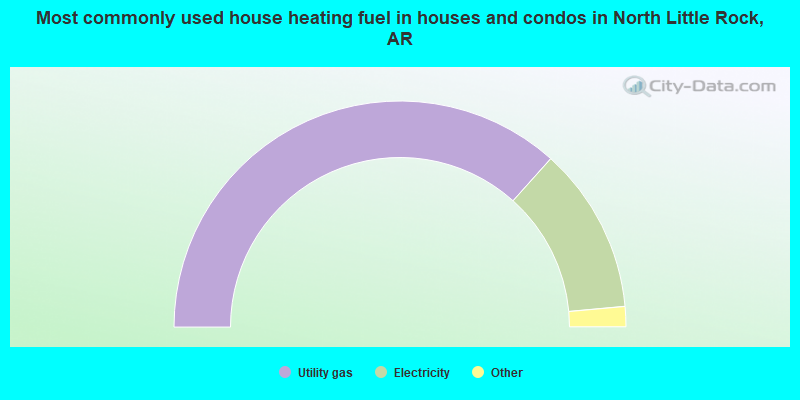
- 73.2%Utility gas
- 23.8%Electricity
- 2.3%Bottled, tank, or LP gas
- 0.3%Solar energy
- 0.2%Wood
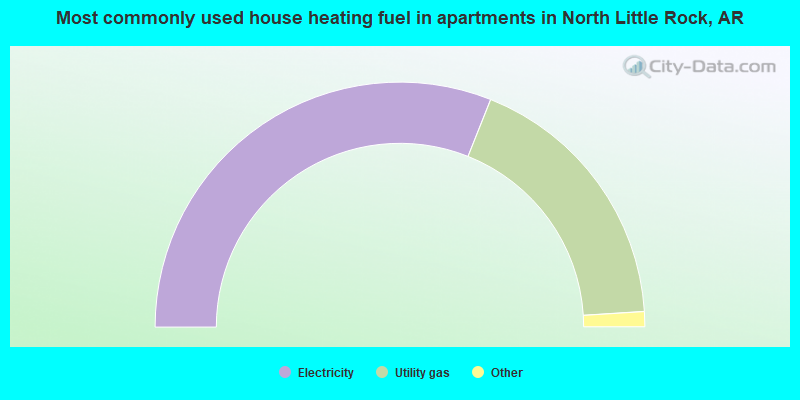
- 62.1%Electricity
- 35.9%Utility gas
- 1.5%Bottled, tank, or LP gas
- 0.4%No fuel used
Private vs. public school enrollment:
| Here: | 7.1% |
| Arkansas: | 10.5% |
| Here: | 6.9% |
| Arkansas: | 8.7% |
| Here: | 13.0% |
| Arkansas: | 19.4% |