Oakland, IL (Illinois) Houses and Residents
| Oakland: | $96,494 |
| Illinois: | $251,600 |
Mean price in 2022:
Detached houses: $104,132
Here: $104,132 State: $310,164 Mobile homes: $57,297
Here: $57,297 State: $78,855
Total population: 886 (Urban population: 0, Rural population: 975 (all nonfarm))
Houses: 500 (442 occupied: 341 owner occupied, 105 renter occupied)
| % of renters here: | 24% |
| State: | 33% |
Housing density: 610 houses/condos per square mile
Median price asked for vacant for-sale houses and condos in 2022 in this county: $156,202.
Median contract rent in 2022: $209 (lower quartile is $98, upper quartile is $316)
Median gross rent in Oakland, IL in 2022: $505
Housing units in Oakland with a mortgage: 172 (6 second mortgage, 0 home equity loan, 6 both second mortgage and home equity loan)
Houses without a mortgage: 0
Median household income for houses/condos with a mortgage: $65,528
Median household income for apartments without a mortgage: $57,928
Median monthly housing costs: $547
Compare current foreclosures near Oakland, IL:
| Photo | Address | Area | Beds / Baths | Price | Details |
|---|---|---|---|---|---|

|
#1
Danville Rd
Oakland, IL 61943
|
- sq. feet
|
- baths - beds |
show details | |

|
#2
W Main St
Oakland, IL 61943
|
- sq. feet
|
- baths - beds |
show details | |

|
#3
Harrison Street Rd
Charleston, IL 61920
|
2,708 sq. feet
|
1 baths 2 beds |
show details | |

|
#4
E Hancock St
Longview, IL 61852
|
2 sq. feet
|
1 baths 3 beds |
show details | |

|
#5
E 600th Rd
Paris, IL 61944
|
- sq. feet
|
2 baths 4 beds |
show details | |

|
#6
E Scott St
Tuscola, IL 61953
|
1,852 sq. feet
|
2 baths 3 beds |
show details | |

|
#7
N Pine St
Villa Grove, IL 61956
|
1,077 sq. feet
|
1 baths 2 beds |
show details | |

|
#8
S Spruce St
Villa Grove, IL 61956
|
1,200 sq. feet
|
1 baths 4 beds |
show details | |

|
#9
E Elm St
Villa Grove, IL 61956
|
1 sq. feet
|
1 baths 2 beds |
show details | |

|
#10
Polk Dr
Arcola, IL 61910
|
896 sq. feet
|
1 baths 3 beds |
show details |
| Photo | Address | Area | Beds / Baths | Price | Details |
|---|---|---|---|---|---|

|
#11
Lincoln Ave
Arcola, IL 61910
|
754 sq. feet
|
1 baths - beds |
show details | |

|
#12
E Ficklin St
Tuscola, IL 61953
|
- sq. feet
|
- baths - beds |
show details | |

|
#13
E Co Road N, 1400
Humboldt, IL 61931
|
- sq. feet
|
- baths - beds |
show details | |

|
#14
4th St
Charleston, IL 61920
|
- sq. feet
|
- baths - beds |
show details | |

|
#15
Division St
Charleston, IL 61920
|
- sq. feet
|
- baths - beds |
show details | |

|
#16
S Niles Ave
Tuscola, IL 61953
|
- sq. feet
|
- baths - beds |
show details | |

|
#17
Taurus Loop # 61a
Charleston, IL 61920
|
- sq. feet
|
- baths - beds |
show details | |

|
#18
Madison Ave Apt 8c
Charleston, IL 61920
|
- sq. feet
|
- baths - beds |
show details | |

|
#19
Country View Dr
Charleston, IL 61920
|
- sq. feet
|
- baths - beds |
show details | |

|
#20
Jackson Ave Apt 4
Charleston, IL 61920
|
- sq. feet
|
- baths - beds |
show details |
| Photo | Address | Area | Beds / Baths | Price | Details |
|---|---|---|---|---|---|

|
#21
18th St
Charleston, IL 61920
|
- sq. feet
|
- baths - beds |
show details | |

|
#22
Adams Ave
Charleston, IL 61920
|
- sq. feet
|
- baths - beds |
show details | |

|
#23
N Madison St
Kansas, IL 61933
|
- sq. feet
|
- baths - beds |
show details | |

|
#24
N Illinois St
Ashmore, IL 61912
|
- sq. feet
|
- baths - beds |
show details | |

|
#25
Eastgate Dr
Charleston, IL 61920
|
- sq. feet
|
- baths - beds |
show details | |

|
#26
Eastgate Dr
Charleston, IL 61920
|
- sq. feet
|
- baths - beds |
show details | |

|
#27
Harrison Ave
Charleston, IL 61920
|
- sq. feet
|
- baths - beds |
show details | |

|
#28
Suffolk Pl
Charleston, IL 61920
|
- sq. feet
|
- baths - beds |
show details | |

|
#29
Buchanan Ave
Charleston, IL 61920
|
- sq. feet
|
- baths - beds |
show details | |

|
#30
Douglas St
Charleston, IL 61920
|
- sq. feet
|
- baths - beds |
show details |
| Photo | Address | Area | Beds / Baths | Price | Details |
|---|---|---|---|---|---|

|
#31
Timothy Cir
Charleston, IL 61920
|
- sq. feet
|
- baths - beds |
show details | |

|
#32
Marion St
Charleston, IL 61920
|
- sq. feet
|
- baths - beds |
show details | |

|
#33
Davis St
Charleston, IL 61920
|
- sq. feet
|
- baths - beds |
show details | |

|
#34
W Locust Ave
Charleston, IL 61920
|
- sq. feet
|
- baths - beds |
show details | |

|
#35
Garfield Ave
Charleston, IL 61920
|
- sq. feet
|
- baths - beds |
show details | |

|
#36
Jackson Ave
Charleston, IL 61920
|
- sq. feet
|
- baths - beds |
show details | |

|
Check over 1 million property listings on Foreclosure.com!
|
browse all offers | |||

Latest news about housing in Oakland, IL collected exclusively by city-data.com from local newspapers, TV, and radio stations

 | Chicago Housing Market 2022 (216 replies) |
| Oakland neighborhood (2 replies) |
| CHICAGO population grows 2%, remains 3rd largest city (224 replies) |
| Best way to find Chicago apartments?...and neighborhood advice (34 replies) |
| What is the Beverly Hills of Chicago? (81 replies) |
| Generally, how is Chicago these days compared to prepandemic? (22 replies) |

Median year apartment built: 1980
Household type by relationship:
Households: 913- Male householders: 203 (62 living alone), Female householders: 230 (116 living alone)
175 spouses (175 opposite-sex spouses), 21 unmarried partners, (21 opposite-sex unmarried partners), 214 children (176 natural, 0 adopted, 37 stepchildren), 31 grandchildren, 3 brothers or sisters, 1 parents, 0 foster children, 0 other relatives, 30 non-relatives
Size of family households: 132 2-persons, 47 3-persons, 32 4-persons, 12 5-persons, 5 6-persons, 2 7-or-more-persons.
Size of nonfamily households: 188 1-person, 18 2-persons, 13 4-persons.
100 married couples with children.
83 single-parent households (72 men, 11 women).
99.5% of residents of Oakland speak English at home.
0.2% of residents speak other Indo-European language at home (100% speak English well).
Foreign born population: 4 (0.4%)
(100.0% of them are naturalized citizens)
| Here: | 6.4 |
| State: | 6.4 |
| Here: | 4.2 |
| State: | 4.1 |

- Bedrooms in owner-occupied houses and condos in Oakland, Illinois
- 0no bedroom
- 151 bedroom
- 792 bedrooms
- 1833 bedrooms
- 594 bedrooms
- 55+ bedrooms

- Bedrooms in renter-occupied apartments in Oakland, Illinois
- 0no bedroom
- 441 bedroom
- 272 bedrooms
- 353 bedrooms
- 04 bedrooms
- 05+ bedrooms

- Cars and other vehicles available in Oakland in owner-occupied houses/condos
- 24no vehicle
- 831 vehicle
- 1142 vehicles
- 883 vehicles
- 244 vehicles
- 85+ vehicles

- Cars and other vehicles available in Oakland in renter-occupied apartments
- 27no vehicle
- 701 vehicle
- 62 vehicles
- 23 vehicles
- 04 vehicles
- 05+ vehicles

- Rooms in owner-occupied houses in Oakland, Illinois
- 01 room
- 02 rooms
- 33 rooms
- 254 rooms
- 775 rooms
- 746 rooms
- 947 rooms
- 398 rooms
- 309+ rooms

- Rooms in renter-occupied apartments in Oakland, Illinois
- 01 room
- 382 rooms
- 63 rooms
- 124 rooms
- 115 rooms
- 76 rooms
- 327 rooms
- 08 rooms
- 09+ rooms


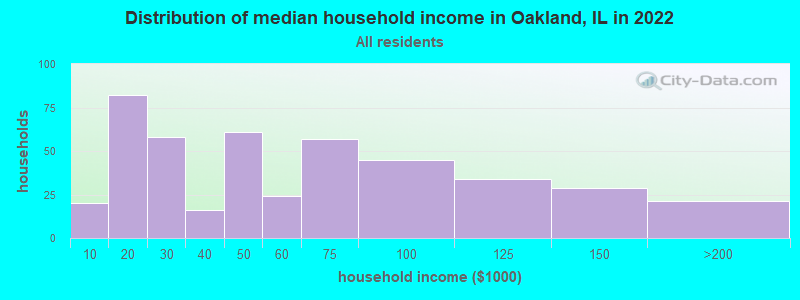
Oakland, IL household income distribution

- 20Less than $10,000
- 82$10,000 to $19,999
- 58$20,000 to $29,999
- 16$30,000 to $39,999
- 61$40,000 to $49,999
- 24$50,000 to $59,999
- 57$60,000 to $74,999
- 45$75,000 to $99,999
- 34$100,000 to $124,999
- 29$125,000 to $149,999
- 20$150,000 to $199,999
- 1$200,000 or more
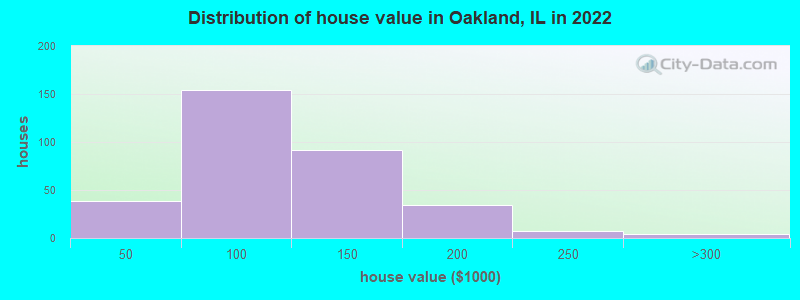
Home value of owner - occupied houses in 2022 in Oakland, IL
-
- 4$10,000 to $14,999
- 7$15,000 to $19,999
- 7$20,000 to $24,999
- 3$25,000 to $29,999
- 11$35,000 to $39,999
- 3$40,000 to $49,999
- 30$50,000 to $59,999
- 36$60,000 to $69,999
- 36$70,000 to $79,999
- 22$80,000 to $89,999
- 22$90,000 to $99,999
- 73$100,000 to $124,999
- 18$125,000 to $149,999
- 16$150,000 to $174,999
- 16$175,000 to $199,999
- 6$200,000 to $249,999
- 2$250,000 to $299,999
- 2$400,000 to $499,999
Rent paid by renters in 2022 in Oakland, IL
-
- 22Less than $100
- 12$100 to $149
- 29$200 to $249
- 9$300 to $349
- 6$400 to $449
- 9$450 to $499
- 2$500 to $549
- 0$550 to $599
- 4No cash rent


Percentage of workers working in this county: 54.7%
Number of people working at home: 52 (12.8% of all workers)
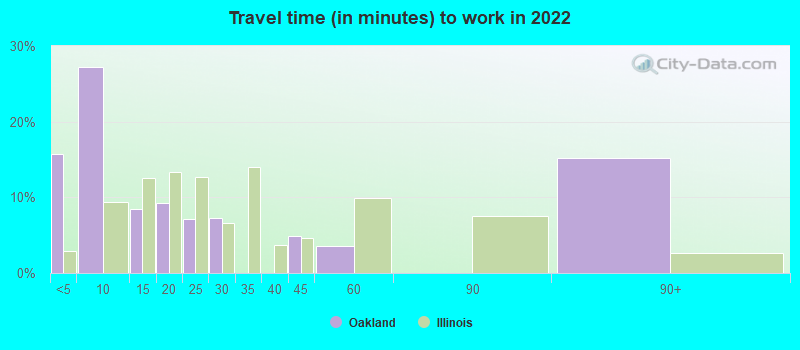
Travel time to work (commute)
- Less than 5 minutes: 56
- 5 to 9 minutes: 19
- 10 to 14 minutes: 12
- 15 to 19 minutes: 6
- 20 to 24 minutes: 95
- 25 to 29 minutes: 41
- 30 to 34 minutes: 45
- 35 to 39 minutes: 16
- 40 to 44 minutes: 22
- 45 to 59 minutes: 24
- 60 to 89 minutes: 8
- 90 or more minutes: 2
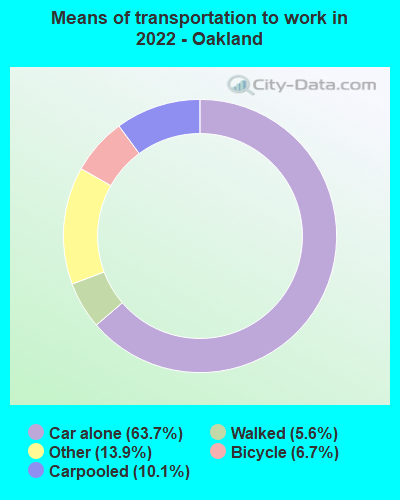
Means of transportation to work:
- Drove a car alone: 164 (53.2%)
- Carpooled: 27 (8.8%)
- Taxi: 39 (12.7%)
- Bicycle: 18 (5.8%)
- Walked: 14 (4.5%)
- Worked at home: 52 (16.9%)

- Unemployment by race in 2022
- Unemployment rate for White non-Hispanic residents
- 2.4%Males
- 3.9%Females

- Year of entry for the foreign-born population in Oakland, Illinois
- 02010 or later
- 02000 to 2009
- 41990 to 1999
- 101980 to 1989
- 21970 to 1979
- 0Before 1970

First ancestries reported:
- English: 75 (24.0%)
- German: 66 (21.1%)
- Irish: 60 (19.2%)
- American: 58 (18.6%)
- French: 11 (3.5%)
- Scottish: 8 (2.6%)
- European: 7 (2.2%)
- Italian: 4 (1.3%)
- British: 1 (0.3%)
- Dutch: 1 (0.3%)
Most common places of birth for foreign-born residents (%):
| Oakland: | 75.0% (3) |
| Illinois: | 0.6% (10,943) |
Place of birth for U.S.-born residents:
- This state: 731
- Other state: 140
- Northeast: 0
- Midwest: 55
- South: 61
- West: 23
88.1% of Oakland residents lived in the same house 1 years ago.
Out of people who lived in different houses, 29.1% lived in this county.
Out of people who lived in different counties, 50.8% lived in Illinois.
| Oakland: | 88.1% |
| State average: | 88.3% |
Education attainment for males 25 years and older:
- No schooling: 2
- Nursery to 4th grade: 0
- 5th and 6th grade: 0
- 7th and 8th grade: 7
- 9th grade: 0
- 10th grade: 7
- 11th grade: 1
- 12th grade, no diploma: 4
- High school graduate (or equivalency): 132
- Less than 1 year of college: 44
- Some college more than 1 year, no degree: 47
- Associate degree: 22
- Bachelor's degree: 27
- Master's degree: 5
- Professional school degree: 1
- Doctorate degree: 2

Education attainment for females 25 years and older:
- No schooling: 2
- Nursery to 4th grade: 0
- 5th and 6th grade: 0
- 7th and 8th grade: 1
- 9th grade: 0
- 10th grade: 0
- 11th grade: 0
- 12th grade, no diploma: 2
- High school graduate (or equivalency): 105
- Less than 1 year of college: 36
- Some college more than 1 year, no degree: 79
- Associate degree: 31
- Bachelor's degree: 42
- Master's degree: 13
- Professional school degree: 5
- Doctorate degree: 3


Housing units in structures:
- One, detached: 400
- 3 or 4: 54
- Mobile homes: 45
Median worth of mobile homes: $47,176
Housing units lacking complete kitchen facilities in 2022: 2.8%
House/condo owner moved in on average 8 years ago
Renter moved in on average 5 years ago

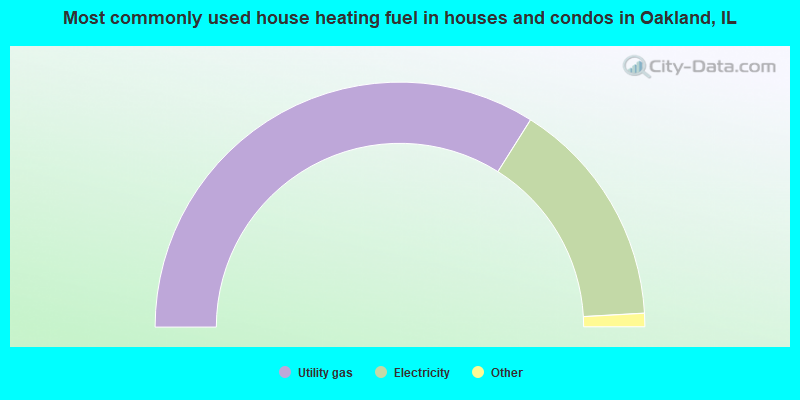
- 68.2%Utility gas
- 30.4%Electricity
- 0.9%Other fuel
- 0.6%Wood
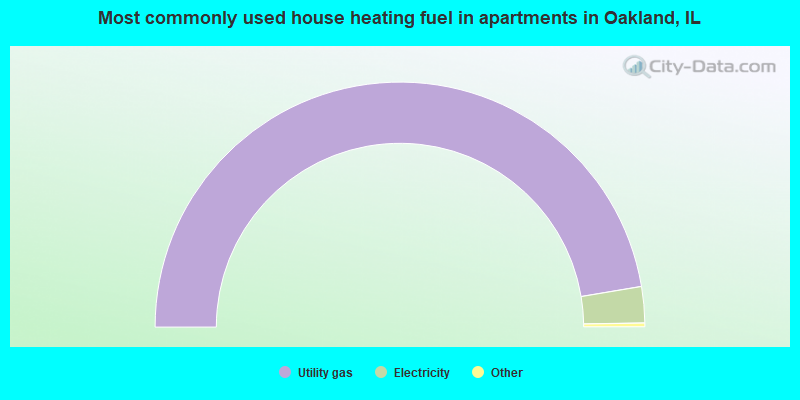
- 95.2%Utility gas
- 4.8%Electricity
Private vs. public school enrollment:
| Here: | 0.0% |
| Illinois: | 13.3% |
| Here: | 0.0% |
| Illinois: | 9.9% |
| Here: | 0.0% |
| Illinois: | 27.4% |


