Oakville, CT (Connecticut) Houses and Residents
| Oakville: | $280,806 |
| Connecticut: | $347,200 |
Mean price in 2022:
Detached houses: $264,031
Here: $264,031 State: $503,946 Townhouses or other attached units: $340,282
Here: $340,282 State: $304,959 In 2-unit structures: $378,600
Here: $378,600 State: $304,133 In 3-to-4-unit structures: $281,148
Here: $281,148 State: $272,970
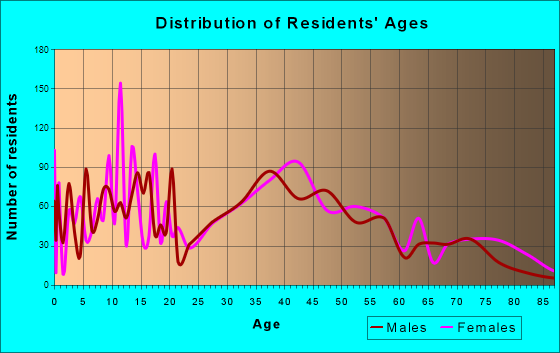
Total population: 9,047 (Urban population: 8,611, Rural population: 0)
Houses: 4,092 (3,878 occupied: 2,842 owner occupied, 1,078 renter occupied)
| % of renters here: | 28% |
| State: | 34% |
Housing density: 1,295 houses/condos per square mile
Median price asked for vacant for-sale houses and condos in 2022: $54,620.
Median contract rent in 2022: $965 (lower quartile is $824, upper quartile is $1,271)
Median gross rent in Oakville, CT in 2022: $1,305
Housing units in Oakville with a mortgage: 1,722 (153 second mortgage, 0 home equity loan, 106 both second mortgage and home equity loan)
Houses without a mortgage: 43
Median household income for houses/condos with a mortgage: $112,094
Median household income for apartments without a mortgage: $85,503
Median monthly housing costs: $1,361
Compare current foreclosures near Oakville, CT:
| Photo | Address | Area | Beds / Baths | Price | Details |
|---|---|---|---|---|---|

|
#1
Westview Dr
Oakville, CT 06779
|
1,200 sq. feet
|
1 baths 3 beds |
show details | |

|
#2
Sylvan Lake Rd
Oakville, CT 06779
|
1,182 sq. feet
|
1 baths 2 beds |
show details | |

|
#3
Pullen Ave
Oakville, CT 06779
|
1,548 sq. feet
|
2 baths 3 beds |
show details | |

|
#4
Hillside Ave
Oakville, CT 06779
|
2,110 sq. feet
|
1 baths 4 beds |
show details | |

|
#5
Shelter Hill Ave
Oakville, CT 06779
|
1,314 sq. feet
|
1 baths 4 beds |
show details | |

|
#6
Chestnut St
Naugatuck, CT 06770
|
1,012 sq. feet
|
1 baths 2 beds |
$300,000
|
show details |

|
#7
Bronson Ave
Meriden, CT 06451
|
1,150 sq. feet
|
1 baths 3 beds |
$299,900
|
show details |

|
#8
Wieting Rd
New Milford, CT 06776
|
3,210 sq. feet
|
3 baths 5 beds |
$549,900
|
show details |

|
#9
Woodbine St
Torrington, CT 06790
|
2,756 sq. feet
|
3 baths 6 beds |
$419,900
|
show details |

|
#10
Willis Ave
Meriden, CT 06450
|
1,008 sq. feet
|
1 baths 2 beds |
$299,900
|
show details |
| Photo | Address | Area | Beds / Baths | Price | Details |
|---|---|---|---|---|---|

|
#11
Amity Rd
Woodbridge, CT 06525
|
1,850 sq. feet
|
1 baths 3 beds |
$549,900
|
show details |

|
#12
Royal Oak Lane
Wallingford, CT 06492
|
2,607 sq. feet
|
2 baths 4 beds |
$684,900
|
show details |

|
#13
Birchwood Dr
Hamden, CT 06518
|
2,604 sq. feet
|
2 baths 3 beds |
$655,000
|
show details |

|
#14
N Star Dr
Seymour, CT 06483
|
1,670 sq. feet
|
2 baths 3 beds |
$424,900
|
show details |

|
#15
Janwood Rd
Waterbury, CT 06708
|
1,200 sq. feet
|
2 baths 3 beds |
$289,900
|
show details |

|
#16
Peck St
Berlin, CT 06037
|
608 sq. feet
|
1 baths 1 beds |
$159,900
|
show details |

|
#17
Partridge Dr
Seymour, CT 06483
|
1,500 sq. feet
|
1 baths 3 beds |
$300,000
|
show details |

|
#18
Pine Hill Rd
Thomaston, CT 06787
|
1,088 sq. feet
|
1 baths 2 beds |
show details | |

|
#19
Orient St
Meriden, CT 06450
|
1,780 sq. feet
|
3 baths 3 beds |
show details | |

|
#20
New Haven Rd Apt 10-J
Naugatuck, CT 06770
|
1,008 sq. feet
|
1 baths 2 beds |
show details |
| Photo | Address | Area | Beds / Baths | Price | Details |
|---|---|---|---|---|---|

|
#21
Pond St
New Britain, CT 06051
|
2,400 sq. feet
|
2 baths 6 beds |
show details | |

|
#22
New Haven Rd Apt 6-E
Naugatuck, CT 06770
|
1,008 sq. feet
|
1 baths 2 beds |
show details | |

|
#23
Marcia Dr
Torrington, CT 06790
|
1,496 sq. feet
|
2 baths 4 beds |
show details | |

|
#24
Dover Rd
New Britain, CT 06052
|
2,212 sq. feet
|
2 baths 3 beds |
show details | |

|
#25
Horne Cir
Southington, CT 06489
|
1,902 sq. feet
|
2 baths 4 beds |
show details | |

|
#26
Ranslow Dr
Wolcott, CT 06716
|
1,908 sq. feet
|
2 baths 4 beds |
show details | |

|
#27
Tom Swamp Rd
Hamden, CT 06518
|
2,008 sq. feet
|
2 baths 3 beds |
show details | |

|
#28
21 Webster St
New Britain, CT 06051
|
3 sq. feet
|
2 baths 6 beds |
show details | |

|
#29
Lydale Pl
Meriden, CT 06450
|
1,716 sq. feet
|
2 baths 3 beds |
show details | |

|
#30
Amity St
Meriden, CT 06450
|
1,568 sq. feet
|
2 baths 3 beds |
show details |
| Photo | Address | Area | Beds / Baths | Price | Details |
|---|---|---|---|---|---|

|
#31
Cambridge Ct
Beacon Falls, CT 06403
|
1,080 sq. feet
|
1 baths 2 beds |
show details | |

|
#32
Doran St
Waterbury, CT 06704
|
1,036 sq. feet
|
1 baths 3 beds |
show details | |

|
#33
Westview Street
Waterbury, CT 06706
|
1,284 sq. feet
|
1 baths 3 beds |
show details | |

|
#34
Governors Hill Rd
Oxford, CT 06478
|
2,106 sq. feet
|
2 baths 3 beds |
show details | |

|
#35
Avery Ave
Meriden, CT 06450
|
1,508 sq. feet
|
1 baths 3 beds |
show details | |

|
#36
Whitewood Rd
Waterbury, CT 06708
|
1,132 sq. feet
|
2 baths 3 beds |
show details | |

|
#37
Russell Rd
Bethany, CT 06524
|
3,787 sq. feet
|
3 baths 5 beds |
show details | |

|
#38
Main St
Meriden, CT 06451
|
1,008 sq. feet
|
1 baths 3 beds |
show details | |

|
#39
Bantam Rd
Bantam, CT 06750
|
2,943 sq. feet
|
1 baths 4 beds |
show details | |

|
#40
E Litchfield Rd S
Litchfield, CT 06759
|
1,353 sq. feet
|
1 baths 2 beds |
show details |
| Photo | Address | Area | Beds / Baths | Price | Details |
|---|---|---|---|---|---|

|
#41
Old Fairwood Rd
Bethany, CT 06524
|
2,464 sq. feet
|
4 baths 4 beds |
show details | |

|
#42
Benham St
Bristol, CT 06010
|
974 sq. feet
|
1 baths 3 beds |
show details | |

|
#43
Pratt St
Meriden, CT 06450
|
1,040 sq. feet
|
2 baths 3 beds |
show details | |

|
#44
Evansville Ave
Meriden, CT 06451
|
1,992 sq. feet
|
1 baths 3 beds |
show details | |

|
#45
Litchfield Rd
Harwinton, CT 06791
|
2,216 sq. feet
|
1 baths 3 beds |
show details | |

|
#46
Melinda Ln
Bristol, CT 06010
|
- sq. feet
|
2 baths 4 beds |
show details | |

|
#47
Sylvan Ave
Waterbury, CT 06706
|
1,350 sq. feet
|
1 baths 4 beds |
show details | |

|
#48
Fawn Meadow Dr
Naugatuck, CT 06770
|
3,052 sq. feet
|
3 baths 4 beds |
show details | |

|
#49
Seibert Dr
Terryville, CT 06786
|
1,392 sq. feet
|
2 baths 3 beds |
show details | |

|
Check over 1 million property listings on Foreclosure.com!
|
browse all offers | |||

Latest news about housing in Oakville, CT collected exclusively by city-data.com from local newspapers, TV, and radio stations


Median year apartment built: 1971
Household type by relationship:
Households: 9,425- Male householders: 1,940 (578 living alone), Female householders: 1,930 (639 living alone)
1,971 spouses (1,940 opposite-sex spouses), 115 unmarried partners, (115 opposite-sex unmarried partners), 2,642 children (2,545 natural, 38 adopted, 59 stepchildren), 28 grandchildren, 100 brothers or sisters, 199 parents, 0 foster children, 95 other relatives, 246 non-relatives
- In group quarters: 154
Size of family households: 1,229 2-persons, 438 3-persons, 512 4-persons, 203 5-persons, 13 6-persons, 25 7-or-more-persons.
Size of nonfamily households: 1,285 1-person, 204 2-persons, 11 3-persons.
1,314 married couples with children.
279 single-parent households (49 men, 230 women).
76.5% of residents of Oakville speak English at home.
9.9% of residents speak Spanish at home (70% speak English very well, 11% speak English well, 7% speak English not well, 12% don't speak English at all).
11.0% of residents speak other Indo-European language at home (70% speak English very well, 21% speak English well, 5% speak English not well, 4% don't speak English at all).
0.7% of residents speak Asian or Pacific Island language at home (100% speak English very well).
2.0% of residents speak other language at home (81% speak English very well, 19% speak English well).
Foreign born population: 1,294 (13.7%)
(78.4% of them are naturalized citizens)
| Here: | 6.3 |
| State: | 6.5 |
| Here: | 4.2 |
| State: | 4.0 |

- Bedrooms in owner-occupied houses and condos in Oakville, Connecticut
- 0no bedroom
- 841 bedroom
- 4452 bedrooms
- 1,4503 bedrooms
- 7434 bedrooms
- 1195+ bedrooms

- Bedrooms in renter-occupied apartments in Oakville, Connecticut
- 13no bedroom
- 3791 bedroom
- 2082 bedrooms
- 4573 bedrooms
- 214 bedrooms
- 05+ bedrooms

- Cars and other vehicles available in Oakville in owner-occupied houses/condos
- 107no vehicle
- 6421 vehicle
- 1,2932 vehicles
- 5103 vehicles
- 2414 vehicles
- 495+ vehicles

- Cars and other vehicles available in Oakville in renter-occupied apartments
- 205no vehicle
- 6761 vehicle
- 1052 vehicles
- 933 vehicles
- 04 vehicles
- 05+ vehicles

- Rooms in owner-occupied houses in Oakville, Connecticut
- 01 room
- 202 rooms
- 543 rooms
- 2074 rooms
- 4755 rooms
- 7996 rooms
- 5827 rooms
- 3488 rooms
- 3579+ rooms

- Rooms in renter-occupied apartments in Oakville, Connecticut
- 131 room
- 422 rooms
- 2143 rooms
- 3194 rooms
- 605 rooms
- 3066 rooms
- 937 rooms
- 208 rooms
- 129+ rooms


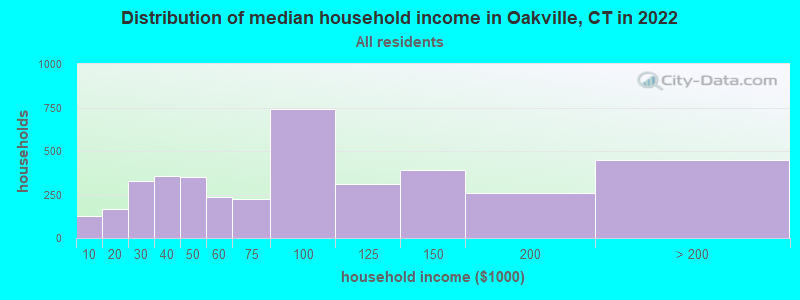
Oakville, CT household income distribution

- 127Less than $10,000
- 168$10,000 to $19,999
- 325$20,000 to $29,999
- 355$30,000 to $39,999
- 348$40,000 to $49,999
- 236$50,000 to $59,999
- 223$60,000 to $74,999
- 742$75,000 to $99,999
- 309$100,000 to $124,999
- 393$125,000 to $149,999
- 257$150,000 to $199,999
- 450$200,000 or more
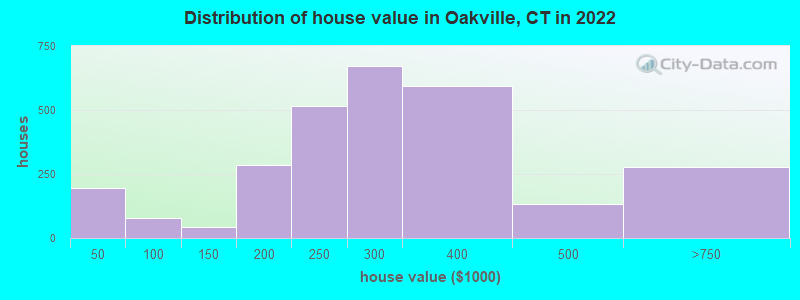
Home value of owner - occupied houses in 2022 in Oakville, CT
-
- 77Less than $10,000
- 14$10,000 to $14,999
- 20$15,000 to $19,999
- 30$25,000 to $29,999
- 21$35,000 to $39,999
- 29$40,000 to $49,999
- 5$50,000 to $59,999
- 44$80,000 to $89,999
- 12$100,000 to $124,999
- 31$125,000 to $149,999
- 154$150,000 to $174,999
- 132$175,000 to $199,999
- 515$200,000 to $249,999
- 671$250,000 to $299,999
- 594$300,000 to $399,999
- 133$400,000 to $499,999
- 278$500,000 to $749,999
Rent paid by renters in 2022 in Oakville, CT
-
- 18$200 to $249
- 13$250 to $299
- 9$300 to $349
- 31$500 to $549
- 6$550 to $599
- 28$650 to $699
- 20$700 to $749
- 58$750 to $799
- 210$800 to $899
- 167$900 to $999
- 183$1,000 to $1,249
- 74$1,250 to $1,499
- 159$1,500 to $1,999
- 12$2,000 to $2,499
- 107No cash rent


Percentage of workers working in this county: 67.3%
Number of people working at home: 286 (5.5% of all workers)
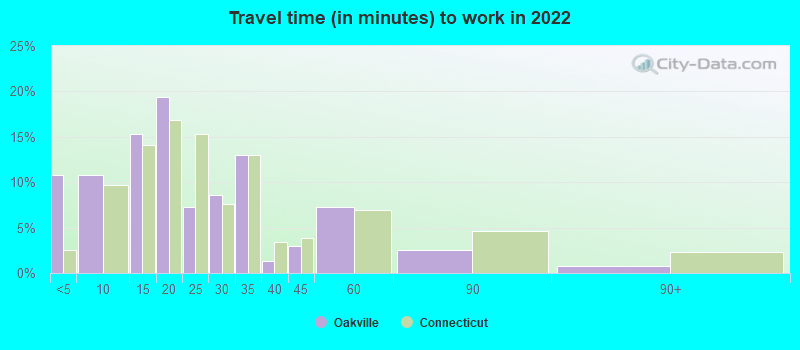
Travel time to work (commute)
- Less than 5 minutes: 250
- 5 to 9 minutes: 686
- 10 to 14 minutes: 771
- 15 to 19 minutes: 526
- 20 to 24 minutes: 619
- 25 to 29 minutes: 340
- 30 to 34 minutes: 530
- 35 to 39 minutes: 133
- 40 to 44 minutes: 157
- 45 to 59 minutes: 505
- 60 to 89 minutes: 221
- 90 or more minutes: 60
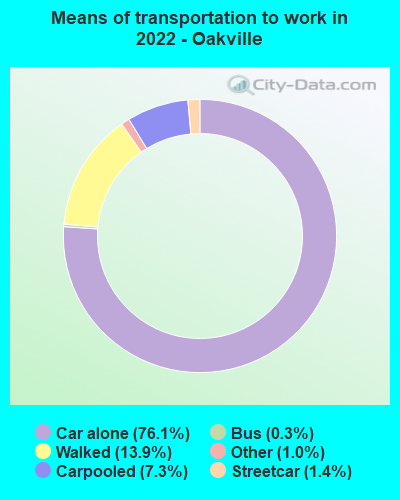
Means of transportation to work:
- Drove a car alone: 1,827 (66.4%)
- Carpooled: 187 (6.8%)
- Bus: 6 (0.2%)
- Subway or elevated rail: 59 (2.1%)
- Taxi: 29 (1.1%)
- Walked: 356 (12.9%)
- Worked at home: 286 (10.4%)

- Unemployment by race in 2022
- Unemployment rate for White non-Hispanic residents
- 1.5%Males
- 1.9%Females
- Unemployment rate for Black residents
- 100.0%Males

- Year of entry for the foreign-born population in Oakville, Connecticut
- 2062010 or later
- 3582000 to 2009
- 2571990 to 1999
- 1371980 to 1989
- 1481970 to 1979
- 376Before 1970

First ancestries reported:
- Italian: 1,300 (30.4%)
- Albanian: 302 (7.1%)
- French Canadian: 212 (5.0%)
- American: 194 (4.5%)
- Irish: 187 (4.4%)
- French: 182 (4.3%)
- Egyptian: 177 (4.1%)
- Polish: 161 (3.8%)
- Macedonian: 152 (3.6%)
- English: 97 (2.3%)
- Ukrainian: 90 (2.1%)
- Haitian: 68 (1.6%)
- Scottish: 67 (1.6%)
- German: 57 (1.3%)
- European: 54 (1.3%)
- Brazilian: 41 (1.0%)
- British West Indian: 40 (0.9%)
- Portuguese: 34 (0.8%)
- Lithuanian: 21 (0.5%)
- British: 13 (0.3%)
- Slovak: 12 (0.3%)
- Swiss: 7 (0.2%)
Most common places of birth for foreign-born residents (%):
| Oakville: | 31.1% (402) |
| Connecticut: | 2.8% (15,141) |
| Oakville: | 21.6% (279) |
| Connecticut: | 1.0% (5,447) |
| Oakville: | 13.9% (180) |
| Connecticut: | 0.3% (1,703) |
| Oakville: | 8.7% (113) |
| Connecticut: | 3.2% (17,617) |
| Oakville: | 7.2% (93) |
| Connecticut: | 0.7% (3,904) |
| Oakville: | 5.6% (72) |
| Connecticut: | 0.2% (1,333) |
| Oakville: | 4.7% (61) |
| Connecticut: | 0.9% (5,088) |
| Oakville: | 2.9% (38) |
| Connecticut: | 4.7% (25,461) |
| Oakville: | 2.5% (32) |
| Connecticut: | 1.9% (10,545) |
| Oakville: | 1.8% (23) |
| Connecticut: | 4.0% (21,729) |
| Oakville: | 1.7% (22) |
| Connecticut: | 0.7% (3,583) |
Place of birth for U.S.-born residents:
- This state: 6,206
- Other state: 1,369
- Northeast: 503
- Midwest: 272
- South: 411
- West: 159
96.0% of Oakville residents lived in the same house 1 years ago.
Out of people who lived in different houses, 38.9% lived in this county.
Out of people who lived in different counties, 0.0% lived in Connecticut.
| Oakville: | 96.0% |
| State average: | 88.4% |
Education attainment for males 25 years and older:
- No schooling: 67
- Nursery to 4th grade: 20
- 5th and 6th grade: 50
- 7th and 8th grade: 18
- 9th grade: 94
- 10th grade: 107
- 11th grade: 29
- 12th grade, no diploma: 53
- High school graduate (or equivalency): 1,367
- Less than 1 year of college: 288
- Some college more than 1 year, no degree: 413
- Associate degree: 247
- Bachelor's degree: 489
- Master's degree: 118
- Professional school degree: 120
- Doctorate degree: 14

Education attainment for females 25 years and older:
- No schooling: 57
- Nursery to 4th grade: 16
- 5th and 6th grade: 37
- 7th and 8th grade: 32
- 9th grade: 61
- 10th grade: 28
- 11th grade: 47
- 12th grade, no diploma: 16
- High school graduate (or equivalency): 961
- Less than 1 year of college: 267
- Some college more than 1 year, no degree: 284
- Associate degree: 505
- Bachelor's degree: 845
- Master's degree: 406
- Professional school degree: 25
- Doctorate degree: 94

Housing units in structures:
- One, detached: 2,989
- One, attached: 140
- Two: 276
- 3 or 4: 471
- 5 to 9: 148
- 10 to 19: 40
- 20 to 49: 7
- 50 or more: 18
House/condo owner moved in on average 18 years ago
Renter moved in on average 7 years ago

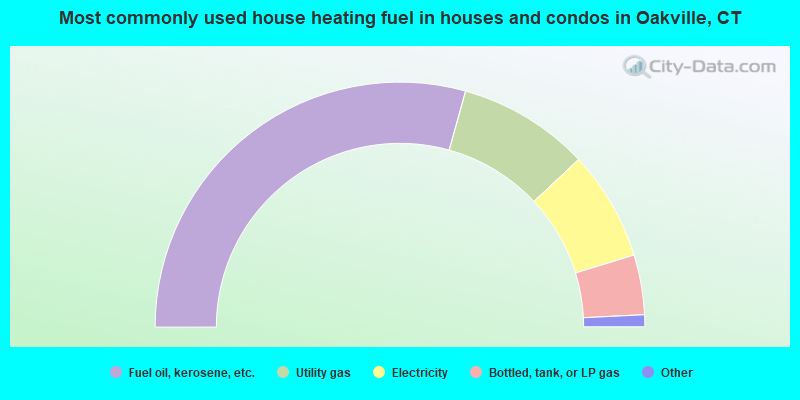
- 58.7%Fuel oil, kerosene, etc.
- 17.4%Utility gas
- 14.5%Electricity
- 7.9%Bottled, tank, or LP gas
- 0.9%Other fuel
- 0.6%Solar energy
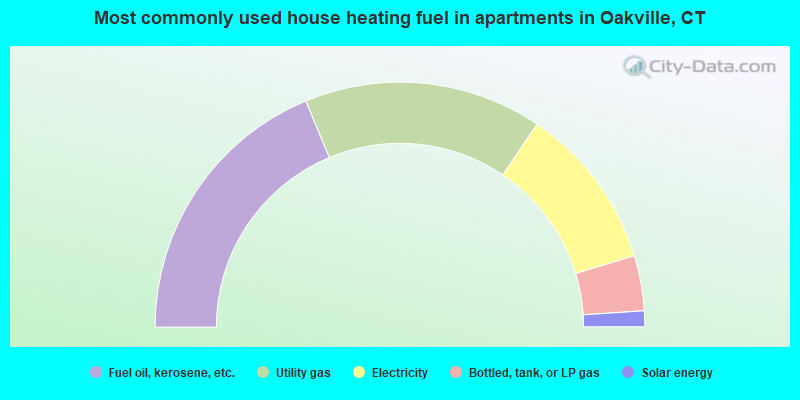
- 37.5%Fuel oil, kerosene, etc.
- 31.5%Utility gas
- 21.7%Electricity
- 7.3%Bottled, tank, or LP gas
- 2.1%Solar energy
Private vs. public school enrollment:
| Here: | 3.6% |
| Connecticut: | 9.5% |
| Here: | 10.3% |
| Connecticut: | 12.9% |
| Here: | 26.1% |
| Connecticut: | 35.5% |


