Ontario, CA (California) Houses and Residents
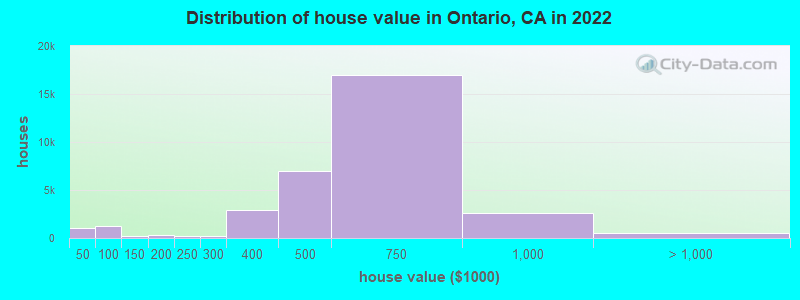
Estimated median house or condo value in 2022: $584,600 (it was $136,300 in 2000 )
Ontario:
$584,600California:
$715,900
Lower value quartile - upper value quartile: $444,400 - $706,100Mean price in 2022: Detached houses: $606,654 Here:
$606,654State:
$988,808
Townhouses or other attached units: $494,330 Here:
$494,330State:
$838,546
In 2-unit structures: $473,308 Here:
$473,308State:
$1,138,100
In 3-to-4-unit structures: $456,555 Here:
$456,555State:
$824,253
In 5-or-more-unit structures: $371,878 Here:
$371,878State:
$730,996
Mobile homes: $140,027 Here:
$140,027State:
$184,506
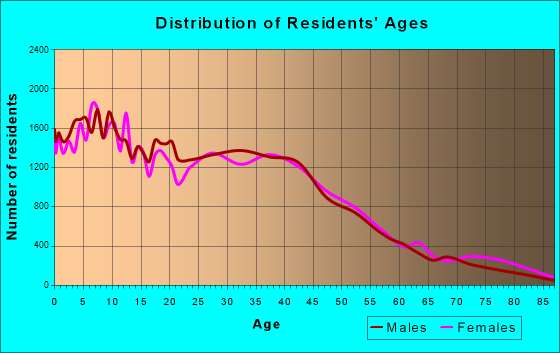
Total population: 169,089 (Urban population: 155,715, Rural population: 1,624 (420 farm, 1,204 nonfarm ))
Houses: 56,012 (52,947 occupied: 31,365 owner occupied, 21,582 renter occupied )
% of renters here:
41%State:
44%
Housing density: 1,125 houses/condos per square mile
Median price asked for vacant for-sale houses and condos in 2022: $1,213,288.
Median contract rent in 2022: $1,740 (lower quartile is $1,360, upper quartile is over $2,000)
Median rent asked for vacant for-rent units in 2022: $1,732
Median gross rent in Ontario, CA in 2022: $1,878
Housing units in Ontario with a mortgage: 22,874 (1,537 second mortgage, 49 home equity loan, 1,330 both second mortgage and home equity loan )Houses without a mortgage: 170
Median household income for houses/condos with a mortgage: $111,705
Median household income for apartments without a mortgage: $69,854
Median monthly housing costs: $1,873
Data:
Median house or condo value ($)
Median house or condo value ($ change since 2000)
Median house or condo value ($) - White
Median house or condo value ($) - Black or African American
Median house or condo value ($) - Asian
Median house or condo value ($) - Hispanic or Latino
Median house or condo value ($) - American Indian and Alaska Native
Median house or condo value ($) - Multirace
Median house or condo value ($) - Other Race
Median price asked for mobile homes ($)
Household density (households per square mile)
Mean house or condo value by units in structure - 1, detached ($)
Mean house or condo value by units in structure - 1, attached ($)
Mean house or condo value by units in structure - 2 ($)
Mean house or condo value by units in structure by units in structure - 3 or 4 ($)
Mean house or condo value by units in structure - 5 or more ($)
Mean house or condo value by units in structure - Boat, RV, van, etc. ($)
Mean house or condo value by units in structure - Mobile home ($)
Median contract rent ($)
Median contract rent - Lower quartile ($)
Median contract rent - Upper quartile ($)
Median gross rent ($)
Urban houses (%)
Rural houses (%)
Houses occupied (%)
Houses occupied (% change since 2000)
Houses owner occupied (%)
Houses owner occupied (% change since 2000)
Houses renter occupied (%)
Houses renter occupied (% change since 2000)
Vacant housing units - For rent (%)
Vacant housing units - For rent (% change since 2000)
Vacant housing units - For sale only (%)
Vacant housing units - For sale only (% change since 2000)
Vacant housing units - Rented or sold, not occupied (%)
Vacant housing units - Rented or sold, not occupied (% change since 2000)
Vacant housing units - For seasonal, recreational, or occasional use (%)
Vacant housing units - For seasonal, recreational, or occasional use (% change since 2000)
Vacant housing units - For migrant workers (%)
Vacant housing units - For migrant workers (% change since 2000)
Vacant housing units - Other vacant (%)
Vacant housing units - Other vacant (% change since 2000)
Median monthly housing costs ($)
Median household income for houses/condos with a mortgage ($)
Median household income for houses/condos without a mortgage ($)
Median household income ($)
Median household income ($) - White
Median household income ($) - Black or African American
Median household income ($) - Asian
Median household income ($) - Hispanic or Latino
Median household income ($) - American Indian and Alaska Native
Median household income ($) - Multirace
Median household income ($) - Other Race
Mortgage status - with mortgage (%)
Mortgage status - with second mortgage (%)
Mortgage status - with home equity loan (%)
Mortgage status - with both second mortgage and home equity loan (%)
Mortgage status - without a mortgage (%)
Median year house/condo built
Median year apartment built
Household type by relationship - Male householder living alone (%)
Household type by relationship - Male householder not living alone (%)
Household type by relationship - Female householder living alone (%)
Household type by relationship - Female householder not living alone (%)
Household type by relationship - Opposite-Sex spouse (%)
Household type by relationship - Same-Sex spouse (%)
Household type by relationship - Opposite-Sex unmarried partner (%)
Household type by relationship - Same-Sex unmarried partner (%)
Household type by relationship - In group quarters (%)
Size of family households - 2-person household (%)
Size of family households - 3-person household (%)
Size of family households - 4-person household (%)
Size of family households - 5-person household (%)
Size of family households - 6-person household (%)
Size of family households - 7-or-more-person household (%)
Size of nonfamily households - 1-person household (%)
Size of nonfamily households - 2-person household (%)
Size of nonfamily households - 3-person household (%)
Size of nonfamily households - 4-person household (%)
Size of nonfamily households - 5-person household (%)
Size of nonfamily households - 6-person household (%)
Size of nonfamily households - 7-or-moreperson household (%)
Year house built - Built 2010 or later (%)
Year house built - Built 2000 to 2009 (%)
Year house built - Built 1990 to 1999 (%)
Year house built - Built 1980 to 1989 (%)
Year house built - Built 1970 to 1979 (%)
Year house built - Built 1960 to 1969 (%)
Year house built - Built 1950 to 1959 (%)
Year house built - Built 1940 to 1949 (%)
Year house built - Built 1939 or earlier (%)
Median number of rooms in houses and condos
Median number of rooms in apartments
Median number of bedrooms in owner occupied houses
Mean number of bedrooms in owner occupied houses
Median number of bedrooms in renter occupied houses
Mean number of bedrooms in renter occupied houses
Median number of vehichles in owner occupied houses
Mean number of vehichles in owner occupied houses
Median number of vehichles in renter occupied houses
Mean number of vehichles in renter occupied houses
Rooms in owner-occupied houses - 1 room (%)
Rooms in owner-occupied houses - 2 rooms (%)
Rooms in owner-occupied houses - 3 rooms (%)
Rooms in owner-occupied houses - 4 rooms (%)
Rooms in owner-occupied houses - 5 rooms (%)
Rooms in owner-occupied houses - 6 rooms (%)
Rooms in owner-occupied houses - 7 rooms (%)
Rooms in owner-occupied houses - 8 rooms (%)
Rooms in owner-occupied houses - 9+ rooms (%)
Rooms in renter-occupied houses - 1 room (%)
Rooms in renter-occupied houses - 2 rooms (%)
Rooms in renter-occupied houses - 3 rooms (%)
Rooms in renter-occupied houses - 4 rooms (%)
Rooms in renter-occupied houses - 5 rooms (%)
Rooms in renter-occupied houses - 6 rooms (%)
Rooms in renter-occupied houses - 7 rooms (%)
Rooms in renter-occupied houses - 8 rooms (%)
Rooms in renter-occupied houses - 9+ rooms (%)
Bedrooms in owner-occupied houses - no bedrooms (%)
Bedrooms in owner-occupied houses - 1 bedroom (%)
Bedrooms in owner-occupied houses - 2 bedrooms (%)
Bedrooms in owner-occupied houses - 3 bedrooms (%)
Bedrooms in owner-occupied houses - 4 bedrooms (%)
Bedrooms in owner-occupied houses - 5+ bedrooms (%)
Bedrooms in renter-occupied houses - no bedrooms (%)
Bedrooms in renter-occupied houses - 1 bedroom (%)
Bedrooms in renter-occupied houses - 2 bedrooms (%)
Bedrooms in renter-occupied houses - 3 bedrooms (%)
Bedrooms in renter-occupied houses - 4 bedrooms (%)
Bedrooms in renter-occupied houses - 5+ bedrooms (%)
Vehicles available in owner-occupied houses - no vehicle available (%)
Vehicles available in owner-occupied houses - 1 vehicle available(%)
Vehicles available in owner-occupied houses - 2 Vehicles available (%)
Vehicles available in owner-occupied houses - 3 Vehicles available (%)
Vehicles available in owner-occupied houses - 4 Vehicles available (%)
Vehicles available in owner-occupied houses - 5+ Vehicles available (%)
Vehicles available in renter-occupied houses - no vehicle available (%)
Vehicles available in renter-occupied houses - 1 vehicle available (%)
Vehicles available in renter-occupied houses - 2 Vehicles available (%)
Vehicles available in renter-occupied houses - 3 Vehicles available (%)
Vehicles available in renter-occupied houses - 4 Vehicles available (%)
Vehicles available in renter-occupied houses - 5+ Vehicles available (%)
Housing units in structures - 1, detached (%)
Housing units in structures - 1, attached (%)
Housing units in structures - 2 (%)
Housing units in structures - 3 or 4 (%)
Housing units in structures - 5 to 9 (%)
Housing units in structures - 10 to 19 (%)
Housing units in structures - 20 to 49 (%)
Housing units in structures - 50 or more (%)
Housing units in structures - Mobile home (%)
Housing units in structures - Boat, RV, van, etc. (%)
Housing units in structures - Owners - 1, detached (%)
Housing units in structures - Owners - 1, attached (%)
Housing units in structures - Owners - 2 (%)
Housing units in structures - Owners - 3 or 4 (%)
Housing units in structures - Owners - 5 to 9 (%)
Housing units in structures - Owners - 10 to 19 (%)
Housing units in structures - Owners - 20 to 49 (%)
Housing units in structures - Owners - 50 or more (%)
Housing units in structures - Owners - Mobile home (%)
Housing units in structures - Owners - Boat, RV, van, etc. (%)
Housing units in structures - Renters - 1, detached (%)
Housing units in structures - Renters - 1, attached (%)
Housing units in structures - Renters - 2 (%)
Housing units in structures - Renters - 3 or 4 (%)
Housing units in structures - Renters - 5 to 9 (%)
Housing units in structures - Renters - 10 to 19 (%)
Housing units in structures - Renters - 20 to 49 (%)
Housing units in structures - Renters - 50 or more (%)
Housing units in structures - Renters - Mobile home (%)
Housing units in structures - Renters - Boat, RV, van, etc. (%)
House/condo owner moved in on average (years ago)
Renter moved in on average (years ago)
Year householder moved into unit - Moved in 1999 to March 2000 (%)
Year householder moved into unit - Moved in 1999 to March 2000 (%) - White
Year householder moved into unit - Moved in 1999 to March 2000 (%) - Black or African American
Year householder moved into unit - Moved in 1999 to March 2000 (%) - Asian
Year householder moved into unit - Moved in 1999 to March 2000 (%) - Hispanic or Latino
Year householder moved into unit - Moved in 1999 to March 2000 (%) - American Indian and Alaska Native
Year householder moved into unit - Moved in 1999 to March 2000 (%) - Multirace
Year householder moved into unit - Moved in 1999 to March 2000 (%) - Other Race
Year householder moved into unit - Moved in 1995 to 1998 (%)
Year householder moved into unit - Moved in 1995 to 1998 (%) - White
Year householder moved into unit - Moved in 1995 to 1998 (%) - Black or African American
Year householder moved into unit - Moved in 1995 to 1998 (%) - Asian
Year householder moved into unit - Moved in 1995 to 1998 (%) - Hispanic or Latino
Year householder moved into unit - Moved in 1995 to 1998 (%) - American Indian and Alaska Native
Year householder moved into unit - Moved in 1995 to 1998 (%) - Multirace
Year householder moved into unit - Moved in 1995 to 1998 (%) - Other Race
Year householder moved into unit - Moved in 1990 to 1994 (%)
Year householder moved into unit - Moved in 1990 to 1994 (%) - White
Year householder moved into unit - Moved in 1990 to 1994 (%) - Black or African American
Year householder moved into unit - Moved in 1990 to 1994 (%) - Asian
Year householder moved into unit - Moved in 1990 to 1994 (%) - Hispanic or Latino
Year householder moved into unit - Moved in 1990 to 1994 (%) - American Indian and Alaska Native
Year householder moved into unit - Moved in 1990 to 1994 (%) - Multirace
Year householder moved into unit - Moved in 1990 to 1994 (%) - Other Race
Year householder moved into unit - Moved in 1980 to 1989 (%)
Year householder moved into unit - Moved in 1980 to 1989 (%) - White
Year householder moved into unit - Moved in 1980 to 1989 (%) - Black or African American
Year householder moved into unit - Moved in 1980 to 1989 (%) - Asian
Year householder moved into unit - Moved in 1980 to 1989 (%) - Hispanic or Latino
Year householder moved into unit - Moved in 1980 to 1989 (%) - American Indian and Alaska Native
Year householder moved into unit - Moved in 1980 to 1989 (%) - Multirace
Year householder moved into unit - Moved in 1980 to 1989 (%) - Other Race
Year householder moved into unit - Moved in 1970 to 1979 (%)
Year householder moved into unit - Moved in 1970 to 1979 (%) - White
Year householder moved into unit - Moved in 1970 to 1979 (%) - Black or African American
Year householder moved into unit - Moved in 1970 to 1979 (%) - Asian
Year householder moved into unit - Moved in 1970 to 1979 (%) - Hispanic or Latino
Year householder moved into unit - Moved in 1970 to 1979 (%) - American Indian and Alaska Native
Year householder moved into unit - Moved in 1970 to 1979 (%) - Multirace
Year householder moved into unit - Moved in 1970 to 1979 (%) - Other Race
Year householder moved into unit - Moved in 1969 or earlier (%)
Year householder moved into unit - Moved in 1969 or earlier (%) - White
Year householder moved into unit - Moved in 1969 or earlier (%) - Black or African American
Year householder moved into unit - Moved in 1969 or earlier (%) - Asian
Year householder moved into unit - Moved in 1969 or earlier (%) - Hispanic or Latino
Year householder moved into unit - Moved in 1969 or earlier (%) - American Indian and Alaska Native
Year householder moved into unit - Moved in 1969 or earlier (%) - Multirace
Year householder moved into unit - Moved in 1969 or earlier (%) - Other Race
Housing units lacking complete plumbing facilities (%)
Housing units lacking complete kitchen facilities (%)
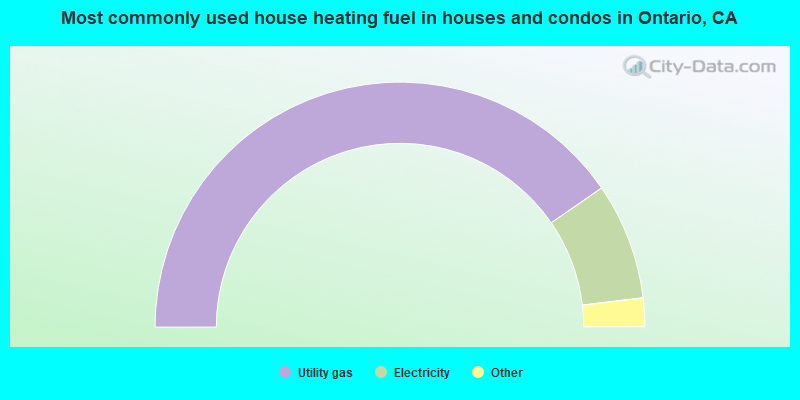
House heating fuel used in houses and condos - Utility gas (%)
House heating fuel used in houses and condos - Bottled, tank, or LP gas (%)
House heating fuel used in houses and condos - Electricity (%)
House heating fuel used in houses and condos - Fuel oil, kerosene, etc. (%)
House heating fuel used in houses and condos - Coal or coke (%)
House heating fuel used in houses and condos - Wood (%)
House heating fuel used in houses and condos - Solar energy (%)
House heating fuel used in houses and condos - Other fuel (%)
House heating fuel used in houses and condos - No fuel used (%)
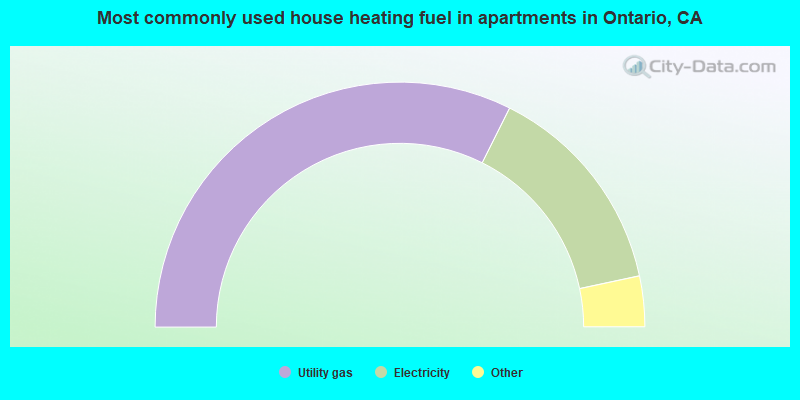
House heating fuel used in apartments - Utility gas (%)
House heating fuel used in apartments - Bottled, tank, or LP gas (%)
House heating fuel used in apartments - Electricity (%)
House heating fuel used in apartments - Fuel oil, kerosene, etc. (%)
House heating fuel used in apartments - Coal or coke (%)
House heating fuel used in apartments - Wood (%)
House heating fuel used in apartments - Solar energy (%)
House heating fuel used in apartments - Other fuel (%)
House heating fuel used in apartments - No fuel used (%)
Latest news about housing in Ontario, CA collected exclusively by city-data.com from local newspapers, TV, and radio stations
Median year house/condo built: 1977Median year apartment built: 1984Household type by relationship:
Households: 179,062
Male householders: 26,814 (4,822 living alone ), Female householders: 26,133 (4,413 living alone )24,491 spouses (24,391 opposite-sex spouses ), 3,784 unmarried partners , (3,738 opposite-sex unmarried partners ), 63,095 children (60,252 natural , 1,774 adopted , 1,069 stepchildren ), 8,630 grandchildren , 5,156 brothers or sisters , 6,060 parents , 568 foster children , 6,391 other relatives , 6,950 non-relatives In group quarters: 990
Size of family households: 9,842 2-persons , 9,552 3-persons , 8,496 4-persons , 6,882 5-persons , 2,898 6-persons , 2,338 7-or-more-persons .
Size of nonfamily households: 9,235 1-person , 2,422 2-persons , 578 3-persons , 214 4-persons , 326 5-persons , 72 6-persons , 92 7-or-more-persons .
22,292 married couples with children. single-parent households (2,961 men , 8,164 women ).
43.2% of residents of Ontario speak English at home. of residents speak Spanish at home (62% speak English very well , 19% speak English well , 13% speak English not well , 7% don't speak English at all ).of residents speak other Indo-European language at home (69% speak English very well , 28% speak English well , 3% speak English not well ).of residents speak Asian or Pacific Island language at home (45% speak English very well , 29% speak English well , 20% speak English not well , 5% don't speak English at all ).of residents speak other language at home (58% speak English very well , 32% speak English well , 8% speak English not well , 3% don't speak English at all ).
Foreign born population: 47,701 (26.6%)of them are naturalized citizens )
Median number of rooms in houses and condos:
Median number of rooms in apartments
Owner-occupied Renter-occupied
Bedrooms in owner-occupied houses and condos in Ontario, California
213 no bedroom 148 1 bedroom 6,051 2 bedrooms 13,622 3 bedrooms 10,742 4 bedrooms 589 5+ bedrooms
Bedrooms in renter-occupied apartments in Ontario, California
2,871 no bedroom 4,219 1 bedroom 9,143 2 bedrooms 3,874 3 bedrooms 1,149 4 bedrooms 326 5+ bedrooms
Owner-occupied Renter-occupied
Cars and other vehicles available in Ontario in owner-occupied houses/condos
1,048 no vehicle 5,210 1 vehicle 11,428 2 vehicles 7,046 3 vehicles 3,992 4 vehicles 2,641 5+ vehicles
Cars and other vehicles available in Ontario in renter-occupied apartments
1,822 no vehicle 7,462 1 vehicle 7,668 2 vehicles 2,921 3 vehicles 1,377 4 vehicles 332 5+ vehicles
Owner-occupied Renter-occupied
Rooms in owner-occupied houses in Ontario, California
167 1 room 82 2 rooms 1,071 3 rooms 3,008 4 rooms 9,317 5 rooms 6,928 6 rooms 4,458 7 rooms 4,029 8 rooms 2,305 9+ rooms
Rooms in renter-occupied apartments in Ontario, California
2,871 1 room 1,348 2 rooms 4,193 3 rooms 6,459 4 rooms 2,942 5 rooms 1,677 6 rooms 895 7 rooms 789 8 rooms 408 9+ rooms
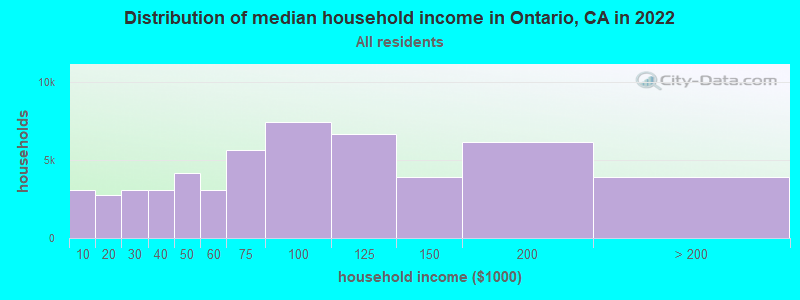
Ontario, CA household income distribution 3,108 Less than $10,0002,739 $10,000 to $19,9993,055 $20,000 to $29,9993,087 $30,000 to $39,9994,182 $40,000 to $49,9993,073 $50,000 to $59,9995,643 $60,000 to $74,9997,443 $75,000 to $99,9996,658 $100,000 to $124,9993,902 $125,000 to $149,9996,135 $150,000 to $199,9993,922 $200,000 or more
Home value of owner - occupied houses in 2022 in Ontario, CA 309 Less than $10,00027 $10,000 to $14,99964 $15,000 to $19,99929 $20,000 to $24,99960 $25,000 to $29,999128 $30,000 to $34,99937 $35,000 to $39,999377 $40,000 to $49,999345 $50,000 to $59,999100 $60,000 to $69,999197 $70,000 to $79,999199 $80,000 to $89,99976 $90,000 to $99,999156 $100,000 to $124,99962 $125,000 to $149,999150 $150,000 to $174,999110 $175,000 to $199,999191 $200,000 to $249,999245 $250,000 to $299,9992,911 $300,000 to $399,9996,950 $400,000 to $499,99916,983 $500,000 to $749,9992,611 $750,000 to $999,999423 $1,000,000 to $1,499,99947 $1,500,000 to $1,999,99997 $2,000,000 or moreRent paid by renters in 2022 in Ontario, CA 44 Less than $1004 $150 to $199119 $200 to $24941 $250 to $29934 $300 to $34962 $400 to $449109 $450 to $499149 $500 to $54932 $550 to $599189 $600 to $64986 $650 to $699225 $700 to $749127 $750 to $799441 $800 to $899347 $900 to $9992,406 $1,000 to $1,2493,425 $1,250 to $1,4998,393 $1,500 to $1,9994,737 $2,000 to $2,4991,157 $2,500 to $2,999276 $3,000 to $3,49918 $3,500 or more629 No cash rent
Percentage of workers working in this county: 65.0%Number of people working at home: 8,383 (10.0% of all workers )
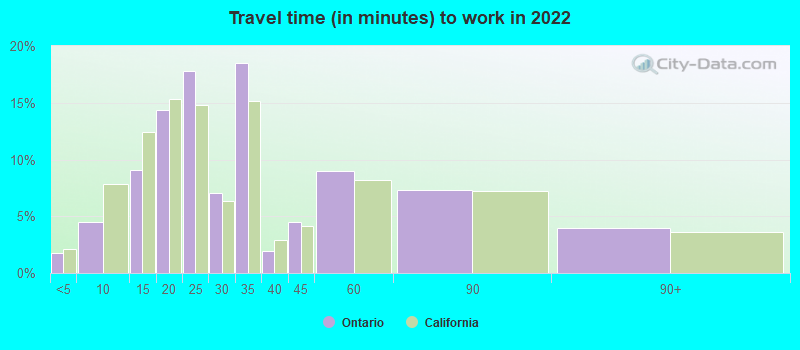
Travel time to work (commute)
Less than 5 minutes: 1,2585 to 9 minutes: 3,22310 to 14 minutes: 8,39415 to 19 minutes: 12,69420 to 24 minutes: 10,11225 to 29 minutes: 3,20230 to 34 minutes: 13,26135 to 39 minutes: 2,13540 to 44 minutes: 2,04945 to 59 minutes: 8,38060 to 89 minutes: 6,67990 or more minutes: 3,668
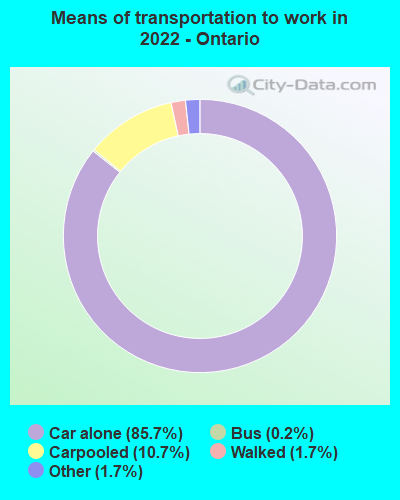
Means of transportation to work:
Drove a car alone: 103,373 (80.1%)Carpooled: 12,955 (10.0%)Bus : 184 (0.1%)Taxi: 2,063 (1.6%)Bicycle: 55 (0.0%)Walked: 2,062 (1.6%)Worked at home: 8,383 (6.5%)
Unemployment by race in 2022
Unemployment rate for White non-Hispanic residents 8.5% Males4.2% FemalesUnemployment rate for Black residents 3.5% Males7.7% FemalesUnemployment rate for American Indian and Alaska Native residents 2.5% Males6.4% FemalesUnemployment rate for Asian residents 1.6% Males1.8% FemalesUnemployment rate for other race residents 4.3% Males6.6% FemalesUnemployment rate for two or more race residents 6.8% Males4.7% FemalesUnemployment rate for Hispanic or Latino residents 5.0% Males5.6% Females
Year of entry for the foreign-born population in Ontario, California
8,655 2010 or later 11,478 2000 to 2009 12,268 1990 to 1999 17,152 1980 to 1989 9,232 1970 to 1979 4,698 Before 1970
First ancestries reported:
American: 2,496 (2.1%)
German: 1,326 (1.1%)
English: 1,209 (1.0%)
Irish: 905 (0.7%)
Italian: 827 (0.7%)
Dutch: 753 (0.6%)
European: 469 (0.4%)
Nigerian: 371 (0.3%)
African: 345 (0.3%)
Armenian: 320 (0.3%)
Scotch-Irish: 281 (0.2%)
Egyptian: 246 (0.2%)
Portuguese: 221 (0.2%)
French: 206 (0.2%)
Ghanaian: 186 (0.2%)
Norwegian: 166 (0.1%)
Palestinian: 118 (0.10%)
Polish: 102 (0.08%)
Arab: 101 (0.08%)
Hungarian: 97 (0.08%)
Ukrainian: 93 (0.08%)
British: 79 (0.07%)
Scottish: 77 (0.06%)
Lebanese: 74 (0.06%)
Swedish: 73 (0.06%)
Afghan: 62 (0.05%)
Basque: 61 (0.05%)
Danish: 61 (0.05%)
Russian: 53 (0.04%)
Brazilian: 53 (0.04%)
Canadian: 51 (0.04%)
Belizean: 51 (0.04%)
French Canadian: 47 (0.04%)
Trinidadian and Tobagonian: 46 (0.04%)
Romanian: 41 (0.03%)
Kenyan: 36 (0.03%)
Iranian: 32 (0.03%)
Eastern European: 31 (0.03%)
Czech: 25 (0.02%)
Greek: 25 (0.02%)
Finnish: 19 (0.02%)
Scandinavian: 17 (0.01%)
Welsh: 16 (0.01%)
Assyrian: 15 (0.01%)
Jordanian: 15 (0.01%)
Syrian: 11 (0.01%)
Haitian: 10 (0.01%)
Ethiopian: 7 (0.01%)
Turkish: 7 (0.01%)
Most common places of birth for foreign-born residents (%): Mexico Ontario:
62.5% (30,603)California:
37.2% (3,881,193)
Philippines Ontario:
6.0% (2,952)California:
7.8% (818,297)
El Salvador Ontario:
4.4% (2,166)California:
4.2% (440,287)
China, excluding Hong Kong and Taiwan Ontario:
3.4% (1,646)California:
6.6% (684,672)
Guatemala Ontario:
2.6% (1,271)California:
2.8% (290,436)
Vietnam Ontario:
2.5% (1,241)California:
4.9% (512,335)
Honduras Ontario:
1.9% (919)California:
0.6% (66,590)
Place of birth for U.S.-born residents:
This state: 116,285Other state: 12,075Northeast: 2,879Midwest: 2,598South: 4,576West: 2,022 92.6% of Ontario residents lived in the same house 1 years ago.
Out of people who lived in different houses, 32.7% lived in this county.
Out of people who lived in different counties, 85.0% lived in California.
Ontario:
92.6%State average:
88.9%
Education attainment for males 25 years and older:
No schooling: 3,431Nursery to 4th grade: 6795th and 6th grade: 2,2597th and 8th grade: 9379th grade: 70310th grade: 39911th grade: 1,09612th grade, no diploma: 2,078High school graduate (or equivalency): 17,391Less than 1 year of college: 4,248Some college more than 1 year, no degree: 7,799Associate degree: 5,893Bachelor's degree: 7,363Master's degree: 1,766Professional school degree: 314Doctorate degree: 161
Education attainment for females 25 years and older:
No schooling: 3,210Nursery to 4th grade: 9525th and 6th grade: 2,5027th and 8th grade: 5469th grade: 65610th grade: 17611th grade: 76512th grade, no diploma: 2,430High school graduate (or equivalency): 14,702Less than 1 year of college: 4,891Some college more than 1 year, no degree: 10,035Associate degree: 5,361Bachelor's degree: 8,194Master's degree: 2,540Professional school degree: 556Doctorate degree: 271
Housing units in structures:
One, detached: 32,133One, attached: 4,855Two: 1,5183 or 4: 4,4735 to 9: 2,27410 to 19: 2,68320 to 49: 1,44450 or more: 4,311Mobile homes: 2,321Median worth of mobile homes: $141,600
Housing units lacking complete plumbing facilities in 2022: 0.8%Housing units lacking complete kitchen facilities in 2022: 3.8%House/condo owner moved in on average 13 years ago
Renter moved in on average 4 years ago
Private vs. public school enrollment:
Students in private schools in grades 1 to 8 (elementary and middle school): 822 Here:
4.1%California:
10.5%
Students in private schools in grades 9 to 12 (high school): 293 Students in private undergraduate colleges: 2,459 Here:
19.9%California:
15.9%