Orange, VA (Virginia) Houses and Residents
| Orange: | $254,957 |
| Virginia: | $365,700 |
Mean price in 2022:
Detached houses: $293,805
Here: $293,805 State: $472,865 Townhouses or other attached units: $191,887
Here: $191,887 State: $457,437
Total population: 4,902 (Urban population: 3,866 (all inside urban clusters), Rural population: 133 (all nonfarm))
Houses: 1,895 (1,840 occupied: 817 owner occupied, 1,043 renter occupied)
| % of renters here: | 56% |
| State: | 33% |
Housing density: 586 houses/condos per square mile
Median price asked for vacant for-sale houses and condos in 2022 in this county: $332,686.
Median contract rent in 2022: $864 (lower quartile is $641, upper quartile is $987)
Median rent asked for vacant for-rent units in 2022: $1,103
Median gross rent in Orange, VA in 2022: $1,035
Housing units in Orange with a mortgage: 509 (11 second mortgage, 0 home equity loan, 1 both second mortgage and home equity loan)
Houses without a mortgage: 0
Median household income for houses/condos with a mortgage: $100,840
Median household income for apartments without a mortgage: $48,773
Median monthly housing costs: $1,001
Compare current foreclosures in Orange, VA:
| Photo | Address | Area | Beds / Baths | Price | Details |
|---|---|---|---|---|---|

|
#1
Constitution Hwy
Orange, VA 22960
|
1,814 sq. feet
|
2 baths 3 beds |
show details | |

|
#2
Blue Ridge Dr
Orange, VA 22960
|
1,524 sq. feet
|
1 baths 3 beds |
show details | |

|
#3
Harper Dr
Orange, VA 22960
|
752 sq. feet
|
2 baths 3 beds |
show details | |

|
#4
Bickers Ln
Orange, VA 22960
|
780 sq. feet
|
3 baths 6 beds |
show details | |

|
#5
Burnt Tree Way
Orange, VA 22960
|
1,738 sq. feet
|
2 baths 5 beds |
show details | |

|
#6
Kendall Rd
Orange, VA 22960
|
1,000 sq. feet
|
1 baths 3 beds |
show details | |

|
#7
Harper Dr
Orange, VA 22960
|
1,096 sq. feet
|
2 baths 4 beds |
show details | |

|
#8
Burnt Tree Way
Orange, VA 22960
|
1,120 sq. feet
|
1 baths 3 beds |
show details | |

|
#9
Fairmont St
Orange, VA 22960
|
1,479 sq. feet
|
2 baths 3 beds |
show details | |

|
#10
Winslow Dr
Orange, VA 22960
|
1,776 sq. feet
|
2 baths 3 beds |
show details |
| Photo | Address | Area | Beds / Baths | Price | Details |
|---|---|---|---|---|---|

|
#11
S James Madison Hwy
Orange, VA 22960
|
1,313 sq. feet
|
3 baths 3 beds |
show details | |

|
#12
Piedmont St
Orange, VA 22960
|
2,130 sq. feet
|
2 baths 5 beds |
show details | |

|
#13
Monrovia Rd
Orange, VA 22960
|
1,568 sq. feet
|
3 baths 4 beds |
show details | |

|
#14
Berry St
Orange, VA 22960
|
1,375 sq. feet
|
1 baths 2 beds |
show details | |

|
#15
Harbor Dr
Orange, VA 22960
|
- sq. feet
|
- baths - beds |
show details | |

|
#16
W Washington St
Orange, VA 22960
|
- sq. feet
|
- baths - beds |
show details | |

|
#17
Tanners Rd
Orange, VA 22960
|
- sq. feet
|
- baths - beds |
show details | |

|
#18
Brick Church Rd
Orange, VA 22960
|
- sq. feet
|
- baths - beds |
show details | |

|
#19
Belleview Ave Apt 120
Orange, VA 22960
|
- sq. feet
|
- baths - beds |
show details | |

|
#20
Old Gordonsville Rd
Orange, VA 22960
|
- sq. feet
|
- baths - beds |
show details |
| Photo | Address | Area | Beds / Baths | Price | Details |
|---|---|---|---|---|---|

|
#21
Oakbrook Dr
Orange, VA 22960
|
- sq. feet
|
- baths - beds |
show details | |

|
#22
Harper Dr
Orange, VA 22960
|
- sq. feet
|
- baths - beds |
show details | |

|
#23
Tomlinson Ct
Orange, VA 22960
|
- sq. feet
|
- baths - beds |
show details | |

|
#24
Harper Dr Apt 5
Orange, VA 22960
|
- sq. feet
|
- baths - beds |
show details | |

|
#25
Porterfield Dr
Orange, VA 22960
|
- sq. feet
|
- baths - beds |
show details | |

|
#26
Old Gordonsville Rd
Orange, VA 22960
|
- sq. feet
|
- baths - beds |
show details | |

|
#27
S James Madison Hwy
Orange, VA 22960
|
- sq. feet
|
- baths - beds |
show details | |

|
#28
Oakbrook Dr
Orange, VA 22960
|
- sq. feet
|
- baths - beds |
show details | |

|
#29
Forest Dr
Orange, VA 22960
|
- sq. feet
|
- baths - beds |
show details | |

|
#30
James Madison Hwy
Orange, VA 22960
|
- sq. feet
|
- baths - beds |
show details |
| Photo | Address | Area | Beds / Baths | Price | Details |
|---|---|---|---|---|---|

|
#31
Madison Rd
Orange, VA 22960
|
- sq. feet
|
- baths - beds |
show details | |

|
#32
Mount Pisgah Church Dr
Orange, VA 22960
|
- sq. feet
|
- baths - beds |
show details | |

|
#33
Oak Springs Rd
Orange, VA 22960
|
- sq. feet
|
- baths - beds |
show details | |

|
Check over 1 million property listings on Foreclosure.com!
|
browse all offers | |||

Latest news about housing in Orange, VA collected exclusively by city-data.com from local newspapers, TV, and radio stations


Median year apartment built: 1996
Household type by relationship:
Households: 4,952- Male householders: 687 (267 living alone), Female householders: 1,135 (411 living alone)
584 spouses (584 opposite-sex spouses), 253 unmarried partners, (253 opposite-sex unmarried partners), 1,104 children (930 natural, 61 adopted, 112 stepchildren), 309 grandchildren, 45 brothers or sisters, 44 parents, 0 foster children, 81 other relatives, 121 non-relatives
- In group quarters: 583
Size of family households: 291 2-persons, 297 3-persons, 257 4-persons, 112 5-persons, 57 6-persons.
Size of nonfamily households: 699 1-person, 145 2-persons.
277 married couples with children.
395 single-parent households (0 men, 395 women).
97.1% of residents of Orange speak English at home.
1.7% of residents speak Spanish at home (32% speak English very well, 24% speak English well, 44% speak English not well).
0.7% of residents speak other Indo-European language at home (100% speak English very well).
Foreign born population: 8 (0.2%)
(0.0% of them are naturalized citizens)
| Here: | 6.5 |
| State: | 7.0 |
| Here: | 3.9 |
| State: | 4.3 |

- Bedrooms in owner-occupied houses and condos in Orange, Virginia
- 0no bedroom
- 01 bedroom
- 1112 bedrooms
- 4613 bedrooms
- 1144 bedrooms
- 1325+ bedrooms

- Bedrooms in renter-occupied apartments in Orange, Virginia
- 40no bedroom
- 2151 bedroom
- 6692 bedrooms
- 1053 bedrooms
- 144 bedrooms
- 05+ bedrooms

- Cars and other vehicles available in Orange in owner-occupied houses/condos
- 28no vehicle
- 1481 vehicle
- 2352 vehicles
- 1853 vehicles
- 1324 vehicles
- 905+ vehicles

- Cars and other vehicles available in Orange in renter-occupied apartments
- 231no vehicle
- 5051 vehicle
- 2112 vehicles
- 973 vehicles
- 04 vehicles
- 05+ vehicles

- Rooms in owner-occupied houses in Orange, Virginia
- 01 room
- 02 rooms
- 03 rooms
- 134 rooms
- 985 rooms
- 2956 rooms
- 987 rooms
- 618 rooms
- 2549+ rooms

- Rooms in renter-occupied apartments in Orange, Virginia
- 401 room
- 72 rooms
- 2883 rooms
- 3714 rooms
- 1645 rooms
- 1066 rooms
- 147 rooms
- 528 rooms
- 09+ rooms


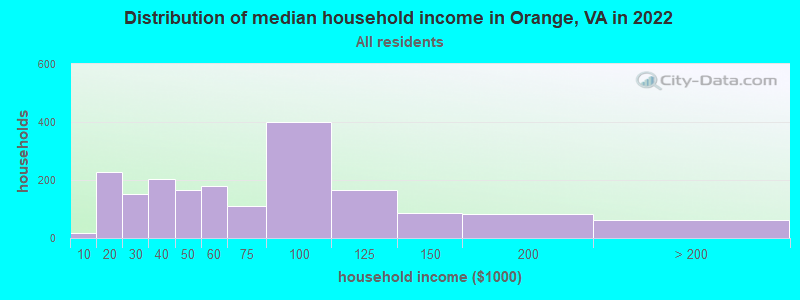
Orange, VA household income distribution

- 17Less than $10,000
- 229$10,000 to $19,999
- 152$20,000 to $29,999
- 205$30,000 to $39,999
- 166$40,000 to $49,999
- 180$50,000 to $59,999
- 112$60,000 to $74,999
- 401$75,000 to $99,999
- 166$100,000 to $124,999
- 86$125,000 to $149,999
- 84$150,000 to $199,999
- 63$200,000 or more
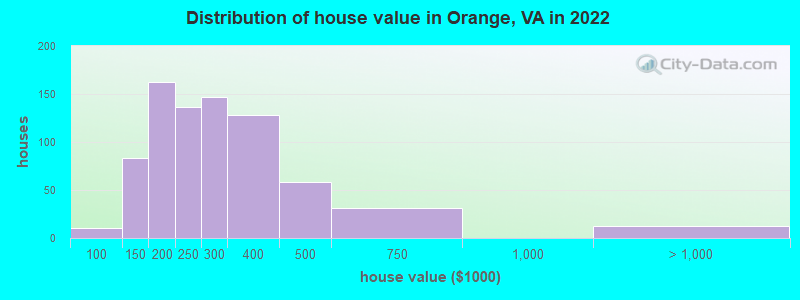
Home value of owner - occupied houses in 2022 in Orange, VA
-
- 10$80,000 to $89,999
- 72$100,000 to $124,999
- 10$125,000 to $149,999
- 96$150,000 to $174,999
- 66$175,000 to $199,999
- 136$200,000 to $249,999
- 146$250,000 to $299,999
- 127$300,000 to $399,999
- 58$400,000 to $499,999
- 31$500,000 to $749,999
- 13$1,000,000 to $1,499,999
Rent paid by renters in 2022 in Orange, VA
-
- 39$100 to $149
- 126$200 to $249
- 107$500 to $549
- 36$600 to $649
- 57$650 to $699
- 49$700 to $749
- 53$750 to $799
- 169$800 to $899
- 188$900 to $999
- 76$1,000 to $1,249
- 124$1,250 to $1,499
- 10$1,500 to $1,999
- 10No cash rent

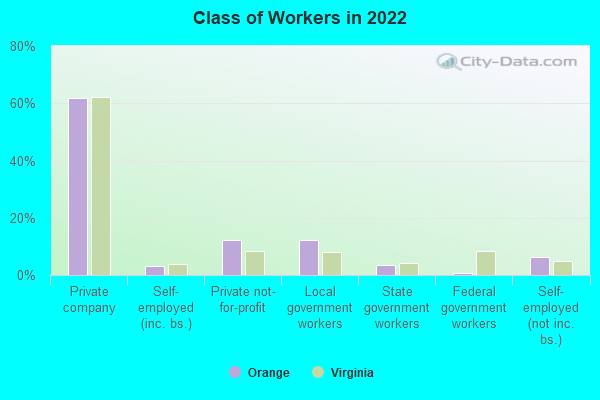
Percentage of workers working in this county: 67.0%
Number of people working at home: 241 (11.4% of all workers)
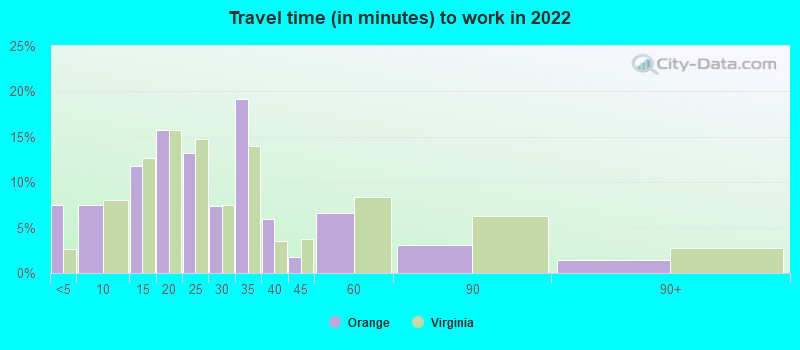
Travel time to work (commute)
- Less than 5 minutes: 221
- 5 to 9 minutes: 193
- 10 to 14 minutes: 284
- 15 to 19 minutes: 248
- 20 to 24 minutes: 232
- 25 to 29 minutes: 98
- 30 to 34 minutes: 192
- 35 to 39 minutes: 32
- 40 to 44 minutes: 82
- 45 to 59 minutes: 61
- 60 to 89 minutes: 188
- 90 or more minutes: 29
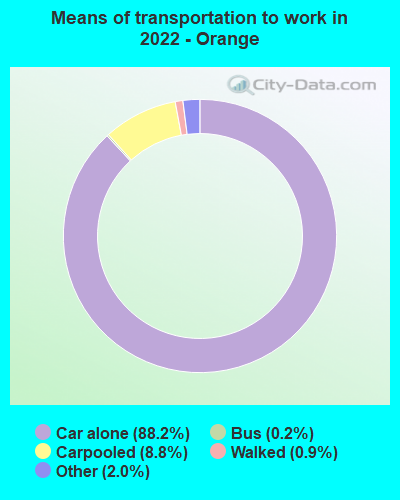
Means of transportation to work:
- Drove a car alone: 2,546 (79.1%)
- Carpooled: 257 (8.0%)
- Bus: 3 (0.1%)
- Taxi: 70 (2.2%)
- Walked: 26 (0.8%)
- Worked at home: 241 (7.5%)
- Unemployment by race in 2022
- Unemployment rate for White non-Hispanic residents
- 3.3%Males
- 0.5%Females
- Unemployment rate for Black residents
- 30.6%Males

- Year of entry for the foreign-born population in Orange, Virginia
- 92010 or later
- 02000 to 2009
- 01990 to 1999
- 121980 to 1989
- 01970 to 1979
- 10Before 1970

First ancestries reported:
- Irish: 346 (15.4%)
- American: 197 (8.8%)
- English: 130 (5.8%)
- German: 107 (4.8%)
- Norwegian: 39 (1.7%)
- Italian: 37 (1.7%)
- Scotch-Irish: 25 (1.1%)
- Scottish: 25 (1.1%)
- European: 16 (0.7%)
- Polish: 10 (0.4%)
Most common places of birth for foreign-born residents (%):
| Orange: | 87.5% (7) |
| Virginia: | 5.3% (57,498) |
Place of birth for U.S.-born residents:
- This state: 3,381
- Other state: 1,524
- Northeast: 442
- Midwest: 204
- South: 818
- West: 51
81.8% of Orange residents lived in the same house 1 years ago.
Out of people who lived in different houses, 30.6% lived in this county.
Out of people who lived in different counties, 88.3% lived in Virginia.
| Orange: | 81.8% |
| State average: | 86.6% |
Education attainment for males 25 years and older:
- No schooling: 177
- Nursery to 4th grade: 0
- 5th and 6th grade: 10
- 7th and 8th grade: 19
- 9th grade: 88
- 10th grade: 33
- 11th grade: 51
- 12th grade, no diploma: 8
- High school graduate (or equivalency): 731
- Less than 1 year of college: 109
- Some college more than 1 year, no degree: 159
- Associate degree: 35
- Bachelor's degree: 196
- Master's degree: 98
- Professional school degree: 12
- Doctorate degree: 16

Education attainment for females 25 years and older:
- No schooling: 22
- Nursery to 4th grade: 0
- 5th and 6th grade: 0
- 7th and 8th grade: 14
- 9th grade: 6
- 10th grade: 133
- 11th grade: 3
- 12th grade, no diploma: 28
- High school graduate (or equivalency): 630
- Less than 1 year of college: 150
- Some college more than 1 year, no degree: 275
- Associate degree: 139
- Bachelor's degree: 205
- Master's degree: 74
- Professional school degree: 26
- Doctorate degree: 0


Housing units in structures:
- One, detached: 838
- One, attached: 159
- Two: 34
- 3 or 4: 267
- 5 to 9: 259
- 10 to 19: 255
- 20 to 49: 31
- 50 or more: 49
House/condo owner moved in on average 14 years ago
Renter moved in on average 2 years ago

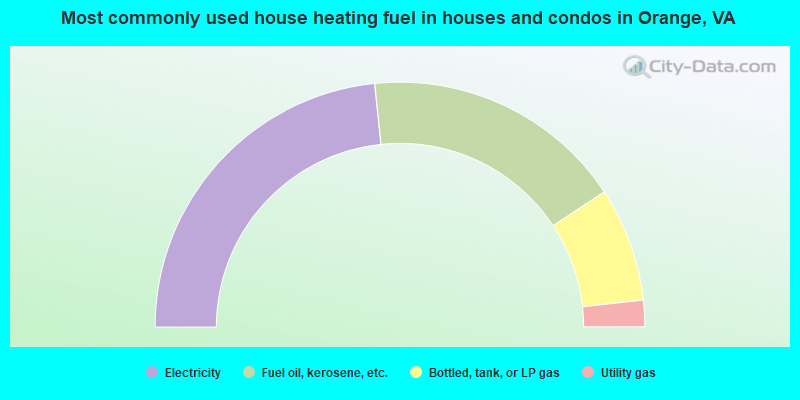
- 46.7%Electricity
- 34.7%Fuel oil, kerosene, etc.
- 15.1%Bottled, tank, or LP gas
- 3.5%Utility gas
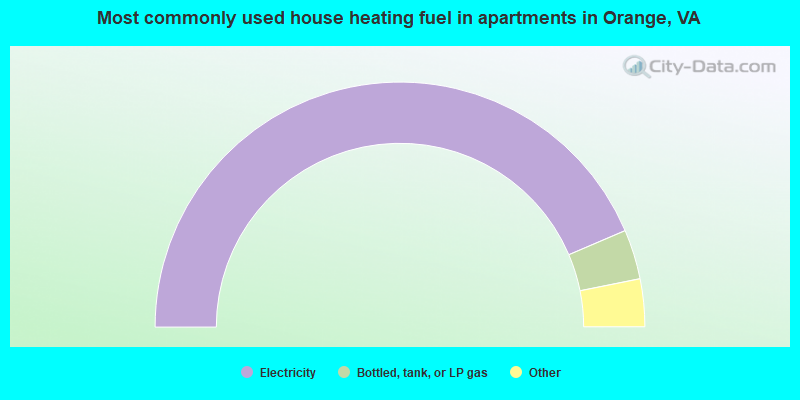
- 87.3%Electricity
- 6.6%Bottled, tank, or LP gas
- 3.6%Wood
- 1.8%Fuel oil, kerosene, etc.
- 0.7%Utility gas
Private vs. public school enrollment:
| Here: | 6.7% |
| Virginia: | 13.2% |
| Here: | 0.0% |
| Virginia: | 10.2% |
| Here: | 12.0% |
| Virginia: | 18.7% |


