Jump to a detailed profile or search site with Google Custom Search

Orangevale, CA (California) Houses and Residents

Estimated median house or condo value in 2022: $546,505 (it was $159,300 in 2000)
Orangevale:

$546,505
California:

$715,900
Lower value quartile - upper value quartile: $440,418 - $701,179

Total population: 33,960 (Urban population: 26,742, Rural population: 0)

Houses: 14,548 (13,816 occupied: 10,361 owner occupied, 3,428 renter occupied)

% of renters here:

25%
State:

44%

Housing density: 1,451 houses/condos per square mile

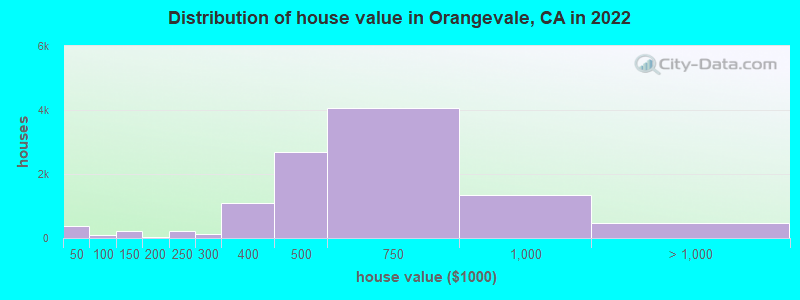
Median price asked for vacant for-sale houses and condos in 2022: $392,025.

Median contract rent in 2022: $1,711 (lower quartile is $1,431, upper quartile is $1,969)


Median rent asked for vacant for-rent units in 2022: $3,557


Median gross rent in Orangevale, CA in 2022: $1,869

Housing units in Orangevale with a mortgage: 6,844 (591 second mortgage, 30 home equity loan, 524 both second mortgage and home equity loan)
Houses without a mortgage: 94

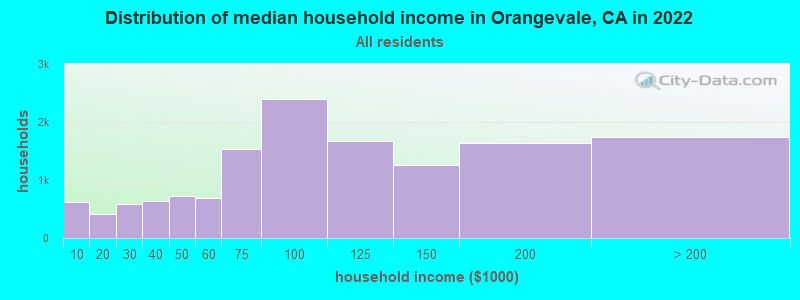
Median household income for houses/condos with a mortgage: $119,673

Median household income for apartments without a mortgage: $81,877

Median monthly housing costs: $1,863

Compare current foreclosures near Orangevale, CA:

Check out more offers near Orangevale, CA.
Powered by Foreclosure.com

Settings
X
Data:
Loading data...
Based on 2000-2020 data
Loading data...

123
Hide US histogram

Latest news about housing in Orangevale, CA collected exclusively by city-data.com from local newspapers, TV, and radio stations

Orangevale, California Age and Sex of Residents
Median year house/condo built: 1975

Median year apartment built: 1979

Household type by relationship:

Households: 35,964
  • Male householders: 6,414 (1,233 living alone), Female householders: 7,204 (2,089 living alone)
  • 6,666 spouses (6,557 opposite-sex spouses), 1,045 unmarried partners, (1,024 opposite-sex unmarried partners), 10,429 children (9,541 natural, 364 adopted, 523 stepchildren), 906 grandchildren, 326 brothers or sisters, 660 parents, 27 foster children, 594 other relatives, 1,368 non-relatives
  • In group quarters: 321

Size of family households: 4,150 2-persons, 2,257 3-persons, 1,870 4-persons, 835 5-persons, 352 6-persons, 55 7-or-more-persons.

Size of nonfamily households: 3,482 1-person, 676 2-persons, 123 3-persons, 13 4-persons.

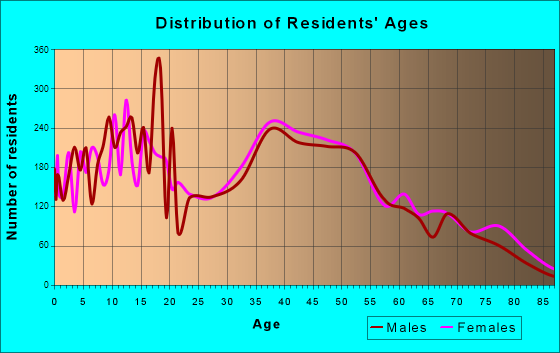
4,523 married couples with children.
2,059 single-parent households (677 men, 1,382 women).

85.4% of residents of Orangevale speak English at home.
5.8% of residents speak Spanish at home (81% speak English very well, 7% speak English well, 11% speak English not well).
4.6% of residents speak other Indo-European language at home (71% speak English very well, 17% speak English well, 8% speak English not well, 3% don't speak English at all).
2.0% of residents speak Asian or Pacific Island language at home (56% speak English very well, 20% speak English well, 23% speak English not well).
1.2% of residents speak other language at home (62% speak English very well, 9% speak English well, 29% speak English not well).

Foreign born population: 3,288 (9.1%)
(68.6% of them are naturalized citizens)

Median number of rooms in houses and condos:
Here:

6.2
State:

6.0

Median number of rooms in apartments
Here:

4.3
State:

3.9

Owner-occupied Renter-occupied
Bedrooms in owner-occupied houses and condos in Orangevale, California
  • Bedrooms in owner-occupied houses and condos in Orangevale, California
  • 39no bedroom
  • 2091 bedroom
  • 6292 bedrooms
  • 5,7623 bedrooms
  • 3,2404 bedrooms
  • 4825+ bedrooms
Bedrooms in renter-occupied apartments in Orangevale, California
  • Bedrooms in renter-occupied apartments in Orangevale, California
  • 229no bedroom
  • 4521 bedroom
  • 1,3902 bedrooms
  • 1,1013 bedrooms
  • 1964 bedrooms
  • 615+ bedrooms
Owner-occupied Renter-occupied
Cars and other vehicles available in Orangevale in owner-occupied houses/condos
  • Cars and other vehicles available in Orangevale in owner-occupied houses/condos
  • 364no vehicle
  • 2,0561 vehicle
  • 4,0672 vehicles
  • 2,4783 vehicles
  • 9664 vehicles
  • 4315+ vehicles
Cars and other vehicles available in Orangevale in renter-occupied apartments
  • Cars and other vehicles available in Orangevale in renter-occupied apartments
  • 282no vehicle
  • 1,4251 vehicle
  • 1,0612 vehicles
  • 4163 vehicles
  • 2034 vehicles
  • 405+ vehicles
Owner-occupied Renter-occupied
Rooms in owner-occupied houses in Orangevale, California
  • Rooms in owner-occupied houses in Orangevale, California
  • 391 room
  • 202 rooms
  • 1793 rooms
  • 5974 rooms
  • 2,5745 rooms
  • 2,5106 rooms
  • 1,7287 rooms
  • 1,3028 rooms
  • 1,4139+ rooms
Rooms in renter-occupied apartments in Orangevale, California
  • Rooms in renter-occupied apartments in Orangevale, California
  • 2291 room
  • 1122 rooms
  • 3673 rooms
  • 1,0614 rooms
  • 7855 rooms
  • 4916 rooms
  • 1927 rooms
  • 1228 rooms
  • 709+ rooms
Year house built
Median 2022 house/condo value by year built
Median house/condo value by year householder moved into unit
Breakdown of mean house values by ages of householders
Owners and renters by unit type in Orangevale, CA
  • Orangevale, CA household income distribution

  • Distribution of median household income in Orangevale, CA in 2022
  • 619Less than $10,000
  • 413$10,000 to $19,999
  • 581$20,000 to $29,999
  • 641$30,000 to $39,999
  • 718$40,000 to $49,999
  • 696$50,000 to $59,999
  • 1,527$60,000 to $74,999
  • 2,405$75,000 to $99,999
  • 1,665$100,000 to $124,999
  • 1,266$125,000 to $149,999
  • 1,637$150,000 to $199,999
  • 1,750$200,000 or more
  • Home value of owner - occupied houses in 2022 in Orangevale, CA

  • Distribution of house value in Orangevale, CA in 2022
  • 160Less than $10,000
  • 56$10,000 to $14,999
  • 72$20,000 to $24,999
  • 13$25,000 to $29,999
  • 8$35,000 to $39,999
  • 53$40,000 to $49,999
  • 18$50,000 to $59,999
  • 11$60,000 to $69,999
  • 5$80,000 to $89,999
  • 19$90,000 to $99,999
  • 158$100,000 to $124,999
  • 64$125,000 to $149,999
  • 8$150,000 to $174,999
  • 11$175,000 to $199,999
  • 213$200,000 to $249,999
  • 140$250,000 to $299,999
  • 1,080$300,000 to $399,999
  • 2,696$400,000 to $499,999
  • 4,061$500,000 to $749,999
  • 1,328$750,000 to $999,999
  • 271$1,000,000 to $1,499,999
  • 96$1,500,000 to $1,999,999
  • 104$2,000,000 or more
  • Rent paid by renters in 2022 in Orangevale, CA

  • Distribution of rent paid by renters in Orangevale, CA in 2022
  • 23$150 to $199
  • 14$200 to $249
  • 7$250 to $299
  • 14$350 to $399
  • 20$400 to $449
  • 2$550 to $599
  • 1$600 to $649
  • 39$650 to $699
  • 6$700 to $749
  • 27$800 to $899
  • 13$900 to $999
  • 193$1,000 to $1,249
  • 778$1,250 to $1,499
  • 1,551$1,500 to $1,999
  • 453$2,000 to $2,499
  • 153$2,500 to $2,999
  • 50$3,000 to $3,499
  • 207No cash rent
Time Leaving Home To Go To Work in 2022

Percentage of workers working in this county: 77.4%
Number of people working at home: 3,471 (20.2% of all workers)

Travel time (in minutes) to work in 2022

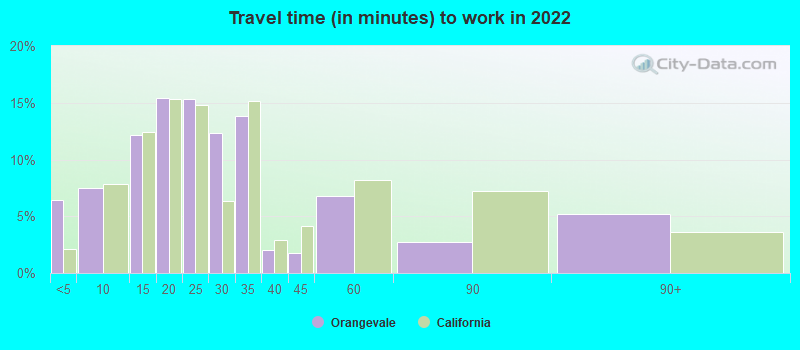
Travel time to work (commute)

  • Less than 5 minutes: 227
  • 5 to 9 minutes: 733
  • 10 to 14 minutes: 1,421
  • 15 to 19 minutes: 2,362
  • 20 to 24 minutes: 2,416
  • 25 to 29 minutes: 916
  • 30 to 34 minutes: 2,594
  • 35 to 39 minutes: 633
  • 40 to 44 minutes: 802
  • 45 to 59 minutes: 706
  • 60 to 89 minutes: 408
  • 90 or more minutes: 435
Means of transportation to work in 2022 - Orangevale

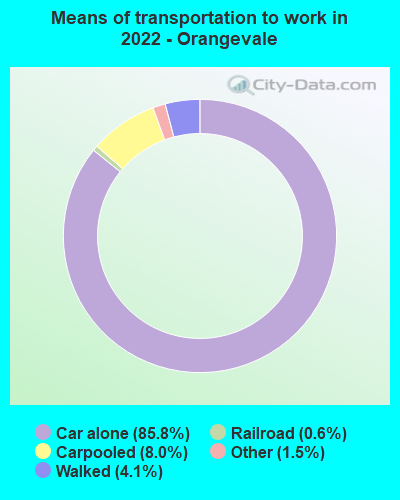
Means of transportation to work:

  • Drove a car alone: 3,842 (51.9%)
  • Carpooled: 370 (5.0%)
  • Light rail, streetcar or trolley: 16 (0.2%)
  • Taxi: 80 (1.1%)
  • Walked: 203 (2.7%)
  • Worked at home: 3,471 (46.9%)
Class of Workers in 2022
  • Unemployment by race in 2022
  • Unemployment rate for White non-Hispanic residents
  • 3.6%Males
  • 4.1%Females
  • Unemployment rate for Black residents
  • 1.4%Females
  • Unemployment rate for American Indian and Alaska Native residents
  • 20.3%Males
  • Unemployment rate for Asian residents
  • 9.5%Males
  • 7.8%Females
  • Unemployment rate for other race residents
  • 1.4%Males
  • 13.9%Females
  • Unemployment rate for two or more race residents
  • 8.0%Males
  • 1.3%Females
  • Unemployment rate for Hispanic or Latino residents
  • 6.1%Males
  • 7.1%Females
Year of entry for the foreign-born population in Orangevale, California
  • Year of entry for the foreign-born population in Orangevale, California
  • 5592010 or later
  • 7772000 to 2009
  • 7011990 to 1999
  • 2971980 to 1989
  • 2521970 to 1979
  • 338Before 1970
Ancestries in Orangevale, CA

First ancestries reported:

  • English: 1,638 (10.7%)
  • American: 1,464 (9.6%)
  • German: 1,088 (7.1%)
  • European: 897 (5.9%)
  • Irish: 808 (5.3%)
  • Ukrainian: 491 (3.2%)
  • Italian: 387 (2.5%)
  • Norwegian: 349 (2.3%)
  • Scottish: 261 (1.7%)
  • Romanian: 234 (1.5%)
  • Polish: 225 (1.5%)
  • French: 200 (1.3%)
  • Dutch: 185 (1.2%)
  • Portuguese: 155 (1.0%)
  • Swedish: 133 (0.9%)
  • Kenyan: 127 (0.8%)
  • Iranian: 126 (0.8%)
  • Russian: 114 (0.7%)
  • Northern European: 85 (0.6%)
  • Scotch-Irish: 80 (0.5%)
  • Greek: 74 (0.5%)
  • British: 55 (0.4%)
  • Danish: 54 (0.4%)
  • Czech: 52 (0.3%)
  • Slavic: 47 (0.3%)
  • Hungarian: 37 (0.2%)
  • Turkish: 36 (0.2%)
  • French Canadian: 34 (0.2%)
  • Canadian: 31 (0.2%)
  • Yugoslavian: 27 (0.2%)
  • Maltese: 26 (0.2%)
  • Macedonian: 24 (0.2%)
  • Croatian: 23 (0.2%)
  • Finnish: 22 (0.1%)
  • Estonian: 18 (0.1%)
  • Albanian: 13 (0.08%)
  • Slovak: 13 (0.08%)
  • Afghan: 12 (0.08%)
  • Ethiopian: 12 (0.08%)
  • Czechoslovakian: 9 (0.06%)
  • Scandinavian: 8 (0.05%)
  • Eastern European: 8 (0.05%)
  • Welsh: 7 (0.05%)
  • Lebanese: 6 (0.04%)
  • Pennsylvania German: 4 (0.03%)
  • Iraqi: 3 (0.02%)
  • Belizean: 1 (0.01%)

Most common places of birth for foreign-born residents (%):

Mexico
Orangevale:

13.0% (415)
California:

37.2% (3,881,193)

Ukraine
Orangevale:

9.6% (307)
California:

0.6% (60,761)

Moldova
Orangevale:

7.4% (237)
California:

0.1% (10,171)

England
Orangevale:

6.4% (204)
California:

0.6% (57,953)

Philippines
Orangevale:

6.3% (200)
California:

7.8% (818,297)

Yemen
Orangevale:

4.1% (132)
California:

0.1% (10,349)

Canada
Orangevale:

4.1% (131)
California:

1.2% (127,477)

Iran
Orangevale:

3.9% (125)
California:

2.0% (206,004)

Russia
Orangevale:

3.6% (116)
California:

0.7% (71,932)

Poland
Orangevale:

3.2% (101)
California:

0.2% (20,997)

India
Orangevale:

2.8% (88)
California:

5.2% (539,184)

Romania
Orangevale:

2.5% (80)
California:

0.2% (23,058)

Turkey
Orangevale:

2.5% (79)
California:

0.2% (20,474)

Portugal
Orangevale:

2.2% (71)
California:

0.2% (25,462)

Honduras
Orangevale:

1.9% (60)
California:

0.6% (66,590)

Netherlands
Orangevale:

1.8% (56)
California:

0.2% (17,937)

Azores Islands
Orangevale:

1.8% (56)
California:

0.1% (8,659)

Place of birth for U.S.-born residents:

  • This state: 25,585
  • Other state: 6,391
  • Northeast: 952
  • Midwest: 2,048
  • South: 1,236
  • West: 2,124

87.0% of Orangevale residents lived in the same house 1 years ago.
   Out of people who lived in different houses, 38.9% lived in this county.
   Out of people who lived in different counties, 87.5% lived in California.


Orangevale:

87.0%
State average:

88.9%

Education attainment for males 25 years and older:

  • No schooling: 145
  • Nursery to 4th grade: 8
  • 5th and 6th grade: 0
  • 7th and 8th grade: 18
  • 9th grade: 34
  • 10th grade: 123
  • 11th grade: 133
  • 12th grade, no diploma: 218
  • High school graduate (or equivalency): 3,358
  • Less than 1 year of college: 826
  • Some college more than 1 year, no degree: 2,494
  • Associate degree: 1,345
  • Bachelor's degree: 2,431
  • Master's degree: 998
  • Professional school degree: 236
  • Doctorate degree: 137
Educational Attainment for Males

Education attainment for females 25 years and older:

  • No schooling: 226
  • Nursery to 4th grade: 2
  • 5th and 6th grade: 20
  • 7th and 8th grade: 13
  • 9th grade: 80
  • 10th grade: 172
  • 11th grade: 125
  • 12th grade, no diploma: 169
  • High school graduate (or equivalency): 3,024
  • Less than 1 year of college: 1,018
  • Some college more than 1 year, no degree: 2,350
  • Associate degree: 1,554
  • Bachelor's degree: 3,153
  • Master's degree: 1,081
  • Professional school degree: 323
  • Doctorate degree: 142
Educational Attainment for Females
Orangevale marital status for males
Orangevale marital status for females

Housing units in structures:

  • One, detached: 11,625
  • One, attached: 429
  • Two: 215
  • 3 or 4: 487
  • 5 to 9: 428
  • 10 to 19: 139
  • 20 to 49: 101
  • 50 or more: 724
  • Mobile homes: 360
  • Boats, RVs, vans, etc.: 35
Housing units lacking complete plumbing facilities in 2022: 0.2%

Housing units lacking complete kitchen facilities in 2022: 2.1%

House/condo owner moved in on average 12 years ago

Renter moved in on average 2 years ago

Year householders moved into residence in Orangevale
Houses and condos Apartments
Most commonly used house heating fuel in houses and condos in Orangevale, CA
  • 64.8%Utility gas
  • 31.4%Electricity
  • 1.6%Bottled, tank, or LP gas
  • 1.1%Solar energy
  • 0.8%Wood
  • 0.2%Other fuel
Most commonly used house heating fuel in apartments in Orangevale, CA
  • 53.1%Electricity
  • 43.6%Utility gas
  • 2.9%Bottled, tank, or LP gas
  • 0.2%No fuel used
  • 0.1%Wood

Private vs. public school enrollment:

Students in private schools in grades 1 to 8 (elementary and middle school): 335
Here:

10.0%
California:

10.5%

Students in private schools in grades 9 to 12 (high school): 166
Here:

9.7%
California:

8.5%

Students in private undergraduate colleges: 121
Here:

5.5%
California:

15.9%
School Enrollment by Level of School for Male Students
School Enrollment by Level of School for Female Students
Age and Sex of Sensory-Disabled Noninstitutionalized Residents
Age and Sex of Physically-Disabled Noninstitutionalized Residents
Age and Sex of Mentally-Disabled Noninstitutionalized Residents
Age and Sex of Self-Care Disabled Noninstitutionalized Residents
Age and Sex of Go-Outside-Home Disabled Noninstitutionalized Residents
Age and Sex of Noninstitutionalized Residents with Employment Disability