Housing density: 1,150 houses/condos per square mile
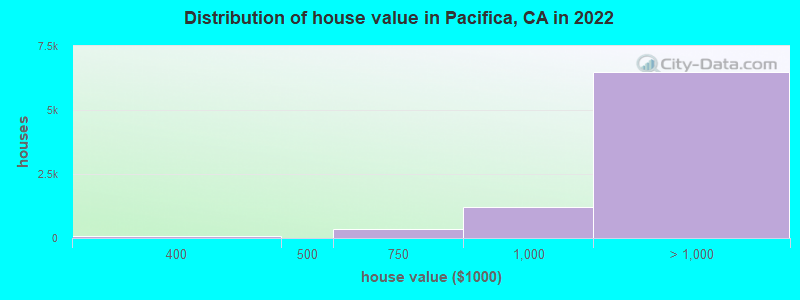
Median price asked for vacant for-sale houses and condos in 2022: $792,925.
Median contract rent in 2022: over $2,000 (lower quartile is over $2,000, upper quartile is over $2,000)
Median rent asked for vacant for-rent units in 2022: $3,394
Median gross rent in Pacifica, CA in 2022: over $2,000
Housing units in Pacifica with a mortgage: 6,226 (894 second mortgage, 44 home equity loan, 714 both second mortgage and home equity loan) Houses without a mortgage: 169
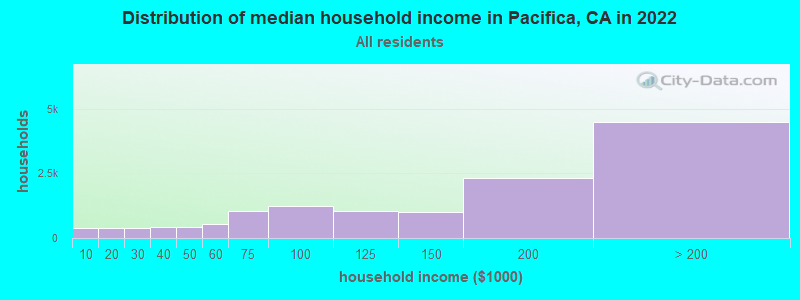
Median household income for houses/condos with a mortgage: $191,596
Median household income for apartments without a mortgage: $97,719
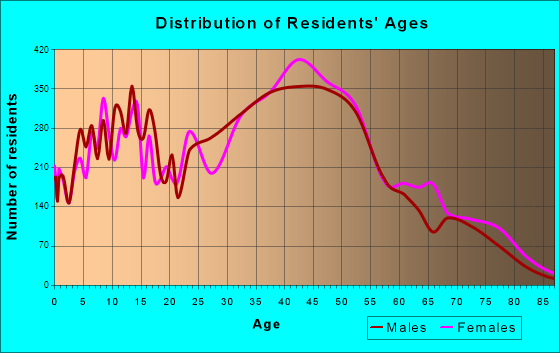
4,616 married couples with children.
1,128 single-parent households (415 men, 713 women).
73.8% of residents of Pacifica speak English at home.
7.4% of residents speak Spanish at home (70% speak English very well, 24% speak English well, 3% speak English not well, 3% don't speak English at all).
4.3% of residents speak other Indo-European language at home (78% speak English very well, 20% speak English well, 1% speak English not well, 1% don't speak English at all).
14.2% of residents speak Asian or Pacific Island language at home (63% speak English very well, 24% speak English well, 7% speak English not well, 6% don't speak English at all).
0.8% of residents speak other language at home (99% speak English very well, 1% speak English well).
Foreign born population: 8,214 (22.3%)
(75.5% of them are naturalized citizens)
Percentage of workers working in this county: 68.7% Number of people working at home: 4,702 (24.5% of all workers)
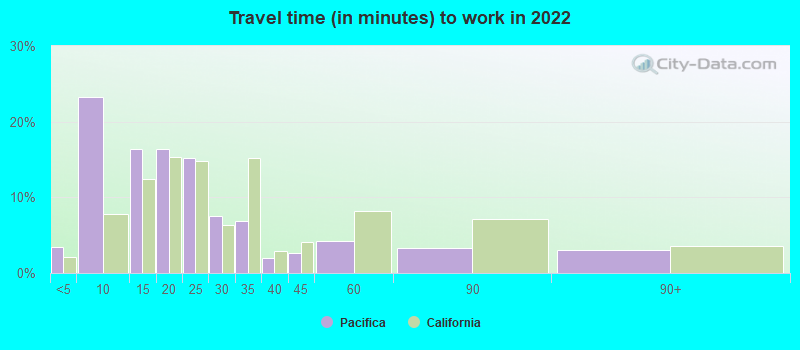
Travel time to work (commute)
Less than 5 minutes: 183
5 to 9 minutes: 1,231
10 to 14 minutes: 1,449
15 to 19 minutes: 1,602
20 to 24 minutes: 2,343
25 to 29 minutes: 1,173
30 to 34 minutes: 2,674
35 to 39 minutes: 824
40 to 44 minutes: 925
45 to 59 minutes: 1,109
60 to 89 minutes: 652
90 or more minutes: 199
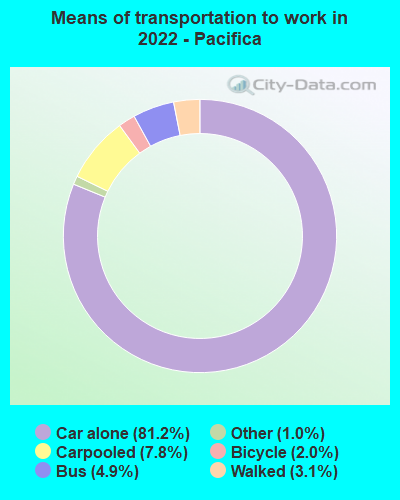
Means of transportation to work:
Drove a car alone: 3,239 (40.8%)
Carpooled: 338 (4.3%)
Bus: 176 (2.2%)
Subway or elevated rail: 2 (0.0%)
Taxi: 31 (0.4%)
Bicycle: 89 (1.1%)
Walked: 139 (1.7%)
Worked at home: 4,702 (59.2%)
Unemployment by race in 2022
Unemployment rate for White non-Hispanic residents
2.1%Males
2.1%Females
Unemployment rate for Black residents
13.1%Males
2.8%Females
Unemployment rate for American Indian and Alaska Native residents
12.3%Males
7.2%Females
Unemployment rate for Asian residents
1.1%Males
1.9%Females
Unemployment rate for other race residents
2.3%Males
5.2%Females
Unemployment rate for two or more race residents
1.7%Males
10.6%Females
Unemployment rate for Hispanic or Latino residents
2.3%Males
4.6%Females
Year of entry for the foreign-born population in Pacifica, California
1,4852010 or later
1,2202000 to 2009
1,3711990 to 1999
2,2031980 to 1989
1,2491970 to 1979
1,736Before 1970
First ancestries reported:
Irish: 1,158 (6.7%)
Italian: 1,038 (6.0%)
English: 830 (4.8%)
American: 656 (3.8%)
German: 646 (3.7%)
European: 582 (3.3%)
Brazilian: 221 (1.3%)
Portuguese: 219 (1.3%)
Russian: 191 (1.1%)
Scottish: 145 (0.8%)
Polish: 131 (0.8%)
Egyptian: 108 (0.6%)
Norwegian: 104 (0.6%)
Armenian: 90 (0.5%)
Eastern European: 71 (0.4%)
Iranian: 71 (0.4%)
Hungarian: 66 (0.4%)
British: 62 (0.4%)
Jamaican: 61 (0.4%)
Ukrainian: 60 (0.3%)
Dutch: 53 (0.3%)
Scotch-Irish: 50 (0.3%)
French: 48 (0.3%)
Canadian: 46 (0.3%)
Czech: 43 (0.2%)
Swedish: 41 (0.2%)
Northern European: 37 (0.2%)
Palestinian: 35 (0.2%)
Soviet Union: 35 (0.2%)
Finnish: 33 (0.2%)
Scandinavian: 32 (0.2%)
Lithuanian: 31 (0.2%)
Greek: 28 (0.2%)
African: 26 (0.1%)
Australian: 22 (0.1%)
South African: 20 (0.1%)
Croatian: 19 (0.1%)
Nigerian: 18 (0.1%)
Slovak: 16 (0.09%)
Maltese: 16 (0.09%)
French Canadian: 15 (0.09%)
Welsh: 15 (0.09%)
Swiss: 14 (0.08%)
Afghan: 9 (0.05%)
Bulgarian: 8 (0.05%)
Danish: 8 (0.05%)
Lebanese: 6 (0.03%)
Czechoslovakian: 6 (0.03%)
Most common places of birth for foreign-born residents (%):
Philippines
Pacifica:
19.9% (1,652)
California:
7.8% (818,297)
China, excluding Hong Kong and Taiwan
Pacifica:
9.4% (781)
California:
6.6% (684,672)
Mexico
Pacifica:
6.3% (523)
California:
37.2% (3,881,193)
Hong Kong
Pacifica:
5.3% (444)
California:
1.0% (105,215)
Thailand
Pacifica:
3.6% (299)
California:
0.6% (65,335)
Canada
Pacifica:
3.6% (298)
California:
1.2% (127,477)
Japan
Pacifica:
3.5% (291)
California:
1.0% (103,575)
Vietnam
Pacifica:
3.3% (277)
California:
4.9% (512,335)
Brazil
Pacifica:
2.8% (236)
California:
0.5% (53,222)
Korea
Pacifica:
2.8% (235)
California:
3.0% (315,248)
El Salvador
Pacifica:
2.2% (183)
California:
4.2% (440,287)
Burma (Myanmar)
Pacifica:
2.0% (163)
California:
0.3% (28,176)
Taiwan
Pacifica:
1.9% (162)
California:
1.7% (176,274)
Peru
Pacifica:
1.9% (162)
California:
0.7% (74,025)
India
Pacifica:
1.9% (154)
California:
5.2% (539,184)
Hungary
Pacifica:
1.7% (144)
California:
0.1% (10,936)
Nicaragua
Pacifica:
1.7% (142)
California:
0.6% (58,161)
Place of birth for U.S.-born residents:
This state: 21,208
Other state: 6,592
Northeast: 1,671
Midwest: 2,095
South: 1,486
West: 1,359
91.0% of Pacifica residents lived in the same house 1 years ago. Out of people who lived in different houses, 35.5% lived in this county. Out of people who lived in different counties, 81.8% lived in California.
Pacifica:
91.0%
State average:
88.9%
Education attainment for males 25 years and older:
No schooling: 112
Nursery to 4th grade: 47
5th and 6th grade: 49
7th and 8th grade: 27
9th grade: 24
10th grade: 69
11th grade: 46
12th grade, no diploma: 170
High school graduate (or equivalency): 2,516
Less than 1 year of college: 751
Some college more than 1 year, no degree: 2,155
Associate degree: 1,348
Bachelor's degree: 3,999
Master's degree: 1,477
Professional school degree: 350
Doctorate degree: 397
Education attainment for females 25 years and older:
No schooling: 179
Nursery to 4th grade: 24
5th and 6th grade: 132
7th and 8th grade: 14
9th grade: 67
10th grade: 43
11th grade: 9
12th grade, no diploma: 107
High school graduate (or equivalency): 1,863
Less than 1 year of college: 784
Some college more than 1 year, no degree: 1,831
Associate degree: 1,370
Bachelor's degree: 4,036
Master's degree: 2,172
Professional school degree: 647
Doctorate degree: 460
Housing units in structures:
One, detached: 10,719
One, attached: 759
Two: 129
3 or 4: 584
5 to 9: 640
10 to 19: 431
20 to 49: 342
50 or more: 779
Mobile homes: 144
Housing units lacking complete plumbing facilities in 2022: 0.2%
Housing units lacking complete kitchen facilities in 2022: 0.4%
House/condo owner moved in on average 20 years ago