Palisades Park, NJ (New Jersey) Houses and Residents
| Palisades Park: | $691,847 |
| New Jersey: | $428,900 |
Mean price in 2022:
Detached houses: $598,507
Here: $598,507 State: $537,591 Townhouses or other attached units: $891,975
Here: $891,975 State: $381,113 In 2-unit structures: $854,826
Here: $854,826 State: $444,476 In 3-to-4-unit structures: $1,164,906
Here: $1,164,906 State: $457,463 In 5-or-more-unit structures: $361,312
Here: $361,312 State: $368,745
Total population: 20,471 (Urban population: 17,073, Rural population: 0)
Houses: 7,459 (7,163 occupied: 2,700 owner occupied, 4,501 renter occupied)
| % of renters here: | 63% |
| State: | 35% |
Housing density: 6,166 houses/condos per square mile
Median price asked for vacant for-sale houses and condos in 2022: $635,438.
Median contract rent in 2022: $1,816 (lower quartile is $1,423, upper quartile is over $2,000)
Median rent asked for vacant for-rent units in 2022: $1,709
Median gross rent in Palisades Park, NJ in 2022: $1,866
Housing units in Palisades Park with a mortgage: 1,682 (101 second mortgage, 19 home equity loan, 72 both second mortgage and home equity loan)
Houses without a mortgage: 100
Median household income for houses/condos with a mortgage: $135,151
Median household income for apartments without a mortgage: $100,417
Median monthly housing costs: $1,887
Compare current foreclosures near Palisades Park, NJ:
| Photo | Address | Area | Beds / Baths | Price | Details |
|---|---|---|---|---|---|

|
#1
E Ruby Ave Apt B1
Palisades Park, NJ 07650
|
- sq. feet
|
- baths - beds |
show details | |

|
#2
1st St
Palisades Park, NJ 07650
|
- sq. feet
|
- baths - beds |
show details | |

|
#3
7th St
Palisades Park, NJ 07650
|
3,608 sq. feet
|
- baths - beds |
show details | |

|
#4
Morningside Ln Apt B
Palisades Park, NJ 07650
|
- sq. feet
|
- baths - beds |
show details | |

|
#5
Commercial Ave
Palisades Park, NJ 07650
|
- sq. feet
|
- baths - beds |
show details | |

|
#6
Edsall Blv A
Palisades Park, NJ 07650
|
- sq. feet
|
- baths - beds |
show details | |

|
#7
2nd St Apt A
Palisades Park, NJ 07650
|
2,448 sq. feet
|
- baths - beds |
show details | |

|
#8
3rd St # A
Palisades Park, NJ 07650
|
1,529 sq. feet
|
- baths - beds |
show details | |

|
#9
Borough Ln
Palisades Park, NJ 07650
|
3,132 sq. feet
|
- baths - beds |
show details | |

|
#10
Grand Ave, Apt 1
Palisades Park, NJ 07650
|
- sq. feet
|
- baths - beds |
show details |
| Photo | Address | Area | Beds / Baths | Price | Details |
|---|---|---|---|---|---|

|
#11
Edsall Blvd
Palisades Park, NJ 07650
|
- sq. feet
|
- baths - beds |
show details | |

|
#12
E Columbia Ave # B
Palisades Park, NJ 07650
|
- sq. feet
|
- baths - beds |
show details | |

|
#13
7th St
Palisades Park, NJ 07650
|
- sq. feet
|
- baths - beds |
show details | |

|
#14
Glen Ave
Palisades Park, NJ 07650
|
- sq. feet
|
- baths - beds |
show details | |

|
#15
11th St
Palisades Park, NJ 07650
|
- sq. feet
|
- baths - beds |
show details | |

|
#16
9th St # A
Palisades Park, NJ 07650
|
1,860 sq. feet
|
- baths - beds |
show details | |

|
#17
E Edsall Blvd # A
Palisades Park, NJ 07650
|
- sq. feet
|
- baths - beds |
show details | |

|
#18
W Edsall Blvd Apt 137a
Palisades Park, NJ 07650
|
- sq. feet
|
- baths - beds |
show details | |

|
#19
E Edsall Ave Apt D2
Palisades Park, NJ 07650
|
- sq. feet
|
- baths - beds |
show details | |

|
#20
Bergen Blvd Apt 10a
Palisades Park, NJ 07650
|
- sq. feet
|
- baths - beds |
show details |
| Photo | Address | Area | Beds / Baths | Price | Details |
|---|---|---|---|---|---|

|
#21
10th St Apt 1
Palisades Park, NJ 07650
|
2,090 sq. feet
|
- baths - beds |
show details | |

|
#22
1st St
Palisades Park, NJ 07650
|
3,580 sq. feet
|
- baths - beds |
show details | |

|
#23
Momingaide L B
Palisades Park, NJ 07650
|
- sq. feet
|
- baths - beds |
show details | |

|
#24
Route 5
Palisades Park, NJ 07650
|
- sq. feet
|
- baths - beds |
show details | |

|
#25
Roff Ave
Palisades Park, NJ 07650
|
- sq. feet
|
- baths - beds |
show details | |

|
#26
Glen Ave # 1
Palisades Park, NJ 07650
|
3,072 sq. feet
|
- baths - beds |
show details | |

|
#27
2nd Ave # 5c
New York, NY 10029
|
550 sq. feet
|
1 baths 1 beds |
$448,900
|
show details |

|
#28
Fordham Hill Oval
Bronx, NY 10468
|
700 sq. feet
|
1 baths 1 beds |
$154,900
|
show details |

|
#29
96th St
Ozone Park, NY 11417
|
1,520 sq. feet
|
2 baths 3 beds |
$729,900
|
show details |

|
#30
Wales Ave
River Edge, NJ 07661
|
4,223 sq. feet
|
2 baths 4 beds |
$624,000
|
show details |
| Photo | Address | Area | Beds / Baths | Price | Details |
|---|---|---|---|---|---|

|
#31
Central Park Ave Apt 9m
Yonkers, NY 10710
|
1,300 sq. feet
|
2 baths 3 beds |
$319,900
|
show details |

|
#32
Bay 19th St
Brooklyn, NY 11214
|
880 sq. feet
|
1 baths 2 beds |
$425,000
|
show details |

|
#33
E 221st St
Bronx, NY 10467
|
1,890 sq. feet
|
2 baths 3 beds |
$554,900
|
show details |

|
#34
17th Ave 1st Floor
Whitestone, NY 11357
|
610 sq. feet
|
1 baths 1 beds |
$229,900
|
show details |

|
#35
Park Ave Apt 12
North Bergen, NJ 07047
|
835 sq. feet
|
1 baths 2 beds |
$379,900
|
show details |

|
#36
Tilden St # 4b
Bronx, NY 10467
|
1,000 sq. feet
|
1 baths 2 beds |
$139,900
|
show details |

|
#37
E 73rd St
New York, NY 10021
|
1,253 sq. feet
|
2 baths 2 beds |
$715,000
|
show details |

|
#38
Summer St Apt 5e
Passaic, NJ 07055
|
1,125 sq. feet
|
1 baths 2 beds |
$345,000
|
show details |

|
#39
Forest Ave
Paramus, NJ 07652
|
2,428 sq. feet
|
3 baths 5 beds |
$749,900
|
show details |

|
#40
Garth Rd Apt E6a
Scarsdale, NY 10583
|
1,450 sq. feet
|
2 baths 2 beds |
$454,900
|
show details |
| Photo | Address | Area | Beds / Baths | Price | Details |
|---|---|---|---|---|---|

|
#41
Horizon Rd Apt 803
Fort Lee, NJ 07024
|
843 sq. feet
|
1 baths 1 beds |
$178,900
|
show details |

|
#42
N Broadway Apt A6
Yonkers, NY 10701
|
950 sq. feet
|
2 baths 2 beds |
$219,900
|
show details |

|
#43
A Somers St
Brooklyn, NY 11233
|
1,830 sq. feet
|
2 baths 4 beds |
$749,900
|
show details |

|
#44
Bloomfield Ave
Caldwell, NJ 07006
|
1,216 sq. feet
|
2 baths 2 beds |
$400,000
|
show details |

|
#45
Passaic St
Hackensack, NJ 07601
|
2,211 sq. feet
|
1 baths 5 beds |
$619,900
|
show details |

|
#46
177th St
Jamaica, NY 11433
|
1,156 sq. feet
|
1 baths 3 beds |
$450,000
|
show details |

|
#47
Midland Ave Apt 4h
Bronxville, NY 10708
|
900 sq. feet
|
1 baths 1 beds |
$184,000
|
show details |

|
#48
90th St Apt 5d
Jackson Heights, NY 11372
|
1,000 sq. feet
|
1 baths 2 beds |
$289,900
|
show details |

|
#49
72nd Avenue
Bellerose, NY 11426
|
850 sq. feet
|
1 baths 1 beds |
$269,900
|
show details |

|
Check over 1 million property listings on Foreclosure.com!
|
browse all offers | |||


 | House Conversion in Palisades Park/Bergen County?? (1 reply) |
| Is renting a room of a house illegal? (23 replies) |
| Korean Community Palisades Park Area? (7 replies) |
| Mother of Palisades Park Mayor James Rotundo Post Racist Rant On FB (95 replies) |
| Fort lee- best area to buy a house (8 replies) |
| Where to live (and demographic questions..) (17 replies) |

Median year apartment built: 1979
Household type by relationship:
Households: 20,225- Male householders: 3,594 (603 living alone), Female householders: 3,523 (724 living alone)
3,523 spouses (3,447 opposite-sex spouses), 280 unmarried partners, (280 opposite-sex unmarried partners), 5,527 children (5,310 natural, 0 adopted, 216 stepchildren), 138 grandchildren, 780 brothers or sisters, 1,368 parents, 0 foster children, 546 other relatives, 931 non-relatives
- In group quarters: 9
Size of family households: 1,802 2-persons, 1,850 3-persons, 959 4-persons, 575 5-persons, 254 6-persons, 81 7-or-more-persons.
Size of nonfamily households: 1,373 1-person, 226 2-persons, 55 3-persons, 40 4-persons.
1,786 married couples with children.
725 single-parent households (201 men, 524 women).
24.5% of residents of Palisades Park speak English at home.
16.8% of residents speak Spanish at home (48% speak English very well, 28% speak English well, 24% speak English not well).
7.0% of residents speak other Indo-European language at home (61% speak English very well, 30% speak English well, 8% speak English not well, 1% don't speak English at all).
52.1% of residents speak Asian or Pacific Island language at home (38% speak English very well, 25% speak English well, 31% speak English not well, 6% don't speak English at all).
0.6% of residents speak other language at home (46% speak English very well, 35% speak English well, 20% speak English not well).
Foreign born population: 12,482 (61.7%)
(59.3% of them are naturalized citizens)
| Here: | 5.8 |
| State: | 6.8 |
| Here: | 4.0 |
| State: | 3.9 |

- Bedrooms in owner-occupied houses and condos in Palisades Park, New Jersey
- 101no bedroom
- 1021 bedroom
- 3842 bedrooms
- 1,4623 bedrooms
- 5404 bedrooms
- 1105+ bedrooms

- Bedrooms in renter-occupied apartments in Palisades Park, New Jersey
- 407no bedroom
- 8721 bedroom
- 1,5482 bedrooms
- 1,3293 bedrooms
- 3044 bedrooms
- 425+ bedrooms

- Cars and other vehicles available in Palisades Park in owner-occupied houses/condos
- 169no vehicle
- 7421 vehicle
- 1,0982 vehicles
- 4903 vehicles
- 1514 vehicles
- 525+ vehicles

- Cars and other vehicles available in Palisades Park in renter-occupied apartments
- 865no vehicle
- 1,8881 vehicle
- 1,2762 vehicles
- 2843 vehicles
- 744 vehicles
- 1155+ vehicles

- Rooms in owner-occupied houses in Palisades Park, New Jersey
- 1011 room
- 422 rooms
- 1543 rooms
- 2304 rooms
- 4515 rooms
- 8646 rooms
- 4607 rooms
- 1808 rooms
- 2189+ rooms

- Rooms in renter-occupied apartments in Palisades Park, New Jersey
- 4071 room
- 2912 rooms
- 7703 rooms
- 1,2474 rooms
- 7415 rooms
- 6736 rooms
- 1827 rooms
- 928 rooms
- 999+ rooms


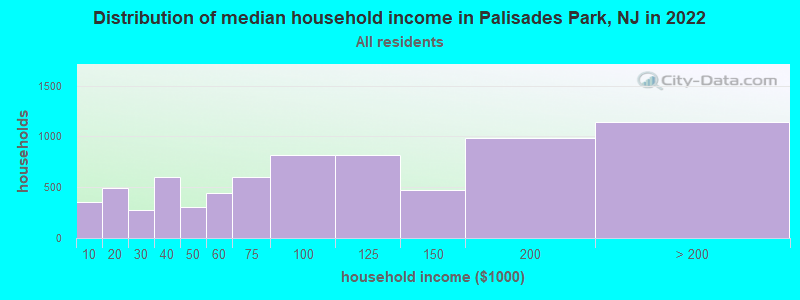
Palisades Park, NJ household income distribution

- 353Less than $10,000
- 488$10,000 to $19,999
- 272$20,000 to $29,999
- 596$30,000 to $39,999
- 307$40,000 to $49,999
- 443$50,000 to $59,999
- 598$60,000 to $74,999
- 817$75,000 to $99,999
- 814$100,000 to $124,999
- 472$125,000 to $149,999
- 983$150,000 to $199,999
- 1,142$200,000 or more
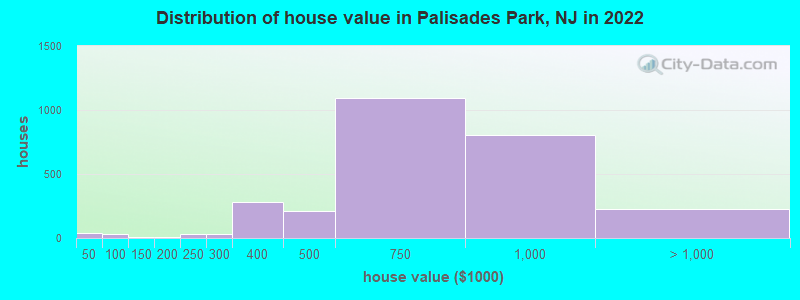
Home value of owner - occupied houses in 2022 in Palisades Park, NJ
-
- 40Less than $10,000
- 15$70,000 to $79,999
- 14$90,000 to $99,999
- 6$100,000 to $124,999
- 7$175,000 to $199,999
- 34$200,000 to $249,999
- 32$250,000 to $299,999
- 278$300,000 to $399,999
- 211$400,000 to $499,999
- 1,090$500,000 to $749,999
- 804$750,000 to $999,999
- 217$1,000,000 to $1,499,999
- 10$1,500,000 to $1,999,999
Rent paid by renters in 2022 in Palisades Park, NJ
-
- 89$100 to $149
- 33$600 to $649
- 38$700 to $749
- 6$750 to $799
- 41$800 to $899
- 98$900 to $999
- 356$1,000 to $1,249
- 596$1,250 to $1,499
- 1,381$1,500 to $1,999
- 902$2,000 to $2,499
- 605$2,500 to $2,999
- 54$3,000 to $3,499
- 119$3,500 or more
- 106No cash rent


Percentage of workers working in this county: 62.0%
Number of people working at home: 1,232 (10.9% of all workers)
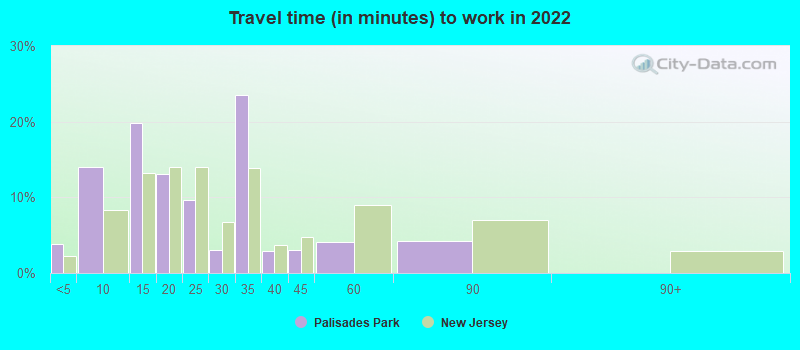
Travel time to work (commute)
- Less than 5 minutes: 149
- 5 to 9 minutes: 898
- 10 to 14 minutes: 1,063
- 15 to 19 minutes: 818
- 20 to 24 minutes: 1,479
- 25 to 29 minutes: 789
- 30 to 34 minutes: 1,291
- 35 to 39 minutes: 88
- 40 to 44 minutes: 437
- 45 to 59 minutes: 926
- 60 to 89 minutes: 1,461
- 90 or more minutes: 314
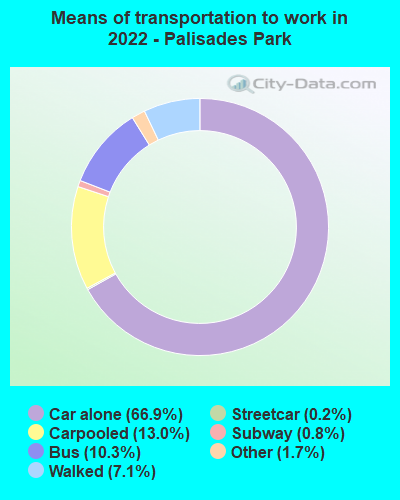
Means of transportation to work:
- Drove a car alone: 2,291 (49.5%)
- Carpooled: 535 (11.6%)
- Bus: 322 (7.0%)
- Subway or elevated rail: 7 (0.2%)
- Long-distance train or commuter rail: 16 (0.3%)
- Taxi: 64 (1.4%)
- Walked: 259 (5.6%)
- Worked at home: 1,232 (26.6%)

- Unemployment by race in 2022
- Unemployment rate for White non-Hispanic residents
- 0.8%Females
- Unemployment rate for Asian residents
- 5.5%Males
- 5.9%Females
- Unemployment rate for other race residents
- 7.2%Males
- 4.3%Females
- Unemployment rate for two or more race residents
- 2.2%Males
- 3.4%Females
- Unemployment rate for Hispanic or Latino residents
- 10.3%Males
- 7.5%Females

- Year of entry for the foreign-born population in Palisades Park, New Jersey
- 3,2472010 or later
- 2,6742000 to 2009
- 2,5781990 to 1999
- 2,6921980 to 1989
- 1,1671970 to 1979
- 1,163Before 1970

First ancestries reported:
- Italian: 304 (2.2%)
- American: 276 (2.0%)
- Greek: 142 (1.0%)
- Armenian: 122 (0.9%)
- Jordanian: 105 (0.8%)
- Syrian: 70 (0.5%)
- Polish: 57 (0.4%)
- Jamaican: 55 (0.4%)
- Czechoslovakian: 38 (0.3%)
- Macedonian: 35 (0.3%)
- Albanian: 34 (0.2%)
- Croatian: 33 (0.2%)
- Irish: 28 (0.2%)
- Lebanese: 26 (0.2%)
- Romanian: 26 (0.2%)
- Guyanese: 24 (0.2%)
- Serbian: 24 (0.2%)
- German: 21 (0.2%)
- Turkish: 19 (0.1%)
- Nigerian: 15 (0.1%)
- Trinidadian and Tobagonian: 15 (0.1%)
- Russian: 9 (0.07%)
- Haitian: 9 (0.07%)
- Ukrainian: 6 (0.04%)
- West Indian: 6 (0.04%)
- English: 5 (0.04%)
- Cypriot: 3 (0.02%)
Most common places of birth for foreign-born residents (%):
| Palisades Park: | 63.2% (7,892) |
| New Jersey: | 3.3% (70,512) |
| Palisades Park: | 7.8% (971) |
| New Jersey: | 2.2% (46,813) |
| Palisades Park: | 3.8% (479) |
| New Jersey: | 4.2% (90,817) |
| Palisades Park: | 3.7% (459) |
| New Jersey: | 3.7% (78,969) |
| Palisades Park: | 2.3% (286) |
| New Jersey: | 9.7% (209,055) |
| Palisades Park: | 2.2% (278) |
| New Jersey: | 12.8% (274,609) |
Place of birth for U.S.-born residents:
- This state: 4,651
- Other state: 3,037
- Northeast: 2,198
- Midwest: 87
- South: 379
- West: 446
87.1% of Palisades Park residents lived in the same house 1 years ago.
Out of people who lived in different houses, 43.2% lived in this county.
Out of people who lived in different counties, 64.0% lived in New Jersey.
| Palisades Park: | 87.1% |
| State average: | 90.4% |
Education attainment for males 25 years and older:
- No schooling: 547
- Nursery to 4th grade: 75
- 5th and 6th grade: 91
- 7th and 8th grade: 45
- 9th grade: 14
- 10th grade: 0
- 11th grade: 47
- 12th grade, no diploma: 69
- High school graduate (or equivalency): 1,540
- Less than 1 year of college: 247
- Some college more than 1 year, no degree: 452
- Associate degree: 323
- Bachelor's degree: 3,070
- Master's degree: 656
- Professional school degree: 131
- Doctorate degree: 73

Education attainment for females 25 years and older:
- No schooling: 261
- Nursery to 4th grade: 23
- 5th and 6th grade: 86
- 7th and 8th grade: 95
- 9th grade: 4
- 10th grade: 36
- 11th grade: 16
- 12th grade, no diploma: 140
- High school graduate (or equivalency): 1,533
- Less than 1 year of college: 355
- Some college more than 1 year, no degree: 570
- Associate degree: 561
- Bachelor's degree: 3,449
- Master's degree: 760
- Professional school degree: 204
- Doctorate degree: 80


Housing units in structures:
- One, detached: 983
- One, attached: 1,624
- Two: 2,018
- 3 or 4: 491
- 5 to 9: 396
- 10 to 19: 606
- 20 to 49: 740
- 50 or more: 567
- Mobile homes: 31
Housing units lacking complete kitchen facilities in 2022: 1.6%
House/condo owner moved in on average 10 years ago
Renter moved in on average 3 years ago

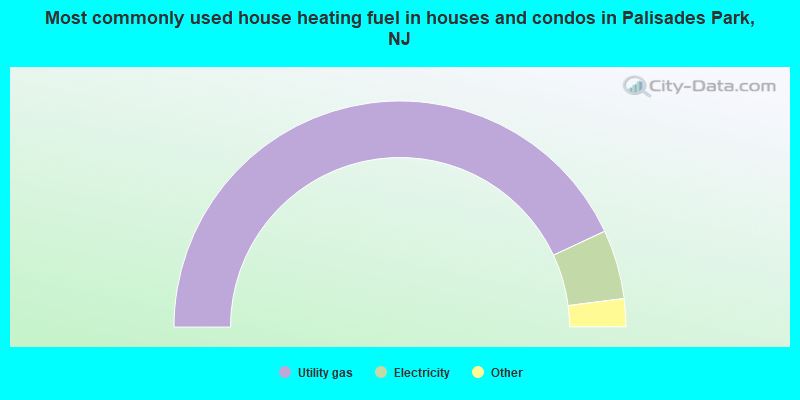
- 86.1%Utility gas
- 9.9%Electricity
- 2.3%Bottled, tank, or LP gas
- 1.7%Fuel oil, kerosene, etc.
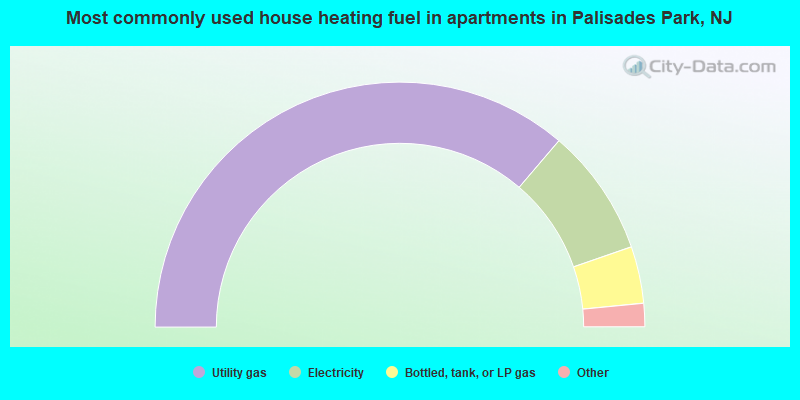
- 72.5%Utility gas
- 16.9%Electricity
- 7.5%Bottled, tank, or LP gas
- 2.3%Fuel oil, kerosene, etc.
- 0.5%No fuel used
- 0.2%Other fuel
Private vs. public school enrollment:
| Here: | 2.7% |
| New Jersey: | 12.3% |
| Here: | 21.8% |
| New Jersey: | 13.1% |
| Here: | 30.2% |
| New Jersey: | 33.2% |


