Pearl City, HI (Hawaii) Houses and Residents
Estimated median house or condo value in 2022: $881,751 (it was $272,100 in 2000 )
Pearl City:
$881,751Hawaii:
$820,100
Lower value quartile - upper value quartile: $643,392 - $1,037,087Mean price in 2022: Detached houses: $941,923 Here:
$941,923State:
$1,035,348
Townhouses or other attached units: $694,700 Here:
$694,700State:
$976,474
In 2-unit structures: $446,416 Here:
$446,416State:
$928,739
In 3-to-4-unit structures: $590,923 Here:
$590,923State:
$758,960
In 5-or-more-unit structures: $420,331 Here:
$420,331State:
$584,974
Total population: 47,698 (Urban population: 30,818, Rural population: 0)
Houses: 15,683 (15,152 occupied: 10,740 owner occupied, 4,459 renter occupied )
% of renters here:
29%State:
37%
Housing density: 3,147 houses/condos per square mile
Median price asked for vacant for-sale houses and condos in 2022: $1,191,087.
Median contract rent in 2022: $1,930 (lower quartile is $1,230, upper quartile is over $2,000)
Median rent asked for vacant for-rent units in 2022: $2,670
Median gross rent in Pearl City, HI in 2022: over $2,000
Housing units in Pearl City with a mortgage: 7,056 (1,407 second mortgage, 98 home equity loan, 1,269 both second mortgage and home equity loan )Houses without a mortgage: 728
Median household income for houses/condos with a mortgage: $134,146
Median household income for apartments without a mortgage: $102,218
Median monthly housing costs: $1,898
Data:
Median house or condo value ($)
Median house or condo value ($ change since 2000)
Median house or condo value ($) - White
Median house or condo value ($) - Black or African American
Median house or condo value ($) - Asian
Median house or condo value ($) - Hispanic or Latino
Median house or condo value ($) - American Indian and Alaska Native
Median house or condo value ($) - Multirace
Median house or condo value ($) - Other Race
Median price asked for mobile homes ($)
Household density (households per square mile)
Mean house or condo value by units in structure - 1, detached ($)
Mean house or condo value by units in structure - 1, attached ($)
Mean house or condo value by units in structure - 2 ($)
Mean house or condo value by units in structure by units in structure - 3 or 4 ($)
Mean house or condo value by units in structure - 5 or more ($)
Mean house or condo value by units in structure - Boat, RV, van, etc. ($)
Mean house or condo value by units in structure - Mobile home ($)
Median contract rent ($)
Median contract rent - Lower quartile ($)
Median contract rent - Upper quartile ($)
Median gross rent ($)
Urban houses (%)
Rural houses (%)
Houses occupied (%)
Houses occupied (% change since 2000)
Houses owner occupied (%)
Houses owner occupied (% change since 2000)
Houses renter occupied (%)
Houses renter occupied (% change since 2000)
Vacant housing units - For rent (%)
Vacant housing units - For rent (% change since 2000)
Vacant housing units - For sale only (%)
Vacant housing units - For sale only (% change since 2000)
Vacant housing units - Rented or sold, not occupied (%)
Vacant housing units - Rented or sold, not occupied (% change since 2000)
Vacant housing units - For seasonal, recreational, or occasional use (%)
Vacant housing units - For seasonal, recreational, or occasional use (% change since 2000)
Vacant housing units - For migrant workers (%)
Vacant housing units - For migrant workers (% change since 2000)
Vacant housing units - Other vacant (%)
Vacant housing units - Other vacant (% change since 2000)
Median monthly housing costs ($)
Median household income for houses/condos with a mortgage ($)
Median household income for houses/condos without a mortgage ($)
Median household income ($)
Median household income ($) - White
Median household income ($) - Black or African American
Median household income ($) - Asian
Median household income ($) - Hispanic or Latino
Median household income ($) - American Indian and Alaska Native
Median household income ($) - Multirace
Median household income ($) - Other Race
Mortgage status - with mortgage (%)
Mortgage status - with second mortgage (%)
Mortgage status - with home equity loan (%)
Mortgage status - with both second mortgage and home equity loan (%)
Mortgage status - without a mortgage (%)
Median year house/condo built
Median year apartment built
Household type by relationship - Male householder living alone (%)
Household type by relationship - Male householder not living alone (%)
Household type by relationship - Female householder living alone (%)
Household type by relationship - Female householder not living alone (%)
Household type by relationship - Opposite-Sex spouse (%)
Household type by relationship - Same-Sex spouse (%)
Household type by relationship - Opposite-Sex unmarried partner (%)
Household type by relationship - Same-Sex unmarried partner (%)
Household type by relationship - In group quarters (%)
Size of family households - 2-person household (%)
Size of family households - 3-person household (%)
Size of family households - 4-person household (%)
Size of family households - 5-person household (%)
Size of family households - 6-person household (%)
Size of family households - 7-or-more-person household (%)
Size of nonfamily households - 1-person household (%)
Size of nonfamily households - 2-person household (%)
Size of nonfamily households - 3-person household (%)
Size of nonfamily households - 4-person household (%)
Size of nonfamily households - 5-person household (%)
Size of nonfamily households - 6-person household (%)
Size of nonfamily households - 7-or-moreperson household (%)
Year house built - Built 2010 or later (%)
Year house built - Built 2000 to 2009 (%)
Year house built - Built 1990 to 1999 (%)
Year house built - Built 1980 to 1989 (%)
Year house built - Built 1970 to 1979 (%)
Year house built - Built 1960 to 1969 (%)
Year house built - Built 1950 to 1959 (%)
Year house built - Built 1940 to 1949 (%)
Year house built - Built 1939 or earlier (%)
Median number of rooms in houses and condos
Median number of rooms in apartments
Median number of bedrooms in owner occupied houses
Mean number of bedrooms in owner occupied houses
Median number of bedrooms in renter occupied houses
Mean number of bedrooms in renter occupied houses
Median number of vehichles in owner occupied houses
Mean number of vehichles in owner occupied houses
Median number of vehichles in renter occupied houses
Mean number of vehichles in renter occupied houses
Rooms in owner-occupied houses - 1 room (%)
Rooms in owner-occupied houses - 2 rooms (%)
Rooms in owner-occupied houses - 3 rooms (%)
Rooms in owner-occupied houses - 4 rooms (%)
Rooms in owner-occupied houses - 5 rooms (%)
Rooms in owner-occupied houses - 6 rooms (%)
Rooms in owner-occupied houses - 7 rooms (%)
Rooms in owner-occupied houses - 8 rooms (%)
Rooms in owner-occupied houses - 9+ rooms (%)
Rooms in renter-occupied houses - 1 room (%)
Rooms in renter-occupied houses - 2 rooms (%)
Rooms in renter-occupied houses - 3 rooms (%)
Rooms in renter-occupied houses - 4 rooms (%)
Rooms in renter-occupied houses - 5 rooms (%)
Rooms in renter-occupied houses - 6 rooms (%)
Rooms in renter-occupied houses - 7 rooms (%)
Rooms in renter-occupied houses - 8 rooms (%)
Rooms in renter-occupied houses - 9+ rooms (%)
Bedrooms in owner-occupied houses - no bedrooms (%)
Bedrooms in owner-occupied houses - 1 bedroom (%)
Bedrooms in owner-occupied houses - 2 bedrooms (%)
Bedrooms in owner-occupied houses - 3 bedrooms (%)
Bedrooms in owner-occupied houses - 4 bedrooms (%)
Bedrooms in owner-occupied houses - 5+ bedrooms (%)
Bedrooms in renter-occupied houses - no bedrooms (%)
Bedrooms in renter-occupied houses - 1 bedroom (%)
Bedrooms in renter-occupied houses - 2 bedrooms (%)
Bedrooms in renter-occupied houses - 3 bedrooms (%)
Bedrooms in renter-occupied houses - 4 bedrooms (%)
Bedrooms in renter-occupied houses - 5+ bedrooms (%)
Vehicles available in owner-occupied houses - no vehicle available (%)
Vehicles available in owner-occupied houses - 1 vehicle available(%)
Vehicles available in owner-occupied houses - 2 Vehicles available (%)
Vehicles available in owner-occupied houses - 3 Vehicles available (%)
Vehicles available in owner-occupied houses - 4 Vehicles available (%)
Vehicles available in owner-occupied houses - 5+ Vehicles available (%)
Vehicles available in renter-occupied houses - no vehicle available (%)
Vehicles available in renter-occupied houses - 1 vehicle available (%)
Vehicles available in renter-occupied houses - 2 Vehicles available (%)
Vehicles available in renter-occupied houses - 3 Vehicles available (%)
Vehicles available in renter-occupied houses - 4 Vehicles available (%)
Vehicles available in renter-occupied houses - 5+ Vehicles available (%)
Housing units in structures - 1, detached (%)
Housing units in structures - 1, attached (%)
Housing units in structures - 2 (%)
Housing units in structures - 3 or 4 (%)
Housing units in structures - 5 to 9 (%)
Housing units in structures - 10 to 19 (%)
Housing units in structures - 20 to 49 (%)
Housing units in structures - 50 or more (%)
Housing units in structures - Mobile home (%)
Housing units in structures - Boat, RV, van, etc. (%)
Housing units in structures - Owners - 1, detached (%)
Housing units in structures - Owners - 1, attached (%)
Housing units in structures - Owners - 2 (%)
Housing units in structures - Owners - 3 or 4 (%)
Housing units in structures - Owners - 5 to 9 (%)
Housing units in structures - Owners - 10 to 19 (%)
Housing units in structures - Owners - 20 to 49 (%)
Housing units in structures - Owners - 50 or more (%)
Housing units in structures - Owners - Mobile home (%)
Housing units in structures - Owners - Boat, RV, van, etc. (%)
Housing units in structures - Renters - 1, detached (%)
Housing units in structures - Renters - 1, attached (%)
Housing units in structures - Renters - 2 (%)
Housing units in structures - Renters - 3 or 4 (%)
Housing units in structures - Renters - 5 to 9 (%)
Housing units in structures - Renters - 10 to 19 (%)
Housing units in structures - Renters - 20 to 49 (%)
Housing units in structures - Renters - 50 or more (%)
Housing units in structures - Renters - Mobile home (%)
Housing units in structures - Renters - Boat, RV, van, etc. (%)
House/condo owner moved in on average (years ago)
Renter moved in on average (years ago)
Year householder moved into unit - Moved in 1999 to March 2000 (%)
Year householder moved into unit - Moved in 1999 to March 2000 (%) - White
Year householder moved into unit - Moved in 1999 to March 2000 (%) - Black or African American
Year householder moved into unit - Moved in 1999 to March 2000 (%) - Asian
Year householder moved into unit - Moved in 1999 to March 2000 (%) - Hispanic or Latino
Year householder moved into unit - Moved in 1999 to March 2000 (%) - American Indian and Alaska Native
Year householder moved into unit - Moved in 1999 to March 2000 (%) - Multirace
Year householder moved into unit - Moved in 1999 to March 2000 (%) - Other Race
Year householder moved into unit - Moved in 1995 to 1998 (%)
Year householder moved into unit - Moved in 1995 to 1998 (%) - White
Year householder moved into unit - Moved in 1995 to 1998 (%) - Black or African American
Year householder moved into unit - Moved in 1995 to 1998 (%) - Asian
Year householder moved into unit - Moved in 1995 to 1998 (%) - Hispanic or Latino
Year householder moved into unit - Moved in 1995 to 1998 (%) - American Indian and Alaska Native
Year householder moved into unit - Moved in 1995 to 1998 (%) - Multirace
Year householder moved into unit - Moved in 1995 to 1998 (%) - Other Race
Year householder moved into unit - Moved in 1990 to 1994 (%)
Year householder moved into unit - Moved in 1990 to 1994 (%) - White
Year householder moved into unit - Moved in 1990 to 1994 (%) - Black or African American
Year householder moved into unit - Moved in 1990 to 1994 (%) - Asian
Year householder moved into unit - Moved in 1990 to 1994 (%) - Hispanic or Latino
Year householder moved into unit - Moved in 1990 to 1994 (%) - American Indian and Alaska Native
Year householder moved into unit - Moved in 1990 to 1994 (%) - Multirace
Year householder moved into unit - Moved in 1990 to 1994 (%) - Other Race
Year householder moved into unit - Moved in 1980 to 1989 (%)
Year householder moved into unit - Moved in 1980 to 1989 (%) - White
Year householder moved into unit - Moved in 1980 to 1989 (%) - Black or African American
Year householder moved into unit - Moved in 1980 to 1989 (%) - Asian
Year householder moved into unit - Moved in 1980 to 1989 (%) - Hispanic or Latino
Year householder moved into unit - Moved in 1980 to 1989 (%) - American Indian and Alaska Native
Year householder moved into unit - Moved in 1980 to 1989 (%) - Multirace
Year householder moved into unit - Moved in 1980 to 1989 (%) - Other Race
Year householder moved into unit - Moved in 1970 to 1979 (%)
Year householder moved into unit - Moved in 1970 to 1979 (%) - White
Year householder moved into unit - Moved in 1970 to 1979 (%) - Black or African American
Year householder moved into unit - Moved in 1970 to 1979 (%) - Asian
Year householder moved into unit - Moved in 1970 to 1979 (%) - Hispanic or Latino
Year householder moved into unit - Moved in 1970 to 1979 (%) - American Indian and Alaska Native
Year householder moved into unit - Moved in 1970 to 1979 (%) - Multirace
Year householder moved into unit - Moved in 1970 to 1979 (%) - Other Race
Year householder moved into unit - Moved in 1969 or earlier (%)
Year householder moved into unit - Moved in 1969 or earlier (%) - White
Year householder moved into unit - Moved in 1969 or earlier (%) - Black or African American
Year householder moved into unit - Moved in 1969 or earlier (%) - Asian
Year householder moved into unit - Moved in 1969 or earlier (%) - Hispanic or Latino
Year householder moved into unit - Moved in 1969 or earlier (%) - American Indian and Alaska Native
Year householder moved into unit - Moved in 1969 or earlier (%) - Multirace
Year householder moved into unit - Moved in 1969 or earlier (%) - Other Race
Housing units lacking complete plumbing facilities (%)
Housing units lacking complete kitchen facilities (%)
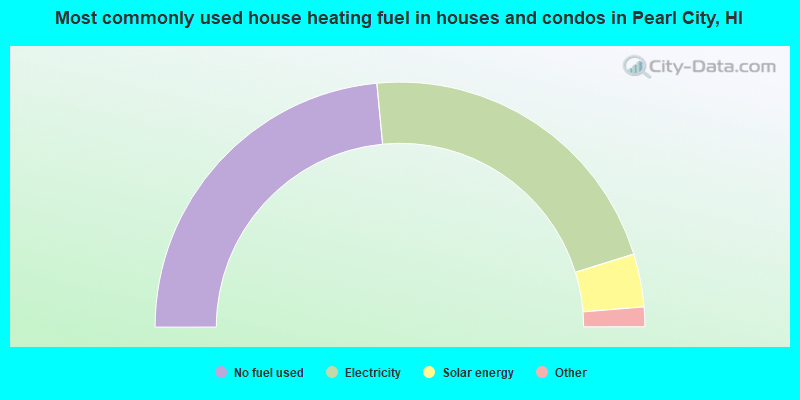
House heating fuel used in houses and condos - Utility gas (%)
House heating fuel used in houses and condos - Bottled, tank, or LP gas (%)
House heating fuel used in houses and condos - Electricity (%)
House heating fuel used in houses and condos - Fuel oil, kerosene, etc. (%)
House heating fuel used in houses and condos - Coal or coke (%)
House heating fuel used in houses and condos - Wood (%)
House heating fuel used in houses and condos - Solar energy (%)
House heating fuel used in houses and condos - Other fuel (%)
House heating fuel used in houses and condos - No fuel used (%)
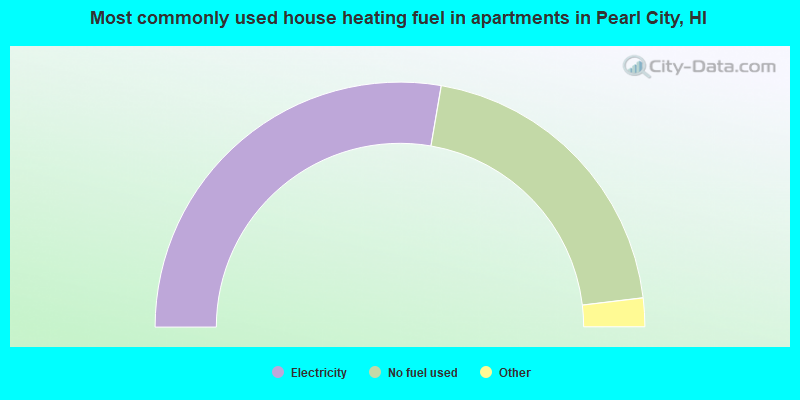
House heating fuel used in apartments - Utility gas (%)
House heating fuel used in apartments - Bottled, tank, or LP gas (%)
House heating fuel used in apartments - Electricity (%)
House heating fuel used in apartments - Fuel oil, kerosene, etc. (%)
House heating fuel used in apartments - Coal or coke (%)
House heating fuel used in apartments - Wood (%)
House heating fuel used in apartments - Solar energy (%)
House heating fuel used in apartments - Other fuel (%)
House heating fuel used in apartments - No fuel used (%)
Median year house/condo built: 1972Median year apartment built: 1982Household type by relationship:
Households: 46,141
Male householders: 7,321 (1,327 living alone ), Female householders: 7,450 (1,821 living alone )8,013 spouses (7,926 opposite-sex spouses ), 605 unmarried partners , (579 opposite-sex unmarried partners ), 12,221 children (11,594 natural , 286 adopted , 340 stepchildren ), 2,896 grandchildren , 1,079 brothers or sisters , 1,593 parents , 0 foster children , 2,481 other relatives , 1,852 non-relatives In group quarters: 624
Size of family households: 4,062 2-persons , 2,438 3-persons , 2,287 4-persons , 911 5-persons , 803 6-persons , 524 7-or-more-persons .
Size of nonfamily households: 3,335 1-person , 578 2-persons , 136 3-persons , 54 4-persons , 23 5-persons , 3 6-persons .
4,358 married couples with children. single-parent households (448 men , 876 women ).
81.0% of residents of Pearl City speak English at home. of residents speak Spanish at home (86% speak English very well , 3% speak English well , 8% speak English not well , 2% don't speak English at all ).of residents speak other Indo-European language at home (88% speak English very well , 12% speak English well ).of residents speak Asian or Pacific Island language at home (51% speak English very well , 33% speak English well , 15% speak English not well , 1% don't speak English at all ).of residents speak other language at home (100% speak English very well ).
Foreign born population: 6,928 (15.0%)of them are naturalized citizens )
Median number of rooms in houses and condos:
Median number of rooms in apartments
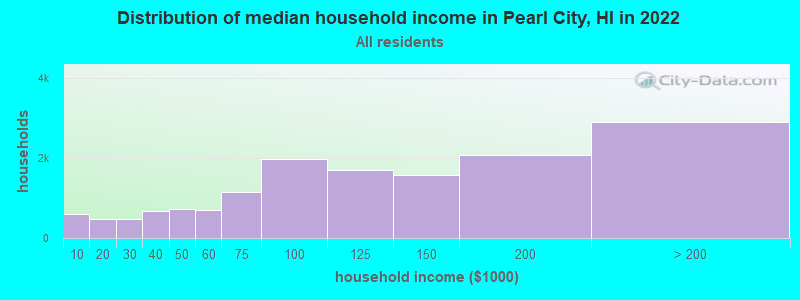
Pearl City, HI household income distribution 594 Less than $10,000483 $10,000 to $19,999463 $20,000 to $29,999663 $30,000 to $39,999724 $40,000 to $49,999688 $50,000 to $59,9991,149 $60,000 to $74,9991,980 $75,000 to $99,9991,703 $100,000 to $124,9991,575 $125,000 to $149,9992,072 $150,000 to $199,9992,900 $200,000 or more
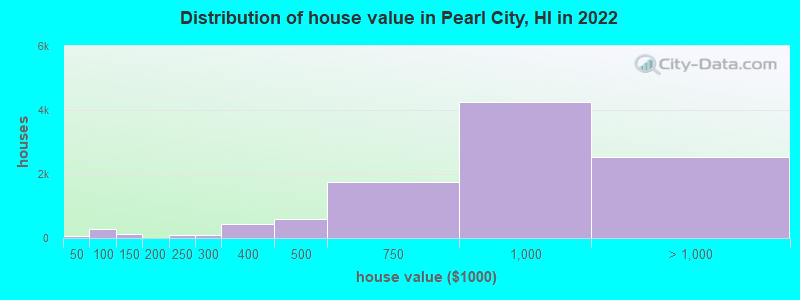
Home value of owner - occupied houses in 2022 in Pearl City, HI 14 Less than $10,00010 $10,000 to $14,99925 $20,000 to $24,99914 $50,000 to $59,99980 $70,000 to $79,99998 $80,000 to $89,99987 $90,000 to $99,999127 $100,000 to $124,99991 $200,000 to $249,99985 $250,000 to $299,999439 $300,000 to $399,999593 $400,000 to $499,9991,743 $500,000 to $749,9994,261 $750,000 to $999,9992,210 $1,000,000 to $1,499,999168 $1,500,000 to $1,999,999147 $2,000,000 or moreRent paid by renters in 2022 in Pearl City, HI 18 Less than $10025 $100 to $14912 $150 to $1995 $250 to $29922 $350 to $39942 $400 to $4496 $450 to $49928 $500 to $54967 $550 to $599135 $600 to $649137 $650 to $69983 $700 to $74927 $750 to $79968 $800 to $89998 $900 to $999348 $1,000 to $1,249448 $1,250 to $1,499626 $1,500 to $1,999632 $2,000 to $2,499802 $2,500 to $2,999236 $3,000 to $3,499267 $3,500 or more275 No cash rent
Percentage of workers working in this county: 99.1%Number of people working at home: 2,200 (9.6% of all workers )
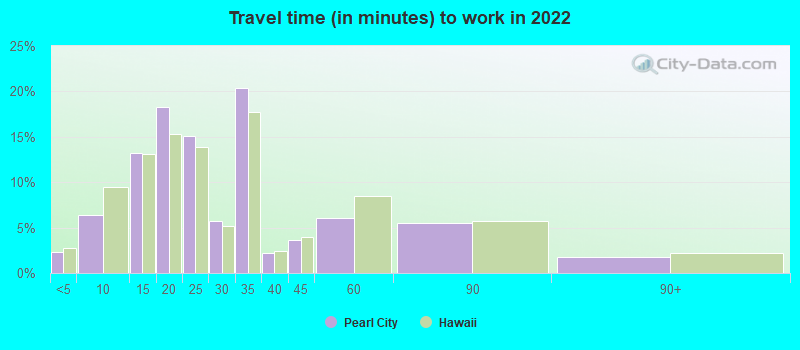
Travel time to work (commute)
Less than 5 minutes: 2105 to 9 minutes: 78610 to 14 minutes: 1,76415 to 19 minutes: 3,18720 to 24 minutes: 4,00025 to 29 minutes: 1,56730 to 34 minutes: 4,78835 to 39 minutes: 54940 to 44 minutes: 86645 to 59 minutes: 1,87060 to 89 minutes: 97790 or more minutes: 270
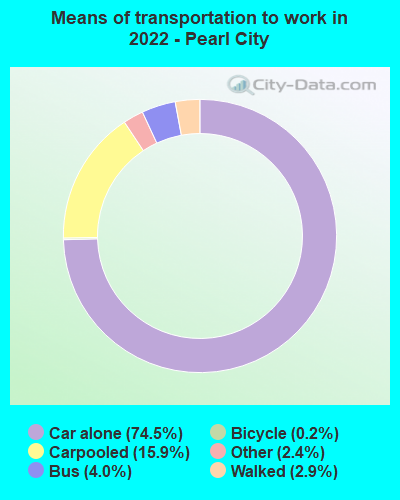
Means of transportation to work:
Drove a car alone: 7,608 (61.2%)Carpooled: 1,854 (14.9%)Bus : 350 (2.8%)Light rail, streetcar or trolley : 6 (0.0%)Taxi: 268 (2.2%)Bicycle: 26 (0.2%)Walked: 335 (2.7%)Worked at home: 2,200 (17.7%)
Unemployment by race in 2022
Unemployment rate for White non-Hispanic residents 4.3% Males5.4% FemalesUnemployment rate for Asian residents 1.1% Males1.4% FemalesUnemployment rate for two or more race residents 4.4% Males1.0% FemalesUnemployment rate for Hispanic or Latino residents 0.8% Males0.6% Females
Year of entry for the foreign-born population in Pearl City, Hawaii
1,063 2010 or later 1,344 2000 to 2009 1,201 1990 to 1999 893 1980 to 1989 951 1970 to 1979 1,354 Before 1970
First ancestries reported:
English: 233 (0.9%)
Portuguese: 160 (0.6%)
German: 150 (0.6%)
American: 127 (0.5%)
Jamaican: 122 (0.5%)
Dutch: 62 (0.2%)
Norwegian: 61 (0.2%)
Irish: 55 (0.2%)
French: 47 (0.2%)
Italian: 42 (0.2%)
Greek: 33 (0.1%)
Swedish: 32 (0.1%)
European: 27 (0.1%)
Russian: 26 (0.1%)
Brazilian: 25 (0.10%)
Polish: 24 (0.09%)
Hungarian: 23 (0.09%)
French Canadian: 20 (0.08%)
Yugoslavian: 16 (0.06%)
Northern European: 11 (0.04%)
Scotch-Irish: 9 (0.03%)
African: 8 (0.03%)
Australian: 7 (0.03%)
Swiss: 6 (0.02%)
British: 4 (0.02%)
Danish: 3 (0.01%)
Scottish: 3 (0.01%)
Arab: 2 (0.01%)
Finnish: 2 (0.01%) Most common places of birth for foreign-born residents (%): Philippines Pearl City:
48.1% (3,548)Hawaii:
44.3% (115,679)
Japan Pearl City:
11.5% (846)Hawaii:
8.5% (22,321)
Oceania, n.e.c. Pearl City:
6.9% (508)Hawaii:
3.7% (9,622)
Korea Pearl City:
5.6% (416)Hawaii:
5.9% (15,525)
Vietnam Pearl City:
4.9% (358)Hawaii:
3.6% (9,389)
China, excluding Hong Kong and Taiwan Pearl City:
3.8% (280)Hawaii:
7.6% (19,835)
Micronesia Pearl City:
3.7% (272)Hawaii:
4.0% (10,430)
Marshall Islands Pearl City:
3.0% (224)Hawaii:
2.4% (6,146)
Thailand Pearl City:
1.8% (135)Hawaii:
1.3% (3,276)
Place of birth for U.S.-born residents:
This state: 30,261Other state: 7,655Northeast: 886Midwest: 1,051South: 2,591West: 3,143 88.4% of Pearl City residents lived in the same house 1 years ago.
Out of people who lived in different houses, 40.6% lived in this county.
Out of people who lived in different counties, 18.8% lived in Hawaii.
Pearl City:
88.4%State average:
87.8%
Education attainment for males 25 years and older:
No schooling: 115Nursery to 4th grade: 205th and 6th grade: 457th and 8th grade: 869th grade: 3710th grade: 6211th grade: 9412th grade, no diploma: 228High school graduate (or equivalency): 4,185Less than 1 year of college: 1,039Some college more than 1 year, no degree: 2,320Associate degree: 2,232Bachelor's degree: 4,058Master's degree: 1,392Professional school degree: 287Doctorate degree: 147
Education attainment for females 25 years and older:
No schooling: 227Nursery to 4th grade: 705th and 6th grade: 1667th and 8th grade: 509th grade: 1410th grade: 3811th grade: 6112th grade, no diploma: 327High school graduate (or equivalency): 4,523Less than 1 year of college: 941Some college more than 1 year, no degree: 2,115Associate degree: 2,335Bachelor's degree: 4,490Master's degree: 1,830Professional school degree: 552Doctorate degree: 112
Housing units in structures:
One, detached: 9,826One, attached: 2,429Two: 2613 or 4: 7705 to 9: 57710 to 19: 29820 to 49: 29550 or more: 1,172Mobile homes: 51Housing units lacking complete plumbing facilities in 2022: 0.3%Housing units lacking complete kitchen facilities in 2022: 0.8%House/condo owner moved in on average 29 years ago
Renter moved in on average 2 years ago
Private vs. public school enrollment:
Students in private schools in grades 1 to 8 (elementary and middle school): 571 Students in private schools in grades 9 to 12 (high school): 461 Students in private undergraduate colleges: 508