Pismo Beach, CA (California) Houses and Residents
| Pismo Beach: | $1,008,241 |
| California: | $715,900 |
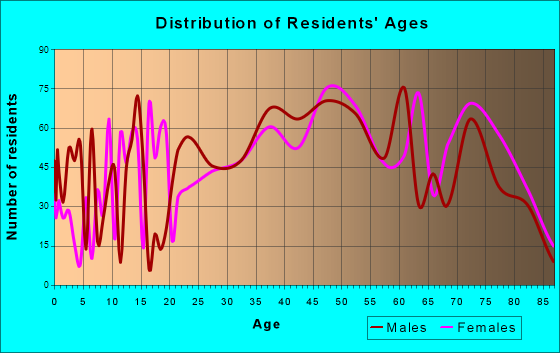
Total population: 7,931 (All urban)
Houses: 6,082 (4,175 occupied: 2,747 owner occupied, 1,502 renter occupied)
| % of renters here: | 35% |
| State: | 44% |
Housing density: 1,683 houses/condos per square mile
Median price asked for vacant for-sale houses and condos in 2022: $1,013,553.
Median contract rent in 2022: over $2,000 (lower quartile is $1,558, upper quartile is over $2,000)
Median rent asked for vacant for-rent units in 2022: $2,531
Median gross rent in Pismo Beach, CA in 2022: over $2,000
Housing units in Pismo Beach with a mortgage: 1,624 (136 second mortgage, 0 home equity loan, 127 both second mortgage and home equity loan)
Houses without a mortgage: 0
Median household income for houses/condos with a mortgage: $118,532
Median household income for apartments without a mortgage: $102,878
Median monthly housing costs: $2,080
Compare current foreclosures near Pismo Beach, CA:
| Photo | Address | Area | Beds / Baths | Price | Details |
|---|---|---|---|---|---|

|
#1
Price St # 203
Pismo Beach, CA 93449
|
- sq. feet
|
- baths - beds |
show details | |

|
#2
La Tijera Ct
Oceano, CA 93445
|
1,161 sq. feet
|
1 baths 3 beds |
show details | |

|
#3
Jupiter Dr
Nipomo, CA 93444
|
2,427 sq. feet
|
2 baths 3 beds |
show details | |

|
#4
Ibis Cir
Guadalupe, CA 93434
|
1,532 sq. feet
|
2 baths 3 beds |
show details | |

|
#5
Viola Ct
Nipomo, CA 93444
|
1,782 sq. feet
|
2 baths 3 beds |
show details | |

|
#6
K St
Santa Margarita, CA 93453
|
1,040 sq. feet
|
2 baths 3 beds |
show details | |

|
#7
Quail Ct
Arroyo Grande, CA 93420
|
1,961 sq. feet
|
2 baths 2 beds |
show details | |

|
#8
Valley Oaks
Arroyo Grande, CA 93420
|
3,722 sq. feet
|
3 baths 4 beds |
show details | |

|
#9
La Serenata Way
Nipomo, CA 93444
|
2,331 sq. feet
|
3 baths 3 beds |
show details | |

|
#10
La Serenata Way
Nipomo, CA 93444
|
2,331 sq. feet
|
3 baths 3 beds |
show details |
| Photo | Address | Area | Beds / Baths | Price | Details |
|---|---|---|---|---|---|

|
#11
Kent St
Nipomo, CA 93444
|
1,160 sq. feet
|
2 baths 3 beds |
show details | |

|
#12
E Branch St
Nipomo, CA 93444
|
1,887 sq. feet
|
2 baths 4 beds |
show details | |

|
#13
E Branch St
Nipomo, CA 93444
|
1,120 sq. feet
|
2 baths 3 beds |
show details | |

|
#14
January St
Nipomo, CA 93444
|
1,803 sq. feet
|
2 baths 3 beds |
show details | |

|
#15
Oconnor Way
San Luis Obispo, CA 93405
|
2,503 sq. feet
|
2 baths 3 beds |
show details | |

|
#16
Pomeroy Rd
Arroyo Grande, CA 93420
|
1,607 sq. feet
|
3 baths 5 beds |
show details | |

|
#17
Johnson Ave
San Luis Obispo, CA 93401
|
708 sq. feet
|
1 baths 2 beds |
show details | |

|
#18
Funston Ave
San Luis Obispo, CA 93401
|
478 sq. feet
|
2 baths 2 beds |
show details | |

|
#19
Southland St
Nipomo, CA 93444
|
934 sq. feet
|
1 baths 2 beds |
show details | |

|
#20
Los Osos Valley Rd Apt 20
San Luis Obispo, CA 93405
|
1,158 sq. feet
|
1 baths 2 beds |
show details |
| Photo | Address | Area | Beds / Baths | Price | Details |
|---|---|---|---|---|---|

|
#21
N 12th St
Grover Beach, CA 93433
|
520 sq. feet
|
2 baths 1 beds |
show details | |

|
#22
Highland Dr
Los Osos, CA 93402
|
3,406 sq. feet
|
3 baths 4 beds |
show details | |

|
#23
Mentone Ave
Grover Beach, CA 93433
|
616 sq. feet
|
1 baths 2 beds |
show details | |

|
#24
Fair Oaks Ave
Arroyo Grande, CA 93420
|
1,427 sq. feet
|
2 baths 3 beds |
show details | |

|
#25
W Williams St
Santa Maria, CA 93458
|
1,316 sq. feet
|
2 baths 3 beds |
show details | |

|
#26
Brighton Ave
Grover Beach, CA 93433
|
1,805 sq. feet
|
2 baths 3 beds |
show details | |

|
#27
Hillcrest Dr
Arroyo Grande, CA 93420
|
1,097 sq. feet
|
2 baths 2 beds |
show details | |

|
#28
Nice Ave
Grover Beach, CA 93433
|
1,278 sq. feet
|
2 baths 3 beds |
show details | |

|
#29
Quarterhorse Way
Arroyo Grande, CA 93420
|
3,172 sq. feet
|
2 baths 3 beds |
show details | |

|
#30
12th St
Los Osos, CA 93402
|
1,170 sq. feet
|
2 baths 3 beds |
show details |
| Photo | Address | Area | Beds / Baths | Price | Details |
|---|---|---|---|---|---|

|
#31
Farroll Ave
Arroyo Grande, CA 93420
|
1,553 sq. feet
|
2 baths 3 beds |
show details | |

|
#32
9th St
Los Osos, CA 93402
|
1,120 sq. feet
|
2 baths 3 beds |
show details | |

|
#33
Viola Ct
Nipomo, CA 93444
|
1,782 sq. feet
|
2 baths 3 beds |
show details | |

|
#34
Corbett Canyon Rd
Arroyo Grande, CA 93420
|
2,362 sq. feet
|
2 baths 2 beds |
show details | |

|
#35
Juleston Dr
Santa Maria, CA 93458
|
- sq. feet
|
2 baths 3 beds |
show details | |

|
#36
Hanover Way
Santa Maria, CA 93458
|
- sq. feet
|
2 baths 3 beds |
show details | |

|
#37
W Creston St
Santa Maria, CA 93458
|
- sq. feet
|
2 baths 3 beds |
show details | |

|
#38
Juleston Dr
Santa Maria, CA 93458
|
- sq. feet
|
2 baths 4 beds |
show details | |

|
#39
Carlin Dr
Guadalupe, CA 93434
|
- sq. feet
|
2 baths 5 beds |
show details | |

|
#40
Arriba Way
Santa Maria, CA 93458
|
- sq. feet
|
2 baths 3 beds |
show details |
| Photo | Address | Area | Beds / Baths | Price | Details |
|---|---|---|---|---|---|

|
#41
Mary Dr
Santa Maria, CA 93458
|
- sq. feet
|
2 baths 3 beds |
show details | |

|
#42
Calimex
Nipomo, CA 93444
|
- sq. feet
|
- baths - beds |
show details | |

|
#43
N 2nd St
Grover Beach, CA 93433
|
- sq. feet
|
- baths - beds |
show details | |

|
#44
Brighton Ave Apt 35
Grover Beach, CA 93433
|
- sq. feet
|
- baths - beds |
show details | |

|
#45
S 14th St
Grover Beach, CA 93433
|
- sq. feet
|
- baths - beds |
show details | |

|
#46
E Grand Ave # 102
Arroyo Grande, CA 93420
|
- sq. feet
|
- baths - beds |
show details | |

|
#47
Noyes Rd
Arroyo Grande, CA 93420
|
- sq. feet
|
- baths - beds |
show details | |

|
#48
Purported From Said Tax Sheet:, 301 Highland Dr
Los Osos, CA 93402
|
- sq. feet
|
- baths - beds |
show details | |

|
#49
Ocean View Ave, Apt 2
Oceano, CA 93445
|
- sq. feet
|
- baths - beds |
show details | |

|
Check over 1 million property listings on Foreclosure.com!
|
browse all offers | |||


 | The nation’s hottest housing market? Surprise — it’s Fresno (76 replies) |
| 1 week roadtrip help (80 replies) |
| San Joaquin Valley Gentrification thread(Fresno, Merced, Stockton, Bakersfield) (338 replies) |
| Why does Fresno have a bad Reputation? (68 replies) |
| Summer Trip 2024-And Questions (17 replies) |
| Santa Barbara, Santa Maria or San Luis Obispo? (204 replies) |
Median year apartment built: 1976
Household type by relationship:
Households: 8,058- Male householders: 2,121 (624 living alone), Female householders: 1,996 (814 living alone)
1,814 spouses (1,805 opposite-sex spouses), 257 unmarried partners, (257 opposite-sex unmarried partners), 1,226 children (997 natural, 229 adopted, 0 stepchildren), 96 grandchildren, 29 brothers or sisters, 88 parents, 0 foster children, 80 other relatives, 335 non-relatives
- In group quarters: 14
Size of family households: 1,473 2-persons, 347 3-persons, 353 4-persons, 26 5-persons, 9 6-persons.
Size of nonfamily households: 1,479 1-person, 542 2-persons, 5 3-persons.
599 married couples with children.
211 single-parent households (97 men, 114 women).
89.5% of residents of Pismo Beach speak English at home.
3.2% of residents speak Spanish at home (70% speak English very well, 21% speak English well, 8% speak English not well).
2.7% of residents speak other Indo-European language at home (91% speak English very well, 9% speak English well).
4.3% of residents speak Asian or Pacific Island language at home (68% speak English very well, 10% speak English well, 22% speak English not well).
0.5% of residents speak other language at home (100% speak English very well).
Foreign born population: 633 (7.9%)
(64.0% of them are naturalized citizens)
| Here: | 5.8 |
| State: | 6.0 |
| Here: | 3.9 |
| State: | 3.9 |

- Bedrooms in owner-occupied houses and condos in Pismo Beach, California
- 0no bedroom
- 2181 bedroom
- 6022 bedrooms
- 1,5463 bedrooms
- 3734 bedrooms
- 85+ bedrooms

- Bedrooms in renter-occupied apartments in Pismo Beach, California
- 102no bedroom
- 2751 bedroom
- 8422 bedrooms
- 2753 bedrooms
- 84 bedrooms
- 05+ bedrooms

- Cars and other vehicles available in Pismo Beach in owner-occupied houses/condos
- 31no vehicle
- 9041 vehicle
- 1,0202 vehicles
- 3563 vehicles
- 3604 vehicles
- 785+ vehicles

- Cars and other vehicles available in Pismo Beach in renter-occupied apartments
- 57no vehicle
- 7851 vehicle
- 5262 vehicles
- 1253 vehicles
- 04 vehicles
- 95+ vehicles

- Rooms in owner-occupied houses in Pismo Beach, California
- 01 room
- 302 rooms
- 2743 rooms
- 4404 rooms
- 3055 rooms
- 7856 rooms
- 4717 rooms
- 1928 rooms
- 2509+ rooms

- Rooms in renter-occupied apartments in Pismo Beach, California
- 941 room
- 522 rooms
- 4063 rooms
- 3174 rooms
- 3145 rooms
- 1996 rooms
- 737 rooms
- 478 rooms
- 09+ rooms


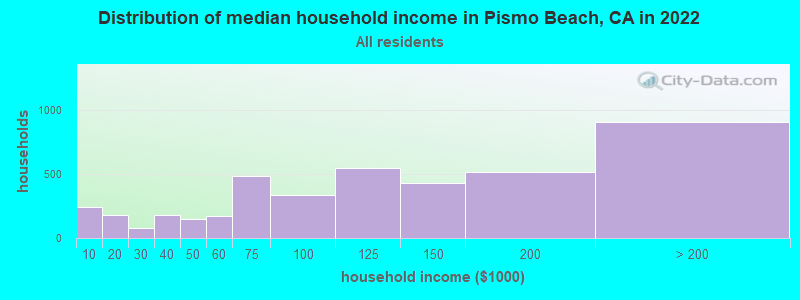
Pismo Beach, CA household income distribution

- 240Less than $10,000
- 180$10,000 to $19,999
- 81$20,000 to $29,999
- 182$30,000 to $39,999
- 150$40,000 to $49,999
- 175$50,000 to $59,999
- 482$60,000 to $74,999
- 332$75,000 to $99,999
- 548$100,000 to $124,999
- 427$125,000 to $149,999
- 514$150,000 to $199,999
- 905$200,000 or more
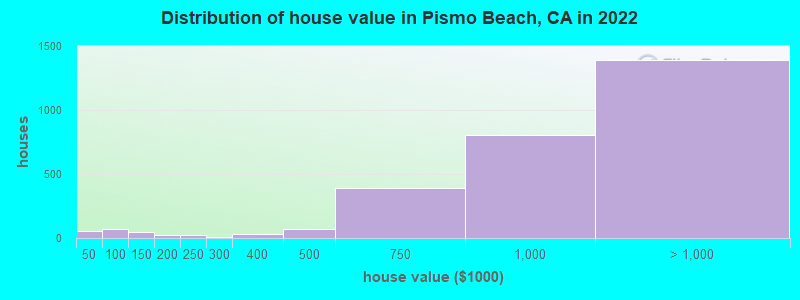
Home value of owner - occupied houses in 2022 in Pismo Beach, CA
-
- 7Less than $10,000
- 23$10,000 to $14,999
- 26$40,000 to $49,999
- 18$50,000 to $59,999
- 4$60,000 to $69,999
- 22$80,000 to $89,999
- 8$100,000 to $124,999
- 37$125,000 to $149,999
- 23$150,000 to $174,999
- 25$200,000 to $249,999
- 11$250,000 to $299,999
- 31$300,000 to $399,999
- 72$400,000 to $499,999
- 392$500,000 to $749,999
- 806$750,000 to $999,999
- 886$1,000,000 to $1,499,999
- 330$1,500,000 to $1,999,999
- 169$2,000,000 or more
Rent paid by renters in 2022 in Pismo Beach, CA
-
- 23$250 to $299
- 17$350 to $399
- 16$400 to $449
- 9$650 to $699
- 4$800 to $899
- 30$900 to $999
- 182$1,000 to $1,249
- 83$1,250 to $1,499
- 283$1,500 to $1,999
- 464$2,000 to $2,499
- 388$2,500 to $2,999
- 59$3,000 to $3,499
- 44$3,500 or more
- 34No cash rent


Percentage of workers working in this county: 80.1%
Number of people working at home: 781 (20.1% of all workers)
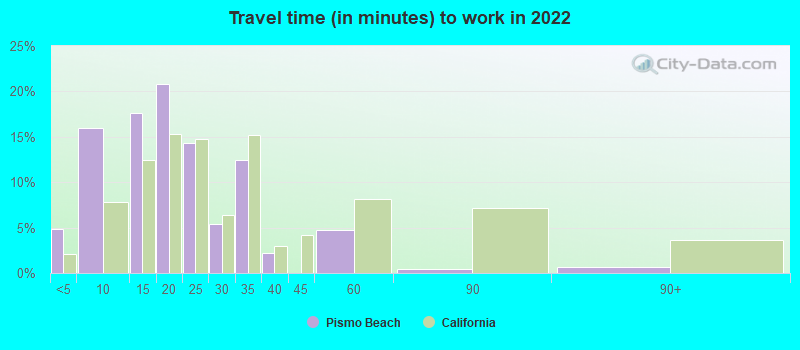
Travel time to work (commute)
- Less than 5 minutes: 151
- 5 to 9 minutes: 433
- 10 to 14 minutes: 480
- 15 to 19 minutes: 674
- 20 to 24 minutes: 540
- 25 to 29 minutes: 277
- 30 to 34 minutes: 300
- 35 to 39 minutes: 0
- 40 to 44 minutes: 0
- 45 to 59 minutes: 62
- 60 to 89 minutes: 62
- 90 or more minutes: 59
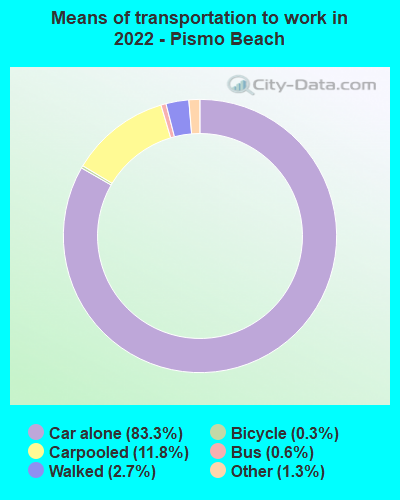
Means of transportation to work:
- Drove a car alone: 3,881 (72.2%)
- Carpooled: 516 (9.6%)
- Bus: 22 (0.4%)
- Taxi: 57 (1.1%)
- Bicycle: 14 (0.3%)
- Walked: 111 (2.1%)
- Worked at home: 781 (14.5%)

- Unemployment by race in 2022
- Unemployment rate for White non-Hispanic residents
- 0.9%Males
- 4.1%Females
- Unemployment rate for other race residents
- 58.7%Males
- Unemployment rate for two or more race residents
- 6.6%Females
- Unemployment rate for Hispanic or Latino residents
- 5.9%Males
- 14.2%Females

- Year of entry for the foreign-born population in Pismo Beach, California
- 2942010 or later
- 672000 to 2009
- 171990 to 1999
- 981980 to 1989
- 1211970 to 1979
- 314Before 1970
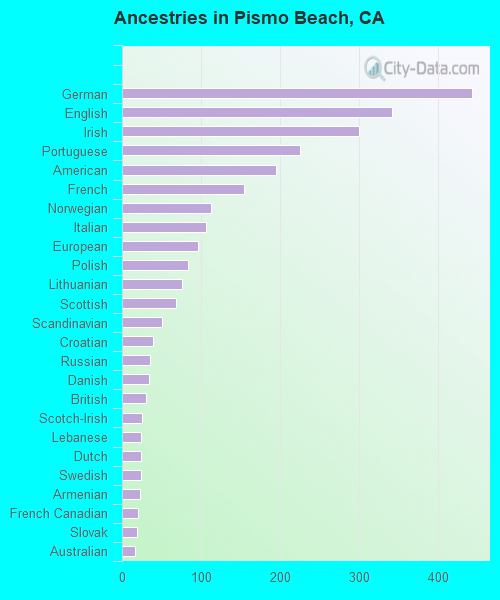
First ancestries reported:
- German: 442 (12.1%)
- English: 341 (9.4%)
- Irish: 300 (8.2%)
- Portuguese: 225 (6.2%)
- American: 195 (5.3%)
- French: 154 (4.2%)
- Norwegian: 113 (3.1%)
- Italian: 106 (2.9%)
- European: 96 (2.6%)
- Polish: 83 (2.3%)
- Lithuanian: 76 (2.1%)
- Scottish: 68 (1.9%)
- Scandinavian: 50 (1.4%)
- Croatian: 39 (1.1%)
- Russian: 35 (1.0%)
- Danish: 34 (0.9%)
- British: 30 (0.8%)
- Scotch-Irish: 25 (0.7%)
- Lebanese: 24 (0.7%)
- Dutch: 24 (0.7%)
- Swedish: 24 (0.7%)
- Armenian: 23 (0.6%)
- French Canadian: 20 (0.5%)
- Slovak: 19 (0.5%)
- Australian: 17 (0.5%)
- Ukrainian: 17 (0.5%)
- Czech: 10 (0.3%)
- Iranian: 8 (0.2%)
Most common places of birth for foreign-born residents (%):
| Pismo Beach: | 14.0% (85) |
| California: | 37.2% (3,881,193) |
| Pismo Beach: | 13.9% (84) |
| California: | 7.8% (818,297) |
| Pismo Beach: | 11.4% (69) |
| California: | 0.5% (51,974) |
| Pismo Beach: | 10.9% (66) |
| California: | 0.6% (60,761) |
| Pismo Beach: | 10.7% (65) |
| California: | 4.2% (440,287) |
| Pismo Beach: | 4.6% (28) |
| California: | 3.0% (315,248) |
| Pismo Beach: | 4.0% (24) |
| California: | 0.7% (73,304) |
| Pismo Beach: | 4.0% (24) |
| California: | 0.3% (31,757) |
| Pismo Beach: | 3.8% (23) |
| California: | 0.2% (23,338) |
| Pismo Beach: | 3.5% (21) |
| California: | 1.2% (127,477) |
| Pismo Beach: | 3.1% (19) |
| California: | 0.3% (31,439) |
| Pismo Beach: | 2.5% (15) |
| California: | 0.2% (20,997) |
| Pismo Beach: | 2.3% (14) |
| California: | 0.6% (57,953) |
| Pismo Beach: | 1.8% (11) |
| California: | 1.0% (103,575) |
| Pismo Beach: | 1.8% (11) |
| California: | 0.7% (74,025) |
Place of birth for U.S.-born residents:
- This state: 4,785
- Other state: 2,549
- Northeast: 480
- Midwest: 674
- South: 681
- West: 718
86.8% of Pismo Beach residents lived in the same house 1 years ago.
Out of people who lived in different houses, 28.1% lived in this county.
Out of people who lived in different counties, 85.4% lived in California.
| Pismo Beach: | 86.8% |
| State average: | 88.9% |
Education attainment for males 25 years and older:
- No schooling: 0
- Nursery to 4th grade: 0
- 5th and 6th grade: 19
- 7th and 8th grade: 0
- 9th grade: 0
- 10th grade: 7
- 11th grade: 0
- 12th grade, no diploma: 76
- High school graduate (or equivalency): 475
- Less than 1 year of college: 120
- Some college more than 1 year, no degree: 798
- Associate degree: 284
- Bachelor's degree: 965
- Master's degree: 405
- Professional school degree: 199
- Doctorate degree: 108

Education attainment for females 25 years and older:
- No schooling: 0
- Nursery to 4th grade: 0
- 5th and 6th grade: 0
- 7th and 8th grade: 18
- 9th grade: 0
- 10th grade: 53
- 11th grade: 5
- 12th grade, no diploma: 27
- High school graduate (or equivalency): 361
- Less than 1 year of college: 275
- Some college more than 1 year, no degree: 426
- Associate degree: 293
- Bachelor's degree: 1,257
- Master's degree: 482
- Professional school degree: 98
- Doctorate degree: 81

Housing units in structures:
- One, detached: 3,404
- One, attached: 618
- Two: 538
- 3 or 4: 305
- 5 to 9: 257
- 10 to 19: 184
- 20 to 49: 100
- 50 or more: 12
- Mobile homes: 656
- Boats, RVs, vans, etc.: 4
Median worth of mobile homes: $504,345
House/condo owner moved in on average 9 years ago
Renter moved in on average 1 years ago

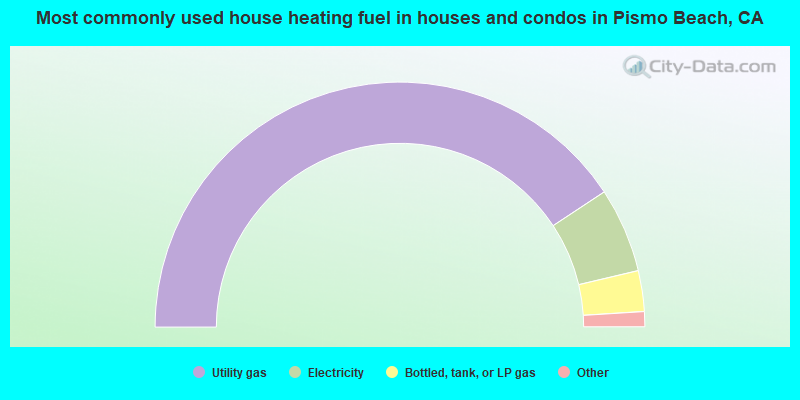
- 81.4%Utility gas
- 11.2%Electricity
- 5.4%Bottled, tank, or LP gas
- 1.7%No fuel used
- 0.3%Wood
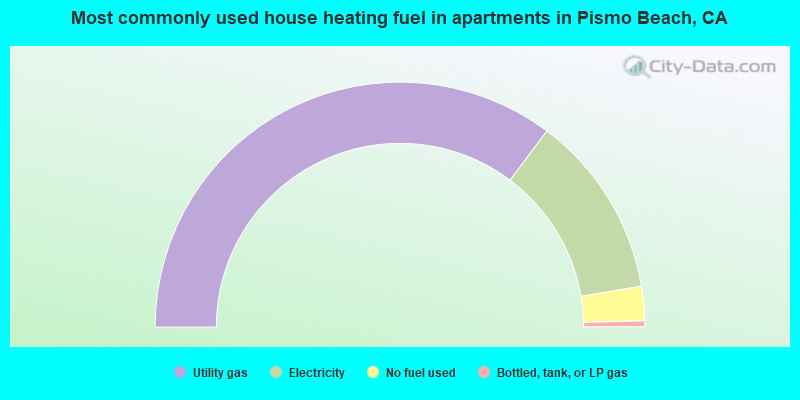
- 70.5%Utility gas
- 24.2%Electricity
- 4.5%No fuel used
- 0.8%Bottled, tank, or LP gas
Private vs. public school enrollment:
| Here: | 0.0% |
| California: | 10.5% |
| Here: | 6.5% |
| California: | 8.5% |
| Here: | 10.9% |
| California: | 15.9% |


