Plantation, FL (Florida) Houses and Residents
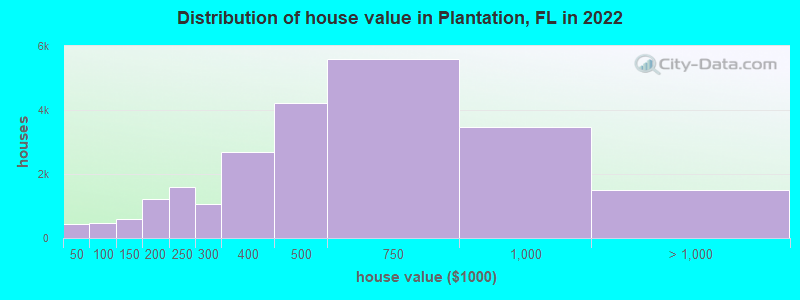
Estimated median house or condo value in 2022: $480,800 (it was $138,700 in 2000 )
Plantation:
$480,800Florida:
$354,100
Lower value quartile - upper value quartile: $316,100 - $717,500Mean price in 2022: Detached houses: $646,582 Here:
$646,582State:
$500,941
Townhouses or other attached units: $341,758 Here:
$341,758State:
$370,869
In 2-unit structures: $258,062 Here:
$258,062State:
$423,188
In 3-to-4-unit structures: $299,635 Here:
$299,635State:
$309,944
In 5-or-more-unit structures: $178,373 Here:
$178,373State:
$447,145
Mobile homes: $122,902 Here:
$122,902State:
$113,202
Total population: 91,457 (Urban population: 83,274, Rural population: 0)
Houses: 38,426 (36,054 occupied: 22,672 owner occupied, 13,382 renter occupied )
% of renters here:
37%State:
33%
Housing density: 1,768 houses/condos per square mile
Median price asked for vacant for-sale houses and condos in 2022: $400,399.
Median contract rent in 2022: $1,830 (lower quartile is $1,512, upper quartile is over $2,000)
Median rent asked for vacant for-rent units in 2022: $2,149
Median gross rent in Plantation, FL in 2022: $1,959
Housing units in Plantation with a mortgage: 13,659 (1,063 second mortgage, 0 home equity loan, 865 both second mortgage and home equity loan )Houses without a mortgage: 424
Median household income for houses/condos with a mortgage: $128,385
Median household income for apartments without a mortgage: $72,448
Median monthly housing costs: $1,844
Data:
Median house or condo value ($)
Median house or condo value ($ change since 2000)
Median house or condo value ($) - White
Median house or condo value ($) - Black or African American
Median house or condo value ($) - Asian
Median house or condo value ($) - Hispanic or Latino
Median house or condo value ($) - American Indian and Alaska Native
Median house or condo value ($) - Multirace
Median house or condo value ($) - Other Race
Median price asked for mobile homes ($)
Household density (households per square mile)
Mean house or condo value by units in structure - 1, detached ($)
Mean house or condo value by units in structure - 1, attached ($)
Mean house or condo value by units in structure - 2 ($)
Mean house or condo value by units in structure by units in structure - 3 or 4 ($)
Mean house or condo value by units in structure - 5 or more ($)
Mean house or condo value by units in structure - Boat, RV, van, etc. ($)
Mean house or condo value by units in structure - Mobile home ($)
Median contract rent ($)
Median contract rent - Lower quartile ($)
Median contract rent - Upper quartile ($)
Median gross rent ($)
Urban houses (%)
Rural houses (%)
Houses occupied (%)
Houses occupied (% change since 2000)
Houses owner occupied (%)
Houses owner occupied (% change since 2000)
Houses renter occupied (%)
Houses renter occupied (% change since 2000)
Vacant housing units - For rent (%)
Vacant housing units - For rent (% change since 2000)
Vacant housing units - For sale only (%)
Vacant housing units - For sale only (% change since 2000)
Vacant housing units - Rented or sold, not occupied (%)
Vacant housing units - Rented or sold, not occupied (% change since 2000)
Vacant housing units - For seasonal, recreational, or occasional use (%)
Vacant housing units - For seasonal, recreational, or occasional use (% change since 2000)
Vacant housing units - For migrant workers (%)
Vacant housing units - For migrant workers (% change since 2000)
Vacant housing units - Other vacant (%)
Vacant housing units - Other vacant (% change since 2000)
Median monthly housing costs ($)
Median household income for houses/condos with a mortgage ($)
Median household income for houses/condos without a mortgage ($)
Median household income ($)
Median household income ($) - White
Median household income ($) - Black or African American
Median household income ($) - Asian
Median household income ($) - Hispanic or Latino
Median household income ($) - American Indian and Alaska Native
Median household income ($) - Multirace
Median household income ($) - Other Race
Mortgage status - with mortgage (%)
Mortgage status - with second mortgage (%)
Mortgage status - with home equity loan (%)
Mortgage status - with both second mortgage and home equity loan (%)
Mortgage status - without a mortgage (%)
Median year house/condo built
Median year apartment built
Household type by relationship - Male householder living alone (%)
Household type by relationship - Male householder not living alone (%)
Household type by relationship - Female householder living alone (%)
Household type by relationship - Female householder not living alone (%)
Household type by relationship - Opposite-Sex spouse (%)
Household type by relationship - Same-Sex spouse (%)
Household type by relationship - Opposite-Sex unmarried partner (%)
Household type by relationship - Same-Sex unmarried partner (%)
Household type by relationship - In group quarters (%)
Size of family households - 2-person household (%)
Size of family households - 3-person household (%)
Size of family households - 4-person household (%)
Size of family households - 5-person household (%)
Size of family households - 6-person household (%)
Size of family households - 7-or-more-person household (%)
Size of nonfamily households - 1-person household (%)
Size of nonfamily households - 2-person household (%)
Size of nonfamily households - 3-person household (%)
Size of nonfamily households - 4-person household (%)
Size of nonfamily households - 5-person household (%)
Size of nonfamily households - 6-person household (%)
Size of nonfamily households - 7-or-moreperson household (%)
Year house built - Built 2010 or later (%)
Year house built - Built 2000 to 2009 (%)
Year house built - Built 1990 to 1999 (%)
Year house built - Built 1980 to 1989 (%)
Year house built - Built 1970 to 1979 (%)
Year house built - Built 1960 to 1969 (%)
Year house built - Built 1950 to 1959 (%)
Year house built - Built 1940 to 1949 (%)
Year house built - Built 1939 or earlier (%)
Median number of rooms in houses and condos
Median number of rooms in apartments
Median number of bedrooms in owner occupied houses
Mean number of bedrooms in owner occupied houses
Median number of bedrooms in renter occupied houses
Mean number of bedrooms in renter occupied houses
Median number of vehichles in owner occupied houses
Mean number of vehichles in owner occupied houses
Median number of vehichles in renter occupied houses
Mean number of vehichles in renter occupied houses
Rooms in owner-occupied houses - 1 room (%)
Rooms in owner-occupied houses - 2 rooms (%)
Rooms in owner-occupied houses - 3 rooms (%)
Rooms in owner-occupied houses - 4 rooms (%)
Rooms in owner-occupied houses - 5 rooms (%)
Rooms in owner-occupied houses - 6 rooms (%)
Rooms in owner-occupied houses - 7 rooms (%)
Rooms in owner-occupied houses - 8 rooms (%)
Rooms in owner-occupied houses - 9+ rooms (%)
Rooms in renter-occupied houses - 1 room (%)
Rooms in renter-occupied houses - 2 rooms (%)
Rooms in renter-occupied houses - 3 rooms (%)
Rooms in renter-occupied houses - 4 rooms (%)
Rooms in renter-occupied houses - 5 rooms (%)
Rooms in renter-occupied houses - 6 rooms (%)
Rooms in renter-occupied houses - 7 rooms (%)
Rooms in renter-occupied houses - 8 rooms (%)
Rooms in renter-occupied houses - 9+ rooms (%)
Bedrooms in owner-occupied houses - no bedrooms (%)
Bedrooms in owner-occupied houses - 1 bedroom (%)
Bedrooms in owner-occupied houses - 2 bedrooms (%)
Bedrooms in owner-occupied houses - 3 bedrooms (%)
Bedrooms in owner-occupied houses - 4 bedrooms (%)
Bedrooms in owner-occupied houses - 5+ bedrooms (%)
Bedrooms in renter-occupied houses - no bedrooms (%)
Bedrooms in renter-occupied houses - 1 bedroom (%)
Bedrooms in renter-occupied houses - 2 bedrooms (%)
Bedrooms in renter-occupied houses - 3 bedrooms (%)
Bedrooms in renter-occupied houses - 4 bedrooms (%)
Bedrooms in renter-occupied houses - 5+ bedrooms (%)
Vehicles available in owner-occupied houses - no vehicle available (%)
Vehicles available in owner-occupied houses - 1 vehicle available(%)
Vehicles available in owner-occupied houses - 2 Vehicles available (%)
Vehicles available in owner-occupied houses - 3 Vehicles available (%)
Vehicles available in owner-occupied houses - 4 Vehicles available (%)
Vehicles available in owner-occupied houses - 5+ Vehicles available (%)
Vehicles available in renter-occupied houses - no vehicle available (%)
Vehicles available in renter-occupied houses - 1 vehicle available (%)
Vehicles available in renter-occupied houses - 2 Vehicles available (%)
Vehicles available in renter-occupied houses - 3 Vehicles available (%)
Vehicles available in renter-occupied houses - 4 Vehicles available (%)
Vehicles available in renter-occupied houses - 5+ Vehicles available (%)
Housing units in structures - 1, detached (%)
Housing units in structures - 1, attached (%)
Housing units in structures - 2 (%)
Housing units in structures - 3 or 4 (%)
Housing units in structures - 5 to 9 (%)
Housing units in structures - 10 to 19 (%)
Housing units in structures - 20 to 49 (%)
Housing units in structures - 50 or more (%)
Housing units in structures - Mobile home (%)
Housing units in structures - Boat, RV, van, etc. (%)
Housing units in structures - Owners - 1, detached (%)
Housing units in structures - Owners - 1, attached (%)
Housing units in structures - Owners - 2 (%)
Housing units in structures - Owners - 3 or 4 (%)
Housing units in structures - Owners - 5 to 9 (%)
Housing units in structures - Owners - 10 to 19 (%)
Housing units in structures - Owners - 20 to 49 (%)
Housing units in structures - Owners - 50 or more (%)
Housing units in structures - Owners - Mobile home (%)
Housing units in structures - Owners - Boat, RV, van, etc. (%)
Housing units in structures - Renters - 1, detached (%)
Housing units in structures - Renters - 1, attached (%)
Housing units in structures - Renters - 2 (%)
Housing units in structures - Renters - 3 or 4 (%)
Housing units in structures - Renters - 5 to 9 (%)
Housing units in structures - Renters - 10 to 19 (%)
Housing units in structures - Renters - 20 to 49 (%)
Housing units in structures - Renters - 50 or more (%)
Housing units in structures - Renters - Mobile home (%)
Housing units in structures - Renters - Boat, RV, van, etc. (%)
House/condo owner moved in on average (years ago)
Renter moved in on average (years ago)
Year householder moved into unit - Moved in 1999 to March 2000 (%)
Year householder moved into unit - Moved in 1999 to March 2000 (%) - White
Year householder moved into unit - Moved in 1999 to March 2000 (%) - Black or African American
Year householder moved into unit - Moved in 1999 to March 2000 (%) - Asian
Year householder moved into unit - Moved in 1999 to March 2000 (%) - Hispanic or Latino
Year householder moved into unit - Moved in 1999 to March 2000 (%) - American Indian and Alaska Native
Year householder moved into unit - Moved in 1999 to March 2000 (%) - Multirace
Year householder moved into unit - Moved in 1999 to March 2000 (%) - Other Race
Year householder moved into unit - Moved in 1995 to 1998 (%)
Year householder moved into unit - Moved in 1995 to 1998 (%) - White
Year householder moved into unit - Moved in 1995 to 1998 (%) - Black or African American
Year householder moved into unit - Moved in 1995 to 1998 (%) - Asian
Year householder moved into unit - Moved in 1995 to 1998 (%) - Hispanic or Latino
Year householder moved into unit - Moved in 1995 to 1998 (%) - American Indian and Alaska Native
Year householder moved into unit - Moved in 1995 to 1998 (%) - Multirace
Year householder moved into unit - Moved in 1995 to 1998 (%) - Other Race
Year householder moved into unit - Moved in 1990 to 1994 (%)
Year householder moved into unit - Moved in 1990 to 1994 (%) - White
Year householder moved into unit - Moved in 1990 to 1994 (%) - Black or African American
Year householder moved into unit - Moved in 1990 to 1994 (%) - Asian
Year householder moved into unit - Moved in 1990 to 1994 (%) - Hispanic or Latino
Year householder moved into unit - Moved in 1990 to 1994 (%) - American Indian and Alaska Native
Year householder moved into unit - Moved in 1990 to 1994 (%) - Multirace
Year householder moved into unit - Moved in 1990 to 1994 (%) - Other Race
Year householder moved into unit - Moved in 1980 to 1989 (%)
Year householder moved into unit - Moved in 1980 to 1989 (%) - White
Year householder moved into unit - Moved in 1980 to 1989 (%) - Black or African American
Year householder moved into unit - Moved in 1980 to 1989 (%) - Asian
Year householder moved into unit - Moved in 1980 to 1989 (%) - Hispanic or Latino
Year householder moved into unit - Moved in 1980 to 1989 (%) - American Indian and Alaska Native
Year householder moved into unit - Moved in 1980 to 1989 (%) - Multirace
Year householder moved into unit - Moved in 1980 to 1989 (%) - Other Race
Year householder moved into unit - Moved in 1970 to 1979 (%)
Year householder moved into unit - Moved in 1970 to 1979 (%) - White
Year householder moved into unit - Moved in 1970 to 1979 (%) - Black or African American
Year householder moved into unit - Moved in 1970 to 1979 (%) - Asian
Year householder moved into unit - Moved in 1970 to 1979 (%) - Hispanic or Latino
Year householder moved into unit - Moved in 1970 to 1979 (%) - American Indian and Alaska Native
Year householder moved into unit - Moved in 1970 to 1979 (%) - Multirace
Year householder moved into unit - Moved in 1970 to 1979 (%) - Other Race
Year householder moved into unit - Moved in 1969 or earlier (%)
Year householder moved into unit - Moved in 1969 or earlier (%) - White
Year householder moved into unit - Moved in 1969 or earlier (%) - Black or African American
Year householder moved into unit - Moved in 1969 or earlier (%) - Asian
Year householder moved into unit - Moved in 1969 or earlier (%) - Hispanic or Latino
Year householder moved into unit - Moved in 1969 or earlier (%) - American Indian and Alaska Native
Year householder moved into unit - Moved in 1969 or earlier (%) - Multirace
Year householder moved into unit - Moved in 1969 or earlier (%) - Other Race
Housing units lacking complete plumbing facilities (%)
Housing units lacking complete kitchen facilities (%)
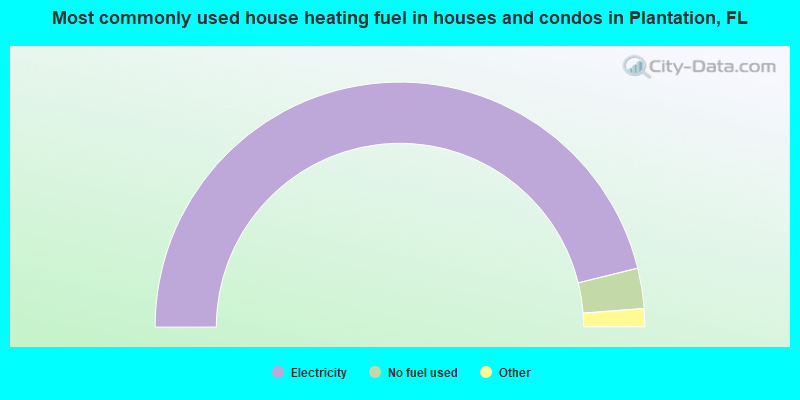
House heating fuel used in houses and condos - Utility gas (%)
House heating fuel used in houses and condos - Bottled, tank, or LP gas (%)
House heating fuel used in houses and condos - Electricity (%)
House heating fuel used in houses and condos - Fuel oil, kerosene, etc. (%)
House heating fuel used in houses and condos - Coal or coke (%)
House heating fuel used in houses and condos - Wood (%)
House heating fuel used in houses and condos - Solar energy (%)
House heating fuel used in houses and condos - Other fuel (%)
House heating fuel used in houses and condos - No fuel used (%)
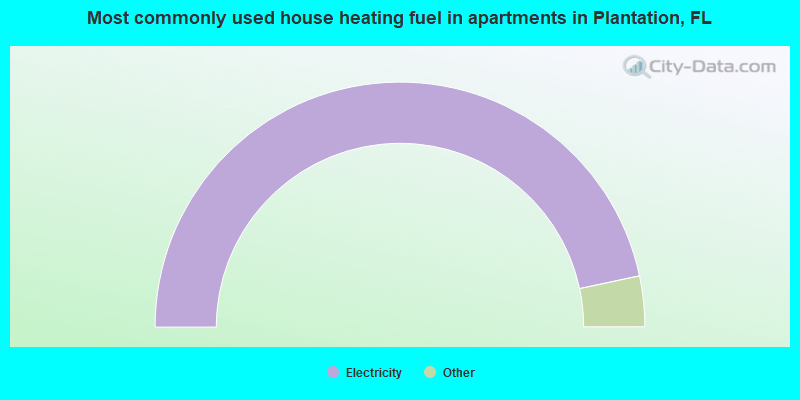
House heating fuel used in apartments - Utility gas (%)
House heating fuel used in apartments - Bottled, tank, or LP gas (%)
House heating fuel used in apartments - Electricity (%)
House heating fuel used in apartments - Fuel oil, kerosene, etc. (%)
House heating fuel used in apartments - Coal or coke (%)
House heating fuel used in apartments - Wood (%)
House heating fuel used in apartments - Solar energy (%)
House heating fuel used in apartments - Other fuel (%)
House heating fuel used in apartments - No fuel used (%)
Latest news about housing in Plantation, FL collected exclusively by city-data.com from local newspapers, TV, and radio stations
Median year house/condo built: 1982Median year apartment built: 1988Household type by relationship:
Households: 96,046
Male householders: 16,547 (3,650 living alone ), Female householders: 19,507 (6,216 living alone )18,361 spouses (18,167 opposite-sex spouses ), 3,655 unmarried partners , (3,655 opposite-sex unmarried partners ), 28,425 children (26,392 natural , 548 adopted , 1,485 stepchildren ), 1,351 grandchildren , 654 brothers or sisters , 1,822 parents , 0 foster children , 2,101 other relatives , 3,075 non-relatives In group quarters: 548
Size of family households: 8,323 2-persons , 6,961 3-persons , 4,700 4-persons , 2,551 5-persons , 796 6-persons , 293 7-or-more-persons .
Size of nonfamily households: 9,866 1-person , 2,117 2-persons , 88 3-persons , 359 4-persons .
14,114 married couples with children. single-parent households (2,163 men , 1,931 women ).
62.5% of residents of Plantation speak English at home. of residents speak Spanish at home (67% speak English very well , 21% speak English well , 9% speak English not well , 3% don't speak English at all ).of residents speak other Indo-European language at home (70% speak English very well , 19% speak English well , 6% speak English not well , 4% don't speak English at all ).of residents speak Asian or Pacific Island language at home (53% speak English very well , 33% speak English well , 12% speak English not well , 2% don't speak English at all ).of residents speak other language at home (74% speak English very well , 17% speak English well , 8% speak English not well ).
Foreign born population: 29,371 (30.6%)of them are naturalized citizens )
Median number of rooms in houses and condos:
Median number of rooms in apartments
Owner-occupied Renter-occupied
Bedrooms in owner-occupied houses and condos in Plantation, Florida
151 no bedroom 1,179 1 bedroom 5,069 2 bedrooms 7,381 3 bedrooms 6,648 4 bedrooms 2,244 5+ bedrooms
Bedrooms in renter-occupied apartments in Plantation, Florida
261 no bedroom 4,358 1 bedroom 5,901 2 bedrooms 2,531 3 bedrooms 331 4 bedrooms 0 5+ bedrooms
Owner-occupied Renter-occupied
Rooms in owner-occupied houses in Plantation, Florida
151 1 room 364 2 rooms 878 3 rooms 4,230 4 rooms 3,824 5 rooms 4,022 6 rooms 3,206 7 rooms 3,212 8 rooms 2,785 9+ rooms
Rooms in renter-occupied apartments in Plantation, Florida
261 1 room 1,945 2 rooms 2,539 3 rooms 4,336 4 rooms 2,054 5 rooms 1,464 6 rooms 783 7 rooms 0 8 rooms 0 9+ rooms
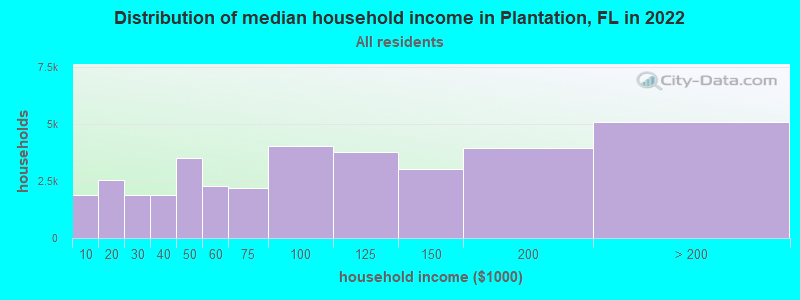
Plantation, FL household income distribution 1,893 Less than $10,0002,541 $10,000 to $19,9991,881 $20,000 to $29,9991,884 $30,000 to $39,9993,502 $40,000 to $49,9992,263 $50,000 to $59,9992,176 $60,000 to $74,9994,049 $75,000 to $99,9993,767 $100,000 to $124,9993,047 $125,000 to $149,9993,961 $150,000 to $199,9995,090 $200,000 or more
Home value of owner - occupied houses in 2022 in Plantation, FL 277 Less than $10,00036 $25,000 to $29,999122 $40,000 to $49,99958 $50,000 to $59,99929 $60,000 to $69,99981 $70,000 to $79,999192 $80,000 to $89,999498 $100,000 to $124,99991 $125,000 to $149,999630 $150,000 to $174,999579 $175,000 to $199,9991,592 $200,000 to $249,9991,051 $250,000 to $299,9992,691 $300,000 to $399,9994,218 $400,000 to $499,9995,585 $500,000 to $749,9993,457 $750,000 to $999,999712 $1,000,000 to $1,499,999251 $1,500,000 to $1,999,999522 $2,000,000 or moreRent paid by renters in 2022 in Plantation, FL 11 $100 to $14923 $150 to $19949 $250 to $2993 $550 to $59979 $650 to $69914 $700 to $74912 $750 to $79937 $800 to $89997 $900 to $999456 $1,000 to $1,2491,379 $1,250 to $1,4995,695 $1,500 to $1,9994,072 $2,000 to $2,499837 $2,500 to $2,999385 $3,000 to $3,499233 $3,500 or more602 No cash rent
Percentage of workers working in this county: 81.5%Number of people working at home: 9,791 (19.9% of all workers )
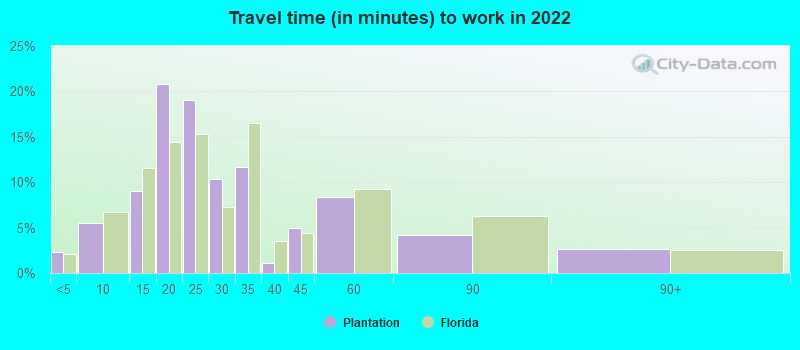
Travel time to work (commute)
Less than 5 minutes: 5845 to 9 minutes: 1,88610 to 14 minutes: 4,73515 to 19 minutes: 5,65420 to 24 minutes: 7,20425 to 29 minutes: 2,63630 to 34 minutes: 6,58235 to 39 minutes: 98740 to 44 minutes: 1,80545 to 59 minutes: 3,87660 to 89 minutes: 3,97690 or more minutes: 515
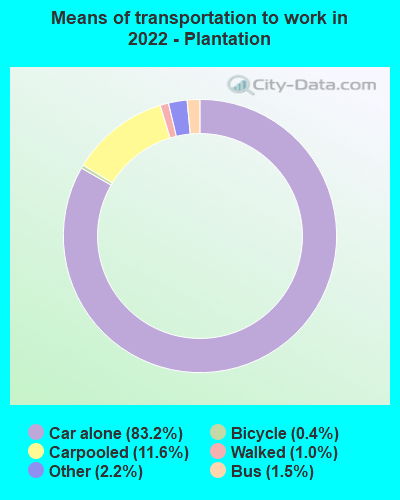
Means of transportation to work:
Drove a car alone: 28,227 (64.7%)Carpooled: 4,493 (10.3%)Bus : 569 (1.3%)Taxi: 780 (1.8%)Bicycle: 176 (0.4%)Walked: 393 (0.9%)Worked at home: 9,791 (22.5%)
Unemployment by race in 2022
Unemployment rate for White non-Hispanic residents 3.6% Males5.2% FemalesUnemployment rate for Black residents 5.8% Males12.9% FemalesUnemployment rate for Asian residents 4.0% Males0.8% FemalesUnemployment rate for other race residents 0.9% Males5.6% FemalesUnemployment rate for two or more race residents 5.1% Males1.8% FemalesUnemployment rate for Hispanic or Latino residents 5.3% Males3.9% Females
Year of entry for the foreign-born population in Plantation, Florida
11,489 2010 or later 4,986 2000 to 2009 5,350 1990 to 1999 4,875 1980 to 1989 2,962 1970 to 1979 3,810 Before 1970
First ancestries reported:
Haitian: 4,596 (8.2%)
American: 4,172 (7.5%)
Jamaican: 4,126 (7.4%)
Italian: 2,266 (4.1%)
English: 1,694 (3.0%)
Irish: 1,578 (2.8%)
German: 1,495 (2.7%)
European: 940 (1.7%)
Polish: 654 (1.2%)
Israeli: 550 (1.0%)
Russian: 401 (0.7%)
Eastern European: 387 (0.7%)
Trinidadian and Tobagonian: 353 (0.6%)
British: 293 (0.5%)
Brazilian: 288 (0.5%)
French: 268 (0.5%)
Slavic: 253 (0.5%)
African: 252 (0.5%)
Palestinian: 228 (0.4%)
Bahamian: 227 (0.4%)
French Canadian: 223 (0.4%)
Dutch: 209 (0.4%)
Scottish: 205 (0.4%)
West Indian: 203 (0.4%)
Guyanese: 196 (0.4%)
Ghanaian: 179 (0.3%)
Hungarian: 161 (0.3%)
Moroccan: 155 (0.3%)
Iranian: 147 (0.3%)
Lebanese: 146 (0.3%)
Greek: 111 (0.2%)
Canadian: 107 (0.2%)
South African: 106 (0.2%)
British West Indian: 106 (0.2%)
Portuguese: 101 (0.2%)
Ukrainian: 100 (0.2%)
Scotch-Irish: 86 (0.2%)
Scandinavian: 73 (0.1%)
Austrian: 72 (0.1%)
Slovak: 63 (0.1%)
Romanian: 62 (0.1%)
Turkish: 56 (0.1%)
Sudanese: 49 (0.09%)
Lithuanian: 46 (0.08%)
Syrian: 45 (0.08%)
Swedish: 44 (0.08%)
Czech: 43 (0.08%)
Welsh: 42 (0.08%)
Barbadian: 35 (0.06%)
Egyptian: 32 (0.06%)
Croatian: 32 (0.06%)
Serbian: 29 (0.05%)
Macedonian: 29 (0.05%)
Finnish: 27 (0.05%)
Norwegian: 27 (0.05%)
Yugoslavian: 26 (0.05%)
Danish: 24 (0.04%)
Celtic: 24 (0.04%)
Northern European: 22 (0.04%)
Ethiopian: 20 (0.04%)
Latvian: 17 (0.03%)
Luxembourger: 16 (0.03%)
Armenian: 12 (0.02%)
Australian: 12 (0.02%)
U.S. Virgin Islander: 12 (0.02%)
Kenyan: 11 (0.02%)
Estonian: 11 (0.02%)
Albanian: 9 (0.02%)
Czechoslovakian: 9 (0.02%)
Belgian: 5 (0.01%)
Arab: 4 (0.01%)
Nigerian: 3 (0.01%)
Most common places of birth for foreign-born residents (%): Jamaica Plantation:
14.0% (4,215)Florida:
5.0% (227,319)
Haiti Plantation:
10.3% (3,085)Florida:
7.5% (342,375)
Colombia Plantation:
10.2% (3,072)Florida:
6.5% (298,669)
Venezuela Plantation:
9.7% (2,925)Florida:
5.7% (262,042)
Cuba Plantation:
6.0% (1,791)Florida:
22.0% (1,006,576)
India Plantation:
3.2% (961)Florida:
2.1% (94,349)
Peru Plantation:
3.2% (947)Florida:
2.1% (96,693)
Dominican Republic Plantation:
2.6% (787)Florida:
3.0% (137,727)
Nicaragua Plantation:
2.6% (785)Florida:
2.3% (105,066)
Israel Plantation:
2.2% (666)Florida:
0.3% (14,535)
Mexico Plantation:
1.9% (568)Florida:
5.6% (257,152)
Brazil Plantation:
1.7% (520)Florida:
2.7% (122,906)
Canada Plantation:
1.7% (504)Florida:
2.4% (109,132)
Guatemala Plantation:
1.6% (469)Florida:
2.1% (97,632)
Trinidad and Tobago Plantation:
1.5% (456)Florida:
1.0% (43,642)
Place of birth for U.S.-born residents:
This state: 36,092Other state: 24,764Northeast: 13,507Midwest: 4,868South: 4,765West: 1,624 84.8% of Plantation residents lived in the same house 1 years ago.
Out of people who lived in different houses, 39.9% lived in this county.
Out of people who lived in different counties, 48.2% lived in Florida.
Plantation:
84.8%State average:
86.3%
Education attainment for males 25 years and older:
No schooling: 419Nursery to 4th grade: 505th and 6th grade: 447th and 8th grade: 449th grade: 010th grade: 6311th grade: 13012th grade, no diploma: 521High school graduate (or equivalency): 8,355Less than 1 year of college: 2,603Some college more than 1 year, no degree: 4,031Associate degree: 3,263Bachelor's degree: 7,771Master's degree: 3,245Professional school degree: 1,898Doctorate degree: 676
Education attainment for females 25 years and older:
No schooling: 506Nursery to 4th grade: 405th and 6th grade: 417th and 8th grade: 449th grade: 18910th grade: 011th grade: 6812th grade, no diploma: 415High school graduate (or equivalency): 8,076Less than 1 year of college: 2,262Some college more than 1 year, no degree: 4,894Associate degree: 3,790Bachelor's degree: 10,031Master's degree: 4,899Professional school degree: 691Doctorate degree: 684
Housing units in structures:
One, detached: 18,123One, attached: 2,450Two: 6633 or 4: 1,7915 to 9: 2,95710 to 19: 3,20620 to 49: 2,29250 or more: 6,722Mobile homes: 196Boats, RVs, vans, etc.: 26Median worth of mobile homes: $74,652
Housing units lacking complete plumbing facilities in 2022: 0.6%Housing units lacking complete kitchen facilities in 2022: 1.0%House/condo owner moved in on average 12 years ago
Renter moved in on average 1 years ago
Private vs. public school enrollment:
Students in private schools in grades 1 to 8 (elementary and middle school): 2,114 Students in private schools in grades 9 to 12 (high school): 1,212 Students in private undergraduate colleges: 1,434