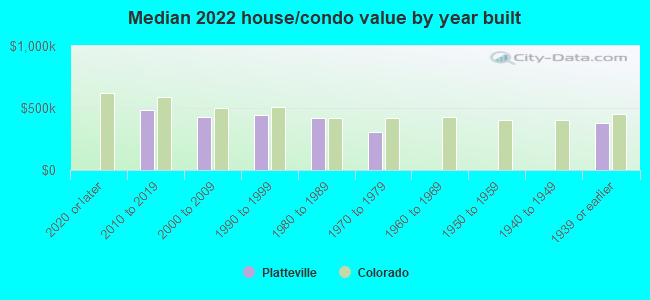
Platteville, CO (Colorado) Houses and Residents
| Platteville: | $376,321 |
| Colorado: | $531,100 |
Mean price in 2022:
Detached houses: $448,712
Here: $448,712 State: $676,667 Townhouses or other attached units: $396,193
Here: $396,193 State: $526,340 Mobile homes: $67,951
Here: $67,951 State: $115,510
Total population: 2,608 (Urban population: 0, Rural population: 2,342 (11 farm, 2,331 nonfarm))
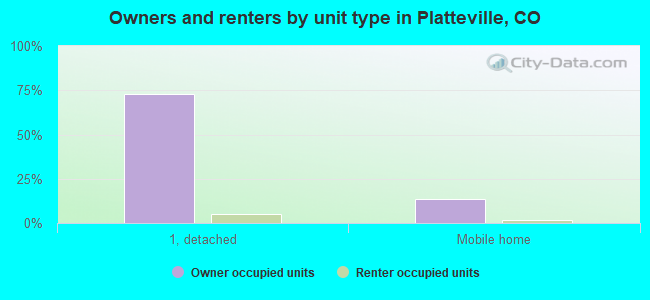
Houses: 1,104 (1,046 occupied: 898 owner occupied, 147 renter occupied)
| % of renters here: | 14% |
| State: | 34% |
Housing density: 748 houses/condos per square mile
Median price asked for vacant for-sale houses and condos in 2022 in this county: $385,671.
Median contract rent in 2022: $1,130
Median rent asked for vacant for-rent units in 2022: $1,433
Median gross rent in Platteville, CO in 2022: $1,397
Housing units in Platteville with a mortgage: 582 (73 second mortgage, 0 home equity loan, 36 both second mortgage and home equity loan)
Houses without a mortgage: 0
Median household income for houses/condos with a mortgage: $92,098
Median household income for apartments without a mortgage: $63,016
Median monthly housing costs: $1,419
Compare current foreclosures near Platteville, CO:
| Photo | Address | Area | Beds / Baths | Price | Details |
|---|---|---|---|---|---|

|
#1
Front St
Platteville, CO 80651
|
1,160 sq. feet
|
1 baths 2 beds |
show details | |

|
#2
Plowshare Ln
Platteville, CO 80651
|
1,744 sq. feet
|
3 baths 4 beds |
show details | |

|
#3
Sanchez Ct
Platteville, CO 80651
|
1,552 sq. feet
|
1 baths 2 beds |
show details | |

|
#4
Melody Ln
Platteville, CO 80651
|
- sq. feet
|
- baths - beds |
show details | |

|
#5
County Road 4
Brighton, CO 80603
|
5,516 sq. feet
|
5 baths 5 beds |
$806,000
|
show details |

|
#6
S Harding Ave
Johnstown, CO 80534
|
1,040 sq. feet
|
1 baths 3 beds |
$405,000
|
show details |

|
#7
Apache Plume St
Brighton, CO 80601
|
2,058 sq. feet
|
2 baths 4 beds |
show details | |

|
#8
Mckinley Ave
Fort Lupton, CO 80621
|
672 sq. feet
|
1 baths 2 beds |
show details | |

|
#9
3rd St
Berthoud, CO 80513
|
1,864 sq. feet
|
2 baths 3 beds |
show details | |

|
#10
Windmill Dr
Brighton, CO 80601
|
1,506 sq. feet
|
2 baths 3 beds |
show details |
| Photo | Address | Area | Beds / Baths | Price | Details |
|---|---|---|---|---|---|

|
#11
12th Ave
Greeley, CO 80631
|
1,129 sq. feet
|
2 baths 4 beds |
show details | |

|
#12
Arbor Ave
Greeley, CO 80631
|
1,428 sq. feet
|
2 baths 2 beds |
show details | |

|
#13
W 31st St
Greeley, CO 80634
|
1,310 sq. feet
|
2 baths 3 beds |
show details | |

|
#14
Keep Cir
Berthoud, CO 80513
|
1,464 sq. feet
|
2 baths 3 beds |
show details | |

|
#15
Ute Way
Brighton, CO 80603
|
1,747 sq. feet
|
2 baths 3 beds |
show details | |

|
#16
24th St
Greeley, CO 80631
|
- sq. feet
|
1 baths 2 beds |
show details | |

|
#17
Straw Ct
Brighton, CO 80601
|
1,325 sq. feet
|
2 baths 3 beds |
show details | |

|
#18
18th St
Greeley, CO 80634
|
1,008 sq. feet
|
3 baths 4 beds |
show details | |

|
#19
Ash Ct
Fort Lupton, CO 80621
|
996 sq. feet
|
1 baths 3 beds |
show details | |

|
#20
Mather St
Brighton, CO 80601
|
910 sq. feet
|
1 baths 2 beds |
show details |
| Photo | Address | Area | Beds / Baths | Price | Details |
|---|---|---|---|---|---|

|
#21
Anchorage Ct
Longmont, CO 80504
|
2,432 sq. feet
|
1 baths 4 beds |
show details | |

|
#22
26th Avenue Ct
Greeley, CO 80634
|
2,010 sq. feet
|
3 baths 4 beds |
show details | |

|
#23
San Mateo Ave
Evans, CO 80620
|
1,754 sq. feet
|
3 baths 3 beds |
show details | |

|
#24
Tipple Pkwy
Frederick, CO 80530
|
1,100 sq. feet
|
1 baths 2 beds |
show details | |

|
#25
W 6th Street Rd
Greeley, CO 80634
|
1,170 sq. feet
|
3 baths 4 beds |
show details | |

|
#26
Ute Ln
Greeley, CO 80634
|
2,340 sq. feet
|
3 baths 3 beds |
show details | |

|
#27
12th St
Greeley, CO 80631
|
2,683 sq. feet
|
3 baths 3 beds |
show details | |

|
#28
36th Avenue Ct
Greeley, CO 80634
|
1,545 sq. feet
|
3 baths 5 beds |
show details | |

|
#29
Shenandoah Way
Brighton, CO 80603
|
1,540 sq. feet
|
2 baths 4 beds |
show details | |

|
#30
Willow Dr
Brighton, CO 80603
|
1,880 sq. feet
|
3 baths 3 beds |
show details |
| Photo | Address | Area | Beds / Baths | Price | Details |
|---|---|---|---|---|---|

|
#31
N 4th St
La Salle, CO 80645
|
1,292 sq. feet
|
2 baths 4 beds |
show details | |

|
#32
50th Ave
Greeley, CO 80634
|
1,273 sq. feet
|
2 baths 3 beds |
show details | |

|
#33
Sunflower Grn
Frederick, CO 80530
|
1,200 sq. feet
|
2 baths 3 beds |
show details | |

|
#34
Leroux Street
Fort Lupton, CO 80621
|
1,960 sq. feet
|
3 baths 4 beds |
show details | |

|
#35
Hematite Ln
Brighton, CO 80603
|
1,316 sq. feet
|
2 baths 3 beds |
show details | |

|
#36
N 7th Ave
Brighton, CO 80601
|
926 sq. feet
|
1 baths 3 beds |
show details | |

|
#37
W 3rd St
Greeley, CO 80634
|
1,187 sq. feet
|
2 baths 2 beds |
show details | |

|
#38
68th Avenue Ct
Greeley, CO 80634
|
1,983 sq. feet
|
3 baths 3 beds |
show details | |

|
#39
Valley Sky Street
Fort Lupton, CO 80621
|
2,542 sq. feet
|
2 baths 4 beds |
show details | |

|
#40
Willow Ct
Brighton, CO 80603
|
1,040 sq. feet
|
2 baths 3 beds |
show details |
| Photo | Address | Area | Beds / Baths | Price | Details |
|---|---|---|---|---|---|

|
#41
W View Dr
Mead, CO 80542
|
2,528 sq. feet
|
2 baths 3 beds |
show details | |

|
#42
Mesa St
Brighton, CO 80601
|
2,373 sq. feet
|
3 baths 4 beds |
show details | |

|
#43
Greenwood Ct
Fort Lupton, CO 80621
|
1,144 sq. feet
|
2 baths 3 beds |
show details | |

|
#44
S Marjorie Ave
Milliken, CO 80543
|
794 sq. feet
|
1 baths 4 beds |
show details | |

|
#45
Comanche Creek Dr
Brighton, CO 80601
|
1,879 sq. feet
|
3 baths 4 beds |
show details | |

|
#46
County Road 24
Longmont, CO 80504
|
1,188 sq. feet
|
2 baths 3 beds |
show details | |

|
#47
18th St
Greeley, CO 80634
|
1,698 sq. feet
|
3 baths 3 beds |
show details | |

|
#48
S 3rd Ave
Brighton, CO 80601
|
768 sq. feet
|
1 baths 2 beds |
show details | |

|
#49
E Lavender Lane
Milliken, CO 80543
|
1,495 sq. feet
|
2 baths 3 beds |
show details | |

|
Check over 1 million property listings on Foreclosure.com!
|
browse all offers | |||

Latest news about housing in Platteville, CO collected exclusively by city-data.com from local newspapers, TV, and radio stations

 | Two Tattoo Parlors Now In Downtown Loveland (123 replies) |
| Dear lord am I making a mistake? (16 replies) |
| Fracking your future (494 replies) |
| Where in Colorado to move from Phoenix? (25 replies) |
| Thinking About Commuting to Denver (10 replies) |
| Illegal Immigration in Denver Area? (28 replies) |
Median year apartment built: 1973
Household type by relationship:
Households: 3,081- Male householders: 603 (164 living alone), Female householders: 427 (119 living alone)
583 spouses (583 opposite-sex spouses), 75 unmarried partners, (75 opposite-sex unmarried partners), 915 children (846 natural, 33 adopted, 35 stepchildren), 148 grandchildren, 28 brothers or sisters, 59 parents, 0 foster children, 109 other relatives, 129 non-relatives
Size of family households: 299 2-persons, 120 3-persons, 126 4-persons, 55 5-persons, 48 6-persons, 31 7-or-more-persons.
Size of nonfamily households: 303 1-person, 48 2-persons.
484 married couples with children.
79 single-parent households (33 men, 46 women).
76.4% of residents of Platteville speak English at home.
22.8% of residents speak Spanish at home (71% speak English very well, 20% speak English well, 9% speak English not well).
0.7% of residents speak other Indo-European language at home (100% speak English very well).
Foreign born population: 308 (10.0%)
(70.1% of them are naturalized citizens)
| Here: | 6.8 |
| State: | 6.8 |
| Here: | 4.5 |
| State: | 4.0 |
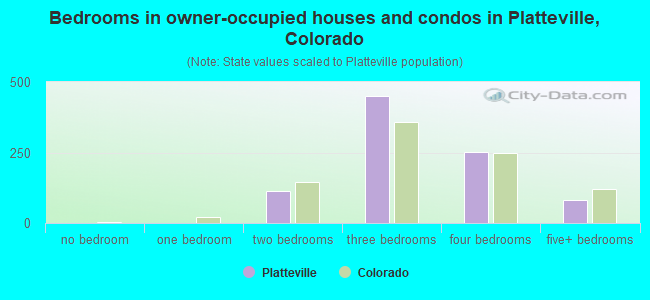
- Bedrooms in owner-occupied houses and condos in Platteville, Colorado
- 0no bedroom
- 01 bedroom
- 1152 bedrooms
- 4493 bedrooms
- 2524 bedrooms
- 835+ bedrooms
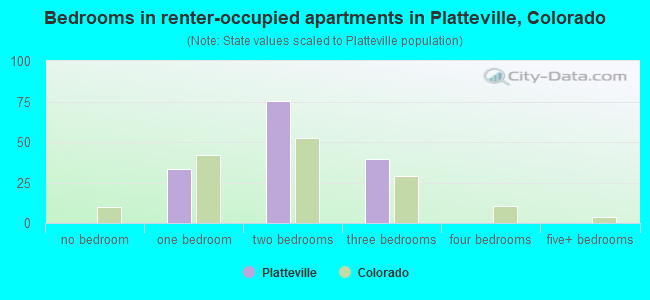
- Bedrooms in renter-occupied apartments in Platteville, Colorado
- 0no bedroom
- 331 bedroom
- 752 bedrooms
- 403 bedrooms
- 04 bedrooms
- 05+ bedrooms
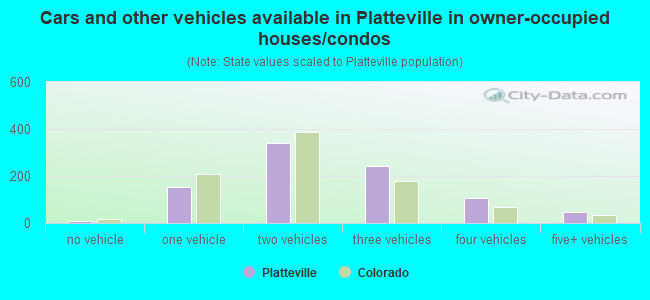
- Cars and other vehicles available in Platteville in owner-occupied houses/condos
- 9no vehicle
- 1521 vehicle
- 3412 vehicles
- 2423 vehicles
- 1064 vehicles
- 485+ vehicles
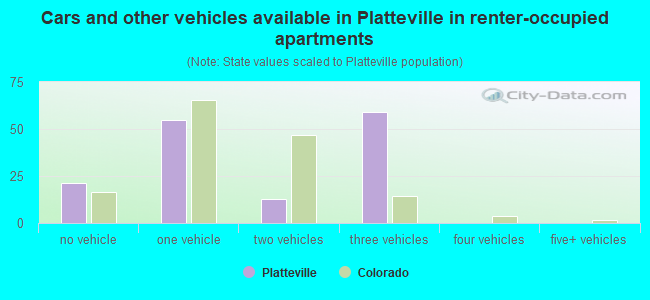
- Cars and other vehicles available in Platteville in renter-occupied apartments
- 21no vehicle
- 551 vehicle
- 132 vehicles
- 593 vehicles
- 04 vehicles
- 05+ vehicles
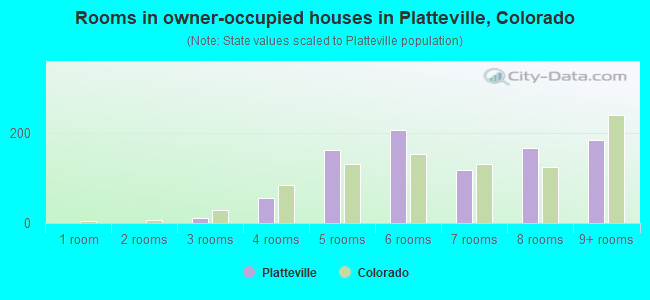
- Rooms in owner-occupied houses in Platteville, Colorado
- 01 room
- 02 rooms
- 103 rooms
- 554 rooms
- 1615 rooms
- 2066 rooms
- 1187 rooms
- 1668 rooms
- 1839+ rooms
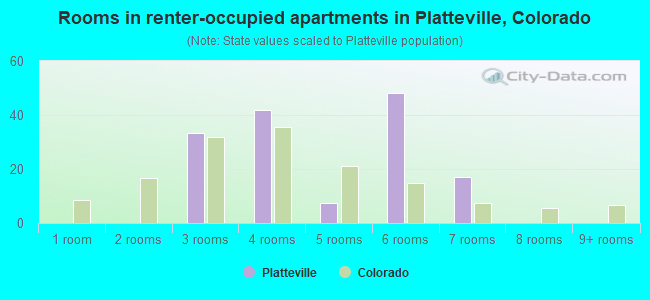
- Rooms in renter-occupied apartments in Platteville, Colorado
- 01 room
- 02 rooms
- 333 rooms
- 424 rooms
- 85 rooms
- 486 rooms
- 177 rooms
- 08 rooms
- 09+ rooms
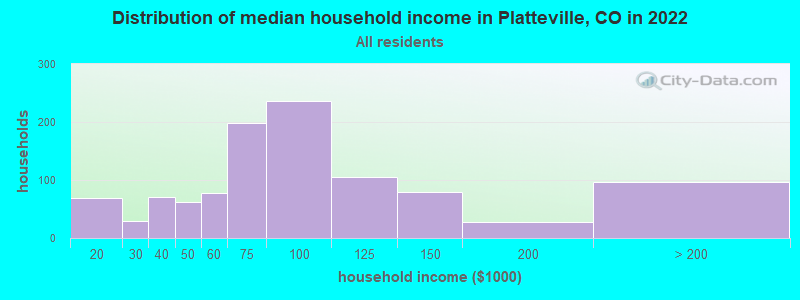
Platteville, CO household income distribution

- 69$10,000 to $19,999
- 29$20,000 to $29,999
- 71$30,000 to $39,999
- 62$40,000 to $49,999
- 78$50,000 to $59,999
- 198$60,000 to $74,999
- 237$75,000 to $99,999
- 105$100,000 to $124,999
- 79$125,000 to $149,999
- 28$150,000 to $199,999
- 97$200,000 or more
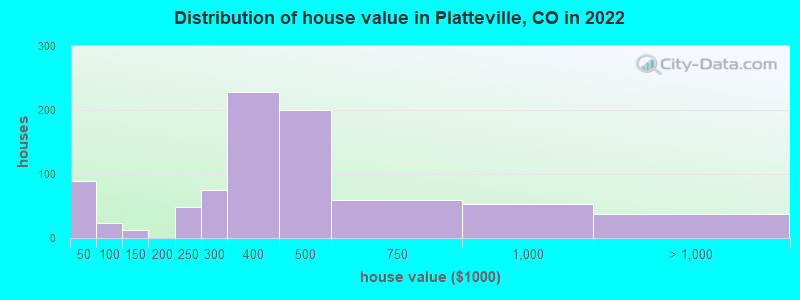
Home value of owner - occupied houses in 2022 in Platteville, CO
-
- 33Less than $10,000
- 8$20,000 to $24,999
- 11$25,000 to $29,999
- 20$35,000 to $39,999
- 14$40,000 to $49,999
- 6$50,000 to $59,999
- 2$60,000 to $69,999
- 13$125,000 to $149,999
- 48$200,000 to $249,999
- 75$250,000 to $299,999
- 228$300,000 to $399,999
- 200$400,000 to $499,999
- 59$500,000 to $749,999
- 53$750,000 to $999,999
- 37$1,000,000 to $1,499,999
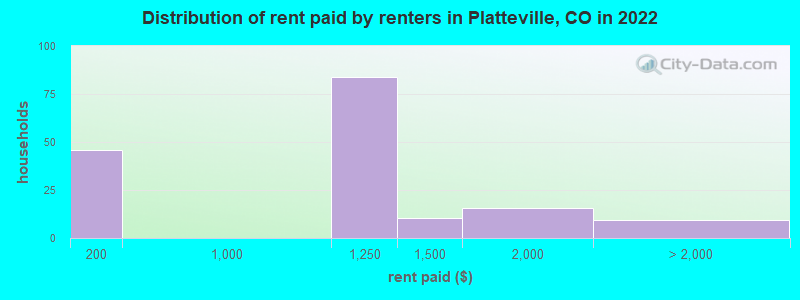
Rent paid by renters in 2022 in Platteville, CO
-
- 46$150 to $199
- 83$1,000 to $1,249
- 10$1,250 to $1,499
- 15$1,500 to $1,999
- 9No cash rent
Percentage of workers working in this county: 59.1%
Number of people working at home: 66 (4.0% of all workers)
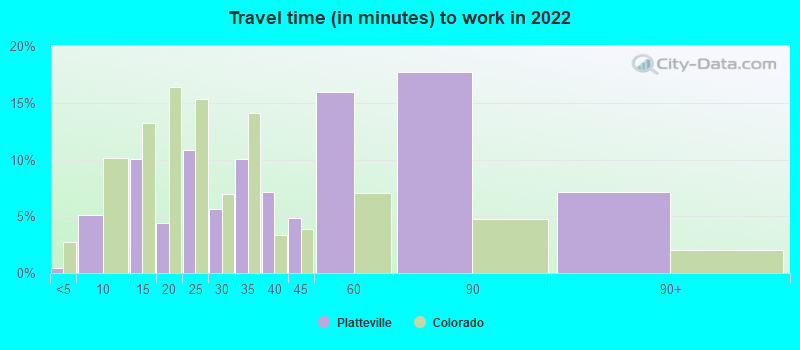
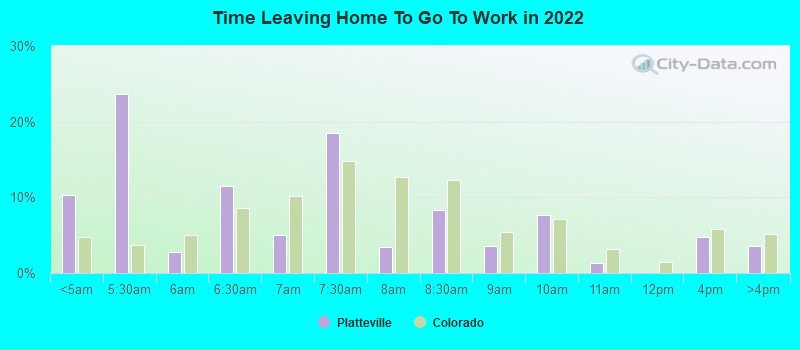
Travel time to work (commute)
- Less than 5 minutes: 24
- 5 to 9 minutes: 101
- 10 to 14 minutes: 167
- 15 to 19 minutes: 89
- 20 to 24 minutes: 205
- 25 to 29 minutes: 97
- 30 to 34 minutes: 227
- 35 to 39 minutes: 52
- 40 to 44 minutes: 250
- 45 to 59 minutes: 141
- 60 to 89 minutes: 147
- 90 or more minutes: 44
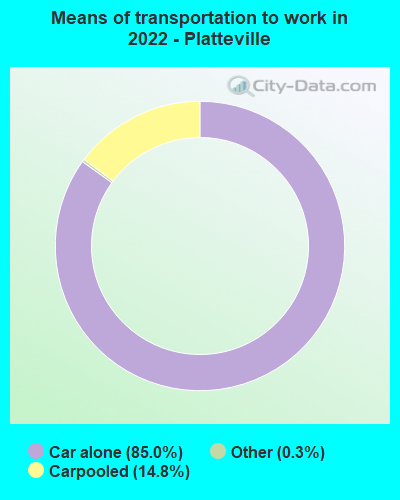
Means of transportation to work:
- Drove a car alone: 1,306 (77.8%)
- Carpooled: 235 (14.0%)
- Taxi: 4 (0.2%)
- Worked at home: 66 (3.9%)
- Unemployment by race in 2022
- Unemployment rate for White non-Hispanic residents
- 7.6%Males
- 12.2%Females
- Unemployment rate for other race residents
- 13.9%Females
- Unemployment rate for two or more race residents
- 15.2%Males
- Unemployment rate for Hispanic or Latino residents
- 3.6%Males
- 3.2%Females
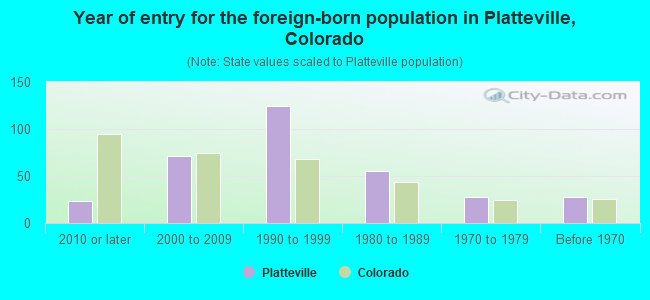
- Year of entry for the foreign-born population in Platteville, Colorado
- 232010 or later
- 712000 to 2009
- 1251990 to 1999
- 551980 to 1989
- 281970 to 1979
- 28Before 1970
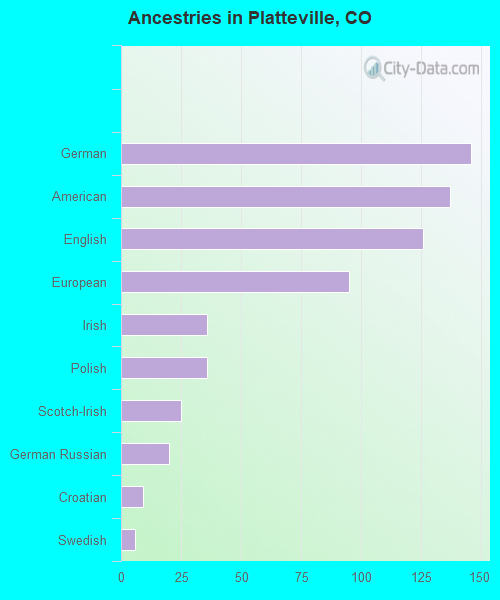
First ancestries reported:
- German: 146 (7.9%)
- American: 137 (7.4%)
- English: 126 (6.8%)
- European: 95 (5.1%)
- Irish: 36 (1.9%)
- Polish: 36 (1.9%)
- Scotch-Irish: 25 (1.4%)
- German Russian: 20 (1.1%)
- Croatian: 9 (0.5%)
- Swedish: 6 (0.3%)
Most common places of birth for foreign-born residents (%):
| Platteville: | 87.0% (247) |
| Colorado: | 38.3% (209,491) |
| Platteville: | 12.0% (34) |
| Colorado: | 2.5% (13,706) |
Place of birth for U.S.-born residents:
- This state: 1,935
- Other state: 864
- Northeast: 28
- Midwest: 359
- South: 255
- West: 196
88.7% of Platteville residents lived in the same house 1 years ago.
Out of people who lived in different houses, 23.7% lived in this county.
Out of people who lived in different counties, 69.9% lived in Colorado.
| Platteville: | 88.7% |
| State average: | 83.6% |
Education attainment for males 25 years and older:
- No schooling: 0
- Nursery to 4th grade: 0
- 5th and 6th grade: 3
- 7th and 8th grade: 107
- 9th grade: 33
- 10th grade: 48
- 11th grade: 77
- 12th grade, no diploma: 38
- High school graduate (or equivalency): 252
- Less than 1 year of college: 35
- Some college more than 1 year, no degree: 154
- Associate degree: 80
- Bachelor's degree: 143
- Master's degree: 18
- Professional school degree: 0
- Doctorate degree: 0
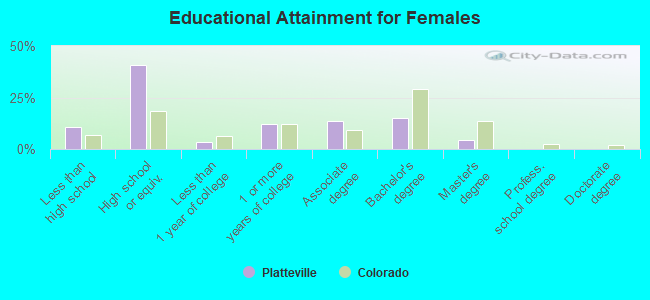
Education attainment for females 25 years and older:
- No schooling: 0
- Nursery to 4th grade: 0
- 5th and 6th grade: 12
- 7th and 8th grade: 0
- 9th grade: 0
- 10th grade: 0
- 11th grade: 69
- 12th grade, no diploma: 33
- High school graduate (or equivalency): 434
- Less than 1 year of college: 34
- Some college more than 1 year, no degree: 127
- Associate degree: 145
- Bachelor's degree: 161
- Master's degree: 47
- Professional school degree: 0
- Doctorate degree: 0
Housing units in structures:
- One, detached: 824
- One, attached: 24
- 3 or 4: 58
- 5 to 9: 35
- 20 to 49: 11
- Mobile homes: 149
Median worth of mobile homes: $53,670
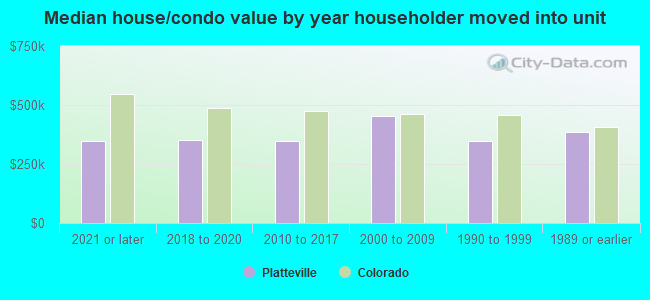
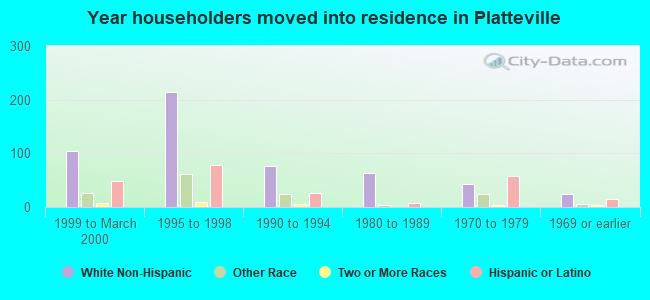
House/condo owner moved in on average 12 years ago
Renter moved in on average 5 years ago
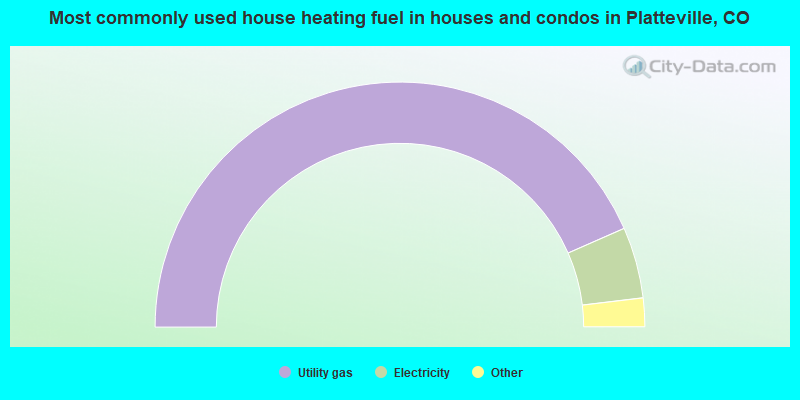
- 86.9%Utility gas
- 9.4%Electricity
- 1.6%Bottled, tank, or LP gas
- 1.3%No fuel used
- 0.8%Solar energy
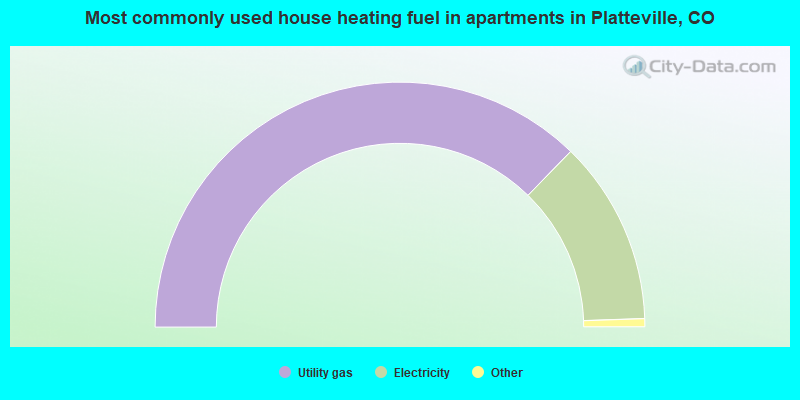
- 75.4%Utility gas
- 24.6%Electricity
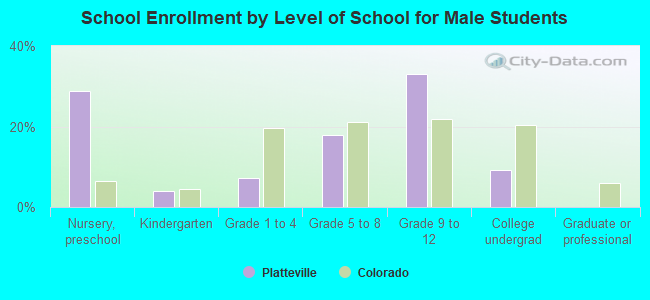
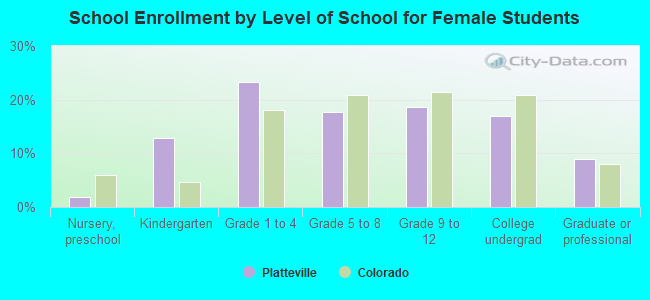
Private vs. public school enrollment:
| Here: | 13.7% |
| Colorado: | 11.4% |
| Here: | 8.3% |
| Colorado: | 8.5% |
| Here: | 25.6% |
| Colorado: | 14.0% |