Portsmouth, RI (Rhode Island) Houses and Residents
| Portsmouth: | $619,392 |
| Rhode Island: | $383,900 |
Total population: 17,389 (Urban population: 16,813, Rural population: 336 (all nonfarm))
Houses: 7,386 (6,758 occupied: 5,003 owner occupied, 1,755 renter occupied)
| % of renters here: | 26% |
| State: | 37% |
Housing density: 318 houses/condos per square mile
Median price asked for vacant for-sale houses and condos in 2022 in this county: $666,969.
Median contract rent in 2022: $1,359 (lower quartile is $886, upper quartile is $1,978)
Median rent asked for vacant for-rent units in 2022: $1,295
Median gross rent in Portsmouth, RI in 2022: $1,542
Housing units in Portsmouth with a mortgage: 3,242 (408 second mortgage, 509 home equity loan, 15 both second mortgage and home equity loan)
Houses without a mortgage: 1,126
Compare current foreclosures near Portsmouth, RI:
| Photo | Address | Area | Beds / Baths | Price | Details |
|---|---|---|---|---|---|

|
#1
Hargraves Dr
Portsmouth, RI 02871
|
3,405 sq. feet
|
3 baths 4 beds |
show details | |

|
#2
Chase Rd
Portsmouth, RI 02871
|
950 sq. feet
|
1 baths 3 beds |
show details | |

|
#3
Kenneth Ave
Portsmouth, RI 02871
|
936 sq. feet
|
1 baths 3 beds |
show details | |

|
#4
Brownell Ln
Portsmouth, RI 02871
|
- sq. feet
|
- baths - beds |
show details | |

|
#5
Dubois St
Portsmouth, RI 02871
|
- sq. feet
|
- baths - beds |
show details | |

|
#6
Lehigh Te
Portsmouth, RI 02871
|
- sq. feet
|
- baths - beds |
show details | |

|
#7
Hornbeam Dr
Cranston, RI 02921
|
1,456 sq. feet
|
1 baths 3 beds |
$354,900
|
show details |

|
#8
Hallville Rd
Exeter, RI 02822
|
943 sq. feet
|
1 baths 2 beds |
$69,900
|
show details |

|
#9
Albion St
Fall River, MA 02723
|
2,481 sq. feet
|
3 baths 6 beds |
show details | |

|
#10
Wingold St
Fall River, MA 02720
|
1,028 sq. feet
|
1 baths 2 beds |
show details |
| Photo | Address | Area | Beds / Baths | Price | Details |
|---|---|---|---|---|---|

|
#11
Woburn St
Cranston, RI 02910
|
1,212 sq. feet
|
1 baths 4 beds |
show details | |

|
#12
Knotty Oak Rd
Coventry, RI 02816
|
1,080 sq. feet
|
1 baths 2 beds |
show details | |

|
#13
Sherman St
Newport, RI 02840
|
1,368 sq. feet
|
1 baths 3 beds |
show details | |

|
#14
Follett St
East Providence, RI 02914
|
1,584 sq. feet
|
2 baths 4 beds |
show details | |

|
#15
Coventry Dr
Coventry, RI 02816
|
1,560 sq. feet
|
1 baths 3 beds |
show details | |

|
#16
Claremont Avenue A/k/a 5 Claremont Avenue
Bristol, RI 02809
|
1,852 sq. feet
|
2 baths 2 beds |
show details | |

|
#17
Bracken St
Cranston, RI 02920
|
1,248 sq. feet
|
1 baths 4 beds |
show details | |

|
#18
Mill St
New Bedford, MA 02740
|
1,542 sq. feet
|
1 baths 3 beds |
show details | |

|
#19
Hazard Ave
Warwick, RI 02889
|
1,017 sq. feet
|
1 baths 3 beds |
show details | |

|
#20
Chace Ave
Warren, RI 02885
|
1,224 sq. feet
|
1 baths 2 beds |
show details |
| Photo | Address | Area | Beds / Baths | Price | Details |
|---|---|---|---|---|---|

|
#21
Spooner Ave
Warwick, RI 02886
|
1,777 sq. feet
|
2 baths 4 beds |
show details | |

|
#22
Lisa Ln
Bristol, RI 02809
|
1,658 sq. feet
|
2 baths 3 beds |
show details | |

|
#23
Blanding Ave
East Providence, RI 02914
|
1,165 sq. feet
|
1 baths 3 beds |
show details | |

|
#24
Marion Avenue
Providence, RI 02905
|
1,252 sq. feet
|
1 baths 3 beds |
show details | |

|
#25
Lewis St
Dighton, MA 02715
|
3,144 sq. feet
|
2 baths 3 beds |
show details | |

|
#26
Van Zandt Ave
Warwick, RI 02889
|
800 sq. feet
|
1 baths 4 beds |
show details | |

|
#27
Louise Dr
Tiverton, RI 02878
|
1,056 sq. feet
|
1 baths 3 beds |
show details | |

|
#28
Saint John St
South Dartmouth, MA 02748
|
1,182 sq. feet
|
2 baths 3 beds |
show details | |

|
#29
Hancock St
Tiverton, RI 02878
|
1,628 sq. feet
|
2 baths 3 beds |
show details | |

|
#30
Tero Dr
Coventry, RI 02816
|
1,456 sq. feet
|
1 baths 3 beds |
show details |
| Photo | Address | Area | Beds / Baths | Price | Details |
|---|---|---|---|---|---|

|
#31
Pinnery Ave
Warwick, RI 02886
|
1,299 sq. feet
|
1 baths 3 beds |
show details | |

|
#32
Yankee Peddler Dr
Somerset, MA 02726
|
2,000 sq. feet
|
2 baths 3 beds |
show details | |

|
#33
Ferncrest Ave
Providence, RI 02905
|
1,552 sq. feet
|
2 baths 6 beds |
show details | |

|
#34
Ferncrest Ave
Providence, RI 02905
|
1,552 sq. feet
|
2 baths 6 beds |
show details | |

|
#35
Albert Ave
Providence, RI 02905
|
3,487 sq. feet
|
3 baths 6 beds |
show details | |

|
#36
Timber Walk
West Warwick, RI 02893
|
2,038 sq. feet
|
2 baths 3 beds |
show details | |

|
#37
Shaw Ave
Providence, RI 02905
|
5,566 sq. feet
|
4 baths 9 beds |
show details | |

|
#38
Marion Ave
Providence, RI 02905
|
1,300 sq. feet
|
1 baths 3 beds |
show details | |

|
#39
Country Dr
Somerset, MA 02726
|
1,908 sq. feet
|
3 baths 4 beds |
show details | |

|
#40
E Greenwich Ave, Bldg 2
West Warwick, RI 02893
|
1,264 sq. feet
|
2 baths 2 beds |
show details |
| Photo | Address | Area | Beds / Baths | Price | Details |
|---|---|---|---|---|---|

|
#41
Eleanor St
North Dartmouth, MA 02747
|
2,272 sq. feet
|
1 baths 4 beds |
show details | |

|
#42
Quaker Ln Apt 42
West Warwick, RI 02893
|
1,140 sq. feet
|
1 baths 2 beds |
show details | |

|
#43
Ferncrest Ave
Providence, RI 02905
|
2,048 sq. feet
|
1 baths 4 beds |
show details | |

|
#44
E Greenwich Ave
West Warwick, RI 02893
|
1,998 sq. feet
|
2 baths 3 beds |
show details | |

|
#45
Elder Ave
Riverside, RI 02915
|
1,248 sq. feet
|
1 baths 3 beds |
show details | |

|
#46
Lockwood St
West Warwick, RI 02893
|
1,390 sq. feet
|
1 baths 3 beds |
show details | |

|
#47
South Rd
Exeter, RI 02822
|
1,258 sq. feet
|
1 baths 3 beds |
show details | |

|
#48
Marion Ave N
Providence, RI 02905
|
1,296 sq. feet
|
1 baths 3 beds |
show details | |

|
#49
Perkins St
West Warwick, RI 02893
|
1,664 sq. feet
|
1 baths 4 beds |
show details | |

|
Check over 1 million property listings on Foreclosure.com!
|
browse all offers | |||
Latest news about housing in Portsmouth, RI collected exclusively by city-data.com from local newspapers, TV, and radio stations

 | The HGTV Dream Home is in Portsmouth (37 replies) |
| RI Current real estate market (22 replies) |
| Boston (more than ever) Drives RI's housing market - Up (239 replies) |
| Buying a house in RI vs CT? (177 replies) |
| Murder in Portsmouth (13 replies) |
| House buyers flooding in from MA & NYC (90 replies) |

Household type by relationship:
Households: 79,312- In family households: 62,154 (14,342 male householders, 6,734 female householders)
16,332 spouses, 20,645 children (19,415 natural, 503 adopted, 727 stepchildren), 1,010 grandchildren, 512 brothers or sisters, 459 parents, foster children, 414 other relatives, 1,346 non-relatives
- In nonfamily households: 17,158 (6,222 male householders (4,844 living alone)), 7,613 female householders (6,397 living alone)), 3,323 nonrelatives
- In group quarters: 3,576 (539 institutionalized population)
13,805 married couples with children.
4,371 single-parent households (711 men, 3,660 women).
94.3% of residents of Portsmouth speak English at home.
1.2% of residents speak Spanish at home (88% speak English very well, 5% speak English well, 7% speak English not well).
3.5% of residents speak other Indo-European language at home (76% speak English very well, 11% speak English well, 12% speak English not well).
0.7% of residents speak Asian or Pacific Island language at home (56% speak English very well, 39% speak English well, 5% don't speak English at all).
0.3% of residents speak other language at home (41% speak English very well, 59% speak English well).
Foreign born population: 1,212 (7.1%)
(54.0% of them are naturalized citizens)
| Here: | 6.6 |
| State: | 6.2 |
| Here: | 4.6 |
| State: | 4.1 |

- Bedrooms in owner-occupied houses and condos in Portsmouth, Rhode Island
- 0no bedroom
- 1081 bedroom
- 1,0962 bedrooms
- 2,6393 bedrooms
- 1,0234 bedrooms
- 1375+ bedrooms

- Bedrooms in renter-occupied apartments in Portsmouth, Rhode Island
- 39no bedroom
- 3371 bedroom
- 6762 bedrooms
- 5303 bedrooms
- 1544 bedrooms
- 195+ bedrooms

- Cars and other vehicles available in Portsmouth in owner-occupied houses/condos
- 60no vehicle
- 1,2911 vehicle
- 2,4842 vehicles
- 8563 vehicles
- 2084 vehicles
- 1045+ vehicles

- Cars and other vehicles available in Portsmouth in renter-occupied apartments
- 155no vehicle
- 7191 vehicle
- 7842 vehicles
- 693 vehicles
- 204 vehicles
- 85+ vehicles

- Rooms in owner-occupied houses in Portsmouth, Rhode Island
- 01 room
- 172 rooms
- 1203 rooms
- 4394 rooms
- 1,0665 rooms
- 1,0306 rooms
- 1,0447 rooms
- 7648 rooms
- 5239+ rooms

- Rooms in renter-occupied apartments in Portsmouth, Rhode Island
- 391 room
- 1052 rooms
- 2563 rooms
- 5134 rooms
- 2625 rooms
- 3026 rooms
- 1097 rooms
- 1238 rooms
- 469+ rooms


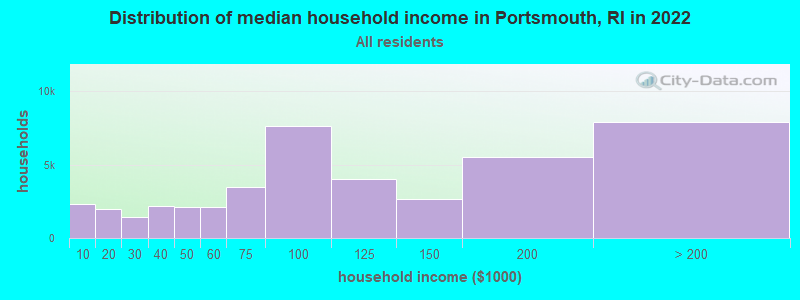
Portsmouth, RI household income distribution

- 2,341Less than $10,000
- 1,990$10,000 to $19,999
- 1,436$20,000 to $29,999
- 2,164$30,000 to $39,999
- 2,101$40,000 to $49,999
- 2,118$50,000 to $59,999
- 3,477$60,000 to $74,999
- 7,589$75,000 to $99,999
- 4,039$100,000 to $124,999
- 2,679$125,000 to $149,999
- 5,519$150,000 to $199,999
- 7,893$200,000 or more
Percentage of workers working in this county: 81.9%
Number of people working at home: 1,311 (13.4% of all workers)
Travel time to work (commute)
- Less than 5 minutes: 309
- 5 to 9 minutes: 990
- 10 to 14 minutes: 1,554
- 15 to 19 minutes: 1,510
- 20 to 24 minutes: 1,651
- 25 to 29 minutes: 479
- 30 to 34 minutes: 674
- 35 to 39 minutes: 100
- 40 to 44 minutes: 250
- 45 to 59 minutes: 527
- 60 to 89 minutes: 206
- 90 or more minutes: 147
Means of transportation to work:
- Drove a car alone: 7,471 (85.7%)
- Carpooled: 623 (7.1%)
- Bus or trolley bus: 65 (0.7%)
- Subway or elevated: 17 (0.2%)
- Walked: 134 (1.5%)
- Other means: 87 (1.0%)
- Worked at home: 321 (3.7%)


- Year of entry for the foreign-born population in Portsmouth, Rhode Island
- 821995 to March 2000
- 751990 to 1994
- 391985 to 1989
- 501980 to 1984
- 541975 to 1979
- 751970 to 1974
- 1151965 to 1969
- 193Before 1965

First ancestries reported:
- Irish: 4,277 (19.8%)
- English: 3,173 (14.7%)
- Portuguese: 2,452 (11.3%)
- German: 2,119 (9.8%)
- Other: 1,935 (8.9%)
- Italian: 1,866 (8.6%)
- French: 1,514 (7.0%)
- Polish: 914 (4.2%)
- French Canadian: 698 (3.2%)
- United States: 463 (2.1%)
- Scottish: 442 (2.0%)
- Scotch-Irish: 306 (1.4%)
- Swedish: 240 (1.1%)
- Dutch: 214 (1.0%)
- Norwegian: 154 (0.7%)
- Russian: 147 (0.7%)
- Arab: 131 (0.6%)
- Greek: 114 (0.5%)
- Slovak: 103 (0.5%)
- Danish: 77 (0.4%)
- Lithuanian: 65 (0.3%)
- Swiss: 59 (0.3%)
- Welsh: 48 (0.2%)
- Hungarian: 43 (0.2%)
- Czech: 28 (0.1%)
- Subsaharan African: 27 (0.1%)
- Ukrainian: 25 (0.1%)
- West Indian: 16 (0.07%)
Most common places of birth for foreign-born residents (%):
| Portsmouth: | 14.3% (98) |
| Rhode Island: | 2.6% (3,120) |
| Portsmouth: | 13.2% (90) |
| Rhode Island: | 17.6% (21,016) |
| Portsmouth: | 10.1% (69) |
| Rhode Island: | 1.6% (1,936) |
| Portsmouth: | 9.2% (63) |
| Rhode Island: | 3.4% (4,015) |
| Portsmouth: | 6.7% (46) |
| Rhode Island: | 1.7% (1,982) |
| Portsmouth: | 4.7% (32) |
| Rhode Island: | 0.7% (789) |
| Portsmouth: | 4.5% (31) |
| Rhode Island: | 3.8% (4,502) |
| Portsmouth: | 4.1% (28) |
| Rhode Island: | 0.5% (640) |
| Portsmouth: | 2.9% (20) |
| Rhode Island: | 0.7% (792) |
| Portsmouth: | 2.9% (20) |
| Rhode Island: | 0.3% (383) |
| Portsmouth: | 2.8% (19) |
| Rhode Island: | 0.7% (779) |
| Portsmouth: | 2.6% (18) |
| Rhode Island: | 0.1% (108) |
| Portsmouth: | 2.5% (17) |
| Rhode Island: | 0.8% (900) |
| Portsmouth: | 2.0% (14) |
| Rhode Island: | 0.2% (210) |
| Portsmouth: | 1.8% (12) |
| Rhode Island: | 1.6% (1,954) |
| Portsmouth: | 1.8% (12) |
| Rhode Island: | 1.2% (1,423) |
| Portsmouth: | 1.6% (11) |
| Rhode Island: | 0.2% (235) |
Place of birth for U.S.-born residents:
- This state: 6,911
- Other state: 9,360
- Northeast: 6,333
- Midwest: 1,003
- South: 1,306
- West: 718
61% of Portsmouth residents lived in the same house 5 years ago.
Out of people who lived in different houses, 49% lived in this county.
Out of people who lived in different counties, 20% lived in Rhode Island.
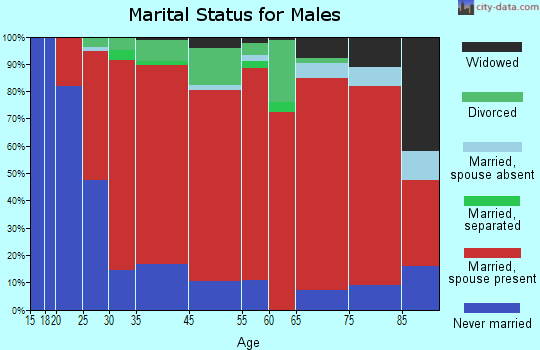
Education attainment for males 25 years and older:
- No schooling: 6
- Nursery to 4th grade: 20
- 5th and 6th grade: 28
- 7th and 8th grade: 110
- 9th grade: 71
- 10th grade: 74
- 11th grade: 70
- 12th grade, no diploma: 103
- High school graduate (or equivalency): 1,217
- Less than 1 year of college: 222
- Some college more than 1 year, no degree: 805
- Associate degree: 315
- Bachelor's degree: 1,516
- Master's degree: 785
- Professional school degree: 271
- Doctorate degree: 115

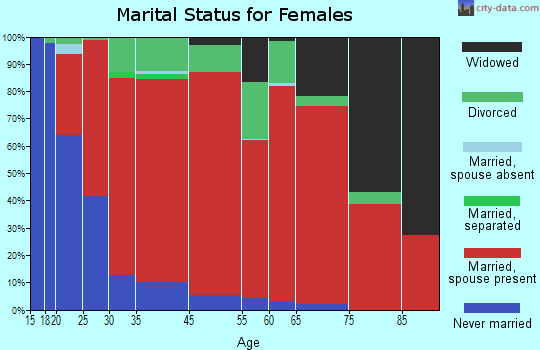
Education attainment for females 25 years and older:
- No schooling: 15
- Nursery to 4th grade: 16
- 5th and 6th grade: 35
- 7th and 8th grade: 179
- 9th grade: 48
- 10th grade: 154
- 11th grade: 65
- 12th grade, no diploma: 105
- High school graduate (or equivalency): 1,623
- Less than 1 year of college: 406
- Some college more than 1 year, no degree: 703
- Associate degree: 486
- Bachelor's degree: 1,604
- Master's degree: 719
- Professional school degree: 107
- Doctorate degree: 47

Housing units in structures:
- One, detached: 5,559
- One, attached: 365
- Two: 479
- 3 or 4: 220
- 5 to 9: 133
- 10 to 19: 17
- 20 to 49: 112
- 50 or more: 139
- Mobile homes: 355
- Boats, RVs, vans, etc.: 7
Median worth of mobile homes: $86,569
Housing units lacking complete kitchen facilities: 0.5%

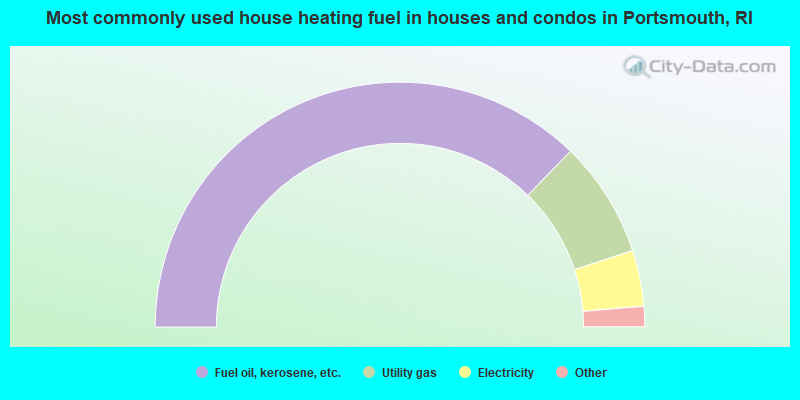
- 74.6%Fuel oil, kerosene, etc.
- 15.4%Utility gas
- 7.4%Electricity
- 1.5%Bottled, tank, or LP gas
- 0.7%Wood
- 0.3%Coal or coke
- 0.2%Other fuel
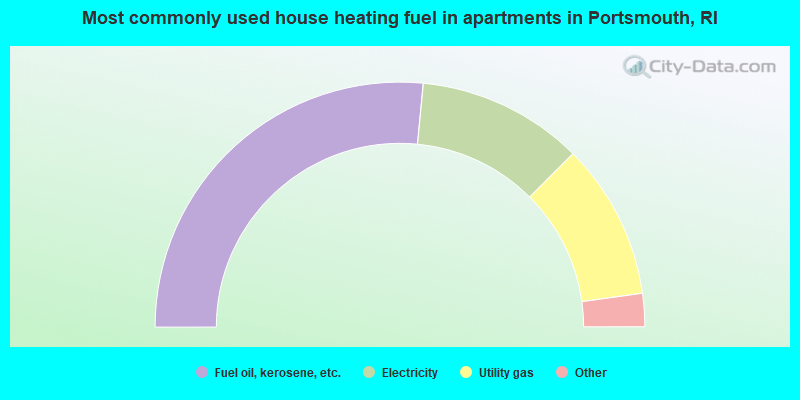
- 53.0%Fuel oil, kerosene, etc.
- 21.9%Electricity
- 20.6%Utility gas
- 1.9%Bottled, tank, or LP gas
- 1.8%No fuel used
- 0.4%Wood
- 0.3%Other fuel
Private vs. public school enrollment:
| Here: | 14.9% |
| Rhode Island: | 12.6% |
| Here: | 11.3% |
| Rhode Island: | 12.7% |
| Here: | 33.2% |
| Rhode Island: | 43.8% |


