Poteau, OK (Oklahoma) Houses and Residents
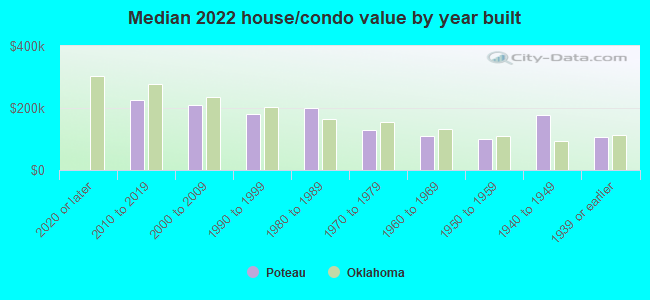
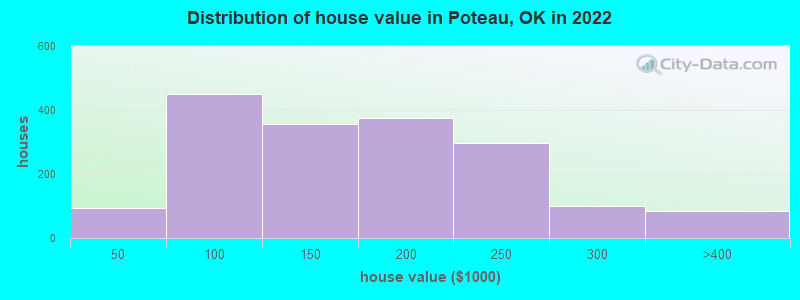
Estimated median house or condo value in 2022: $155,609 (it was $54,700 in 2000 )
Poteau:
$155,609Oklahoma:
$191,700
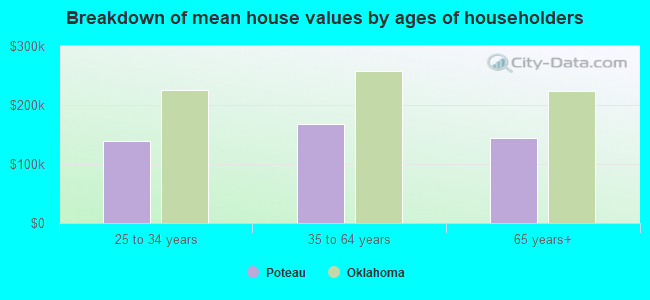
Lower value quartile - upper value quartile: $98,082 - $216,892Mean price in 2022: Detached houses: $161,655 Here:
$161,655State:
$255,409
Mobile homes: $54,948 Here:
$54,948State:
$110,804
Total population: 8,665 (Urban population: 6,670 (all inside urban clusters), Rural population: 1,153 (19 farm, 1,134 nonfarm ))
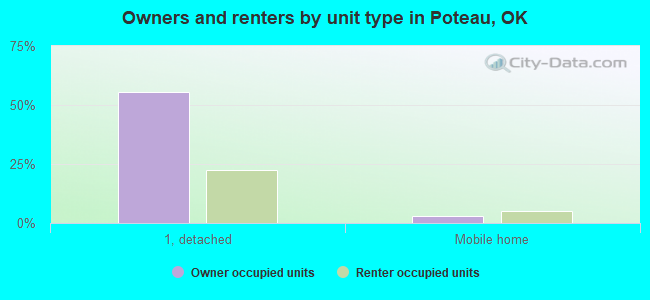
Houses: 3,632 (3,185 occupied: 1,918 owner occupied, 1,326 renter occupied )
% of renters here:
41%State:
35%
Housing density: 127 houses/condos per square mile
Median price asked for vacant for-sale houses and condos in 2022: $187,363.
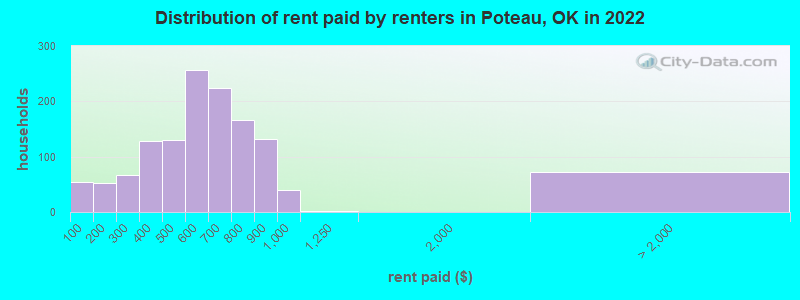
Median contract rent in 2022: $577 (lower quartile is $449, upper quartile is $724)
Median rent asked for vacant for-rent units in 2022: $591
Median gross rent in Poteau, OK in 2022: $792
Housing units in Poteau with a mortgage: 1,048 (16 second mortgage, 0 home equity loan, 16 both second mortgage and home equity loan )Houses without a mortgage: 0
Median household income for houses/condos with a mortgage: $69,719
Median household income for apartments without a mortgage: $34,687
Median monthly housing costs: $758
Data:
Median house or condo value ($)
Median house or condo value ($ change since 2000)
Median house or condo value ($) - White
Median house or condo value ($) - Black or African American
Median house or condo value ($) - Asian
Median house or condo value ($) - Hispanic or Latino
Median house or condo value ($) - American Indian and Alaska Native
Median house or condo value ($) - Multirace
Median house or condo value ($) - Other Race
Median price asked for mobile homes ($)
Household density (households per square mile)
Mean house or condo value by units in structure - 1, detached ($)
Mean house or condo value by units in structure - 1, attached ($)
Mean house or condo value by units in structure - 2 ($)
Mean house or condo value by units in structure by units in structure - 3 or 4 ($)
Mean house or condo value by units in structure - 5 or more ($)
Mean house or condo value by units in structure - Boat, RV, van, etc. ($)
Mean house or condo value by units in structure - Mobile home ($)
Median contract rent ($)
Median contract rent - Lower quartile ($)
Median contract rent - Upper quartile ($)
Median gross rent ($)
Urban houses (%)
Rural houses (%)
Houses occupied (%)
Houses occupied (% change since 2000)
Houses owner occupied (%)
Houses owner occupied (% change since 2000)
Houses renter occupied (%)
Houses renter occupied (% change since 2000)
Vacant housing units - For rent (%)
Vacant housing units - For rent (% change since 2000)
Vacant housing units - For sale only (%)
Vacant housing units - For sale only (% change since 2000)
Vacant housing units - Rented or sold, not occupied (%)
Vacant housing units - Rented or sold, not occupied (% change since 2000)
Vacant housing units - For seasonal, recreational, or occasional use (%)
Vacant housing units - For seasonal, recreational, or occasional use (% change since 2000)
Vacant housing units - For migrant workers (%)
Vacant housing units - For migrant workers (% change since 2000)
Vacant housing units - Other vacant (%)
Vacant housing units - Other vacant (% change since 2000)
Median monthly housing costs ($)
Median household income for houses/condos with a mortgage ($)
Median household income for houses/condos without a mortgage ($)
Median household income ($)
Median household income ($) - White
Median household income ($) - Black or African American
Median household income ($) - Asian
Median household income ($) - Hispanic or Latino
Median household income ($) - American Indian and Alaska Native
Median household income ($) - Multirace
Median household income ($) - Other Race
Mortgage status - with mortgage (%)
Mortgage status - with second mortgage (%)
Mortgage status - with home equity loan (%)
Mortgage status - with both second mortgage and home equity loan (%)
Mortgage status - without a mortgage (%)
Median year house/condo built
Median year apartment built
Household type by relationship - Male householder living alone (%)
Household type by relationship - Male householder not living alone (%)
Household type by relationship - Female householder living alone (%)
Household type by relationship - Female householder not living alone (%)
Household type by relationship - Opposite-Sex spouse (%)
Household type by relationship - Same-Sex spouse (%)
Household type by relationship - Opposite-Sex unmarried partner (%)
Household type by relationship - Same-Sex unmarried partner (%)
Household type by relationship - In group quarters (%)
Size of family households - 2-person household (%)
Size of family households - 3-person household (%)
Size of family households - 4-person household (%)
Size of family households - 5-person household (%)
Size of family households - 6-person household (%)
Size of family households - 7-or-more-person household (%)
Size of nonfamily households - 1-person household (%)
Size of nonfamily households - 2-person household (%)
Size of nonfamily households - 3-person household (%)
Size of nonfamily households - 4-person household (%)
Size of nonfamily households - 5-person household (%)
Size of nonfamily households - 6-person household (%)
Size of nonfamily households - 7-or-moreperson household (%)
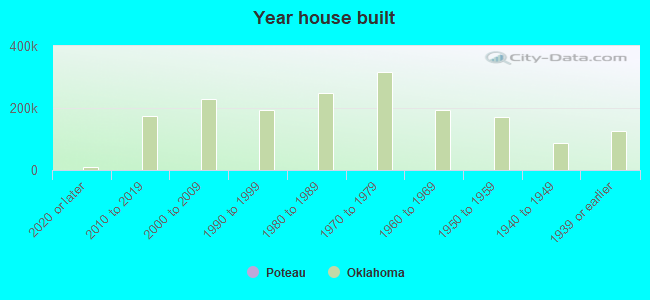
Year house built - Built 2010 or later (%)
Year house built - Built 2000 to 2009 (%)
Year house built - Built 1990 to 1999 (%)
Year house built - Built 1980 to 1989 (%)
Year house built - Built 1970 to 1979 (%)
Year house built - Built 1960 to 1969 (%)
Year house built - Built 1950 to 1959 (%)
Year house built - Built 1940 to 1949 (%)
Year house built - Built 1939 or earlier (%)
Median number of rooms in houses and condos
Median number of rooms in apartments
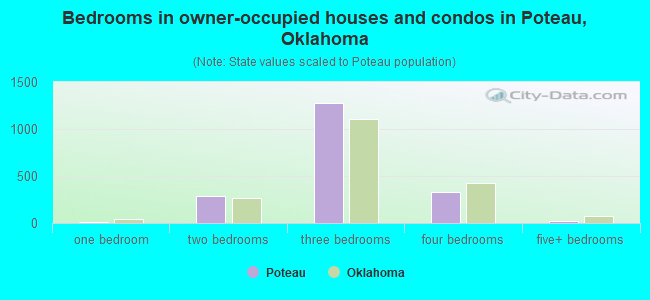
Median number of bedrooms in owner occupied houses
Mean number of bedrooms in owner occupied houses
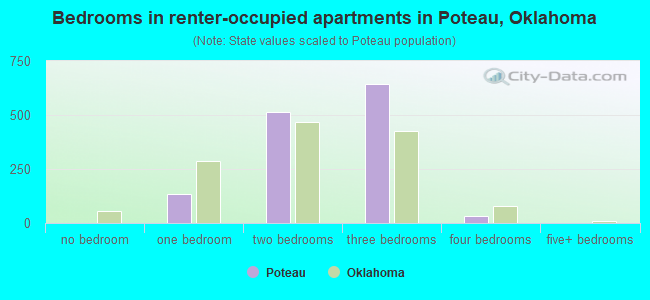
Median number of bedrooms in renter occupied houses
Mean number of bedrooms in renter occupied houses
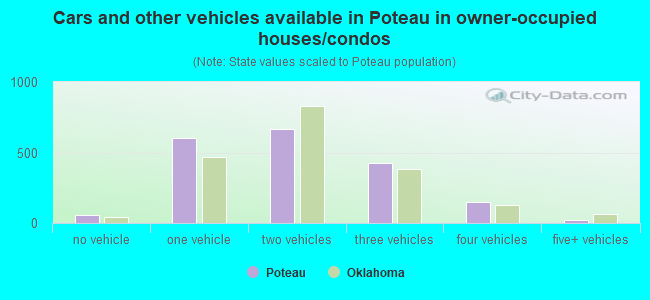
Median number of vehichles in owner occupied houses
Mean number of vehichles in owner occupied houses
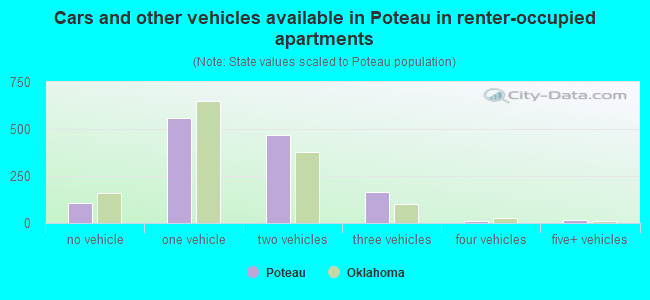
Median number of vehichles in renter occupied houses
Mean number of vehichles in renter occupied houses
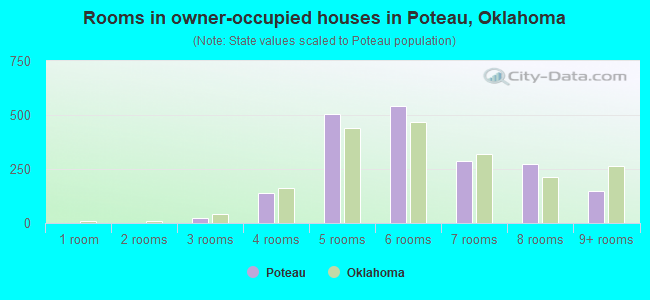
Rooms in owner-occupied houses - 1 room (%)
Rooms in owner-occupied houses - 2 rooms (%)
Rooms in owner-occupied houses - 3 rooms (%)
Rooms in owner-occupied houses - 4 rooms (%)
Rooms in owner-occupied houses - 5 rooms (%)
Rooms in owner-occupied houses - 6 rooms (%)
Rooms in owner-occupied houses - 7 rooms (%)
Rooms in owner-occupied houses - 8 rooms (%)
Rooms in owner-occupied houses - 9+ rooms (%)
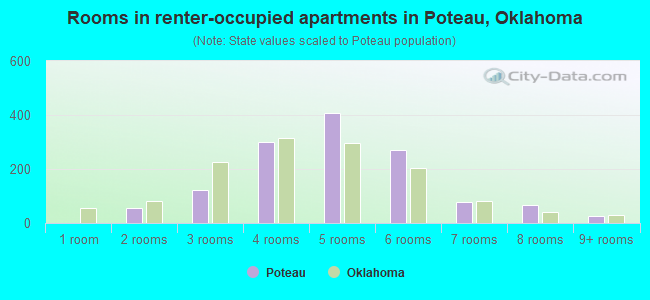
Rooms in renter-occupied houses - 1 room (%)
Rooms in renter-occupied houses - 2 rooms (%)
Rooms in renter-occupied houses - 3 rooms (%)
Rooms in renter-occupied houses - 4 rooms (%)
Rooms in renter-occupied houses - 5 rooms (%)
Rooms in renter-occupied houses - 6 rooms (%)
Rooms in renter-occupied houses - 7 rooms (%)
Rooms in renter-occupied houses - 8 rooms (%)
Rooms in renter-occupied houses - 9+ rooms (%)
Bedrooms in owner-occupied houses - no bedrooms (%)
Bedrooms in owner-occupied houses - 1 bedroom (%)
Bedrooms in owner-occupied houses - 2 bedrooms (%)
Bedrooms in owner-occupied houses - 3 bedrooms (%)
Bedrooms in owner-occupied houses - 4 bedrooms (%)
Bedrooms in owner-occupied houses - 5+ bedrooms (%)
Bedrooms in renter-occupied houses - no bedrooms (%)
Bedrooms in renter-occupied houses - 1 bedroom (%)
Bedrooms in renter-occupied houses - 2 bedrooms (%)
Bedrooms in renter-occupied houses - 3 bedrooms (%)
Bedrooms in renter-occupied houses - 4 bedrooms (%)
Bedrooms in renter-occupied houses - 5+ bedrooms (%)
Vehicles available in owner-occupied houses - no vehicle available (%)
Vehicles available in owner-occupied houses - 1 vehicle available(%)
Vehicles available in owner-occupied houses - 2 Vehicles available (%)
Vehicles available in owner-occupied houses - 3 Vehicles available (%)
Vehicles available in owner-occupied houses - 4 Vehicles available (%)
Vehicles available in owner-occupied houses - 5+ Vehicles available (%)
Vehicles available in renter-occupied houses - no vehicle available (%)
Vehicles available in renter-occupied houses - 1 vehicle available (%)
Vehicles available in renter-occupied houses - 2 Vehicles available (%)
Vehicles available in renter-occupied houses - 3 Vehicles available (%)
Vehicles available in renter-occupied houses - 4 Vehicles available (%)
Vehicles available in renter-occupied houses - 5+ Vehicles available (%)
Housing units in structures - 1, detached (%)
Housing units in structures - 1, attached (%)
Housing units in structures - 2 (%)
Housing units in structures - 3 or 4 (%)
Housing units in structures - 5 to 9 (%)
Housing units in structures - 10 to 19 (%)
Housing units in structures - 20 to 49 (%)
Housing units in structures - 50 or more (%)
Housing units in structures - Mobile home (%)
Housing units in structures - Boat, RV, van, etc. (%)
Housing units in structures - Owners - 1, detached (%)
Housing units in structures - Owners - 1, attached (%)
Housing units in structures - Owners - 2 (%)
Housing units in structures - Owners - 3 or 4 (%)
Housing units in structures - Owners - 5 to 9 (%)
Housing units in structures - Owners - 10 to 19 (%)
Housing units in structures - Owners - 20 to 49 (%)
Housing units in structures - Owners - 50 or more (%)
Housing units in structures - Owners - Mobile home (%)
Housing units in structures - Owners - Boat, RV, van, etc. (%)
Housing units in structures - Renters - 1, detached (%)
Housing units in structures - Renters - 1, attached (%)
Housing units in structures - Renters - 2 (%)
Housing units in structures - Renters - 3 or 4 (%)
Housing units in structures - Renters - 5 to 9 (%)
Housing units in structures - Renters - 10 to 19 (%)
Housing units in structures - Renters - 20 to 49 (%)
Housing units in structures - Renters - 50 or more (%)
Housing units in structures - Renters - Mobile home (%)
Housing units in structures - Renters - Boat, RV, van, etc. (%)
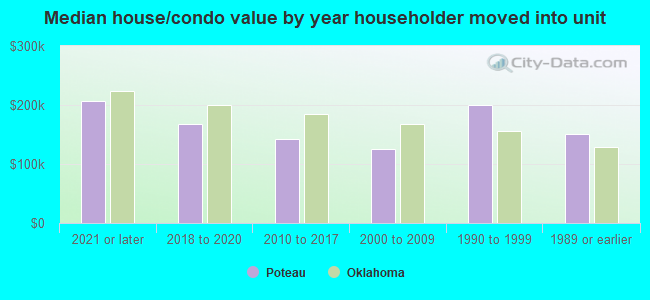
House/condo owner moved in on average (years ago)
Renter moved in on average (years ago)
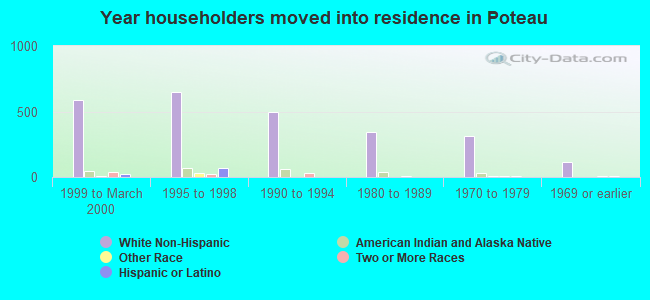
Year householder moved into unit - Moved in 1999 to March 2000 (%)
Year householder moved into unit - Moved in 1999 to March 2000 (%) - White
Year householder moved into unit - Moved in 1999 to March 2000 (%) - Black or African American
Year householder moved into unit - Moved in 1999 to March 2000 (%) - Asian
Year householder moved into unit - Moved in 1999 to March 2000 (%) - Hispanic or Latino
Year householder moved into unit - Moved in 1999 to March 2000 (%) - American Indian and Alaska Native
Year householder moved into unit - Moved in 1999 to March 2000 (%) - Multirace
Year householder moved into unit - Moved in 1999 to March 2000 (%) - Other Race
Year householder moved into unit - Moved in 1995 to 1998 (%)
Year householder moved into unit - Moved in 1995 to 1998 (%) - White
Year householder moved into unit - Moved in 1995 to 1998 (%) - Black or African American
Year householder moved into unit - Moved in 1995 to 1998 (%) - Asian
Year householder moved into unit - Moved in 1995 to 1998 (%) - Hispanic or Latino
Year householder moved into unit - Moved in 1995 to 1998 (%) - American Indian and Alaska Native
Year householder moved into unit - Moved in 1995 to 1998 (%) - Multirace
Year householder moved into unit - Moved in 1995 to 1998 (%) - Other Race
Year householder moved into unit - Moved in 1990 to 1994 (%)
Year householder moved into unit - Moved in 1990 to 1994 (%) - White
Year householder moved into unit - Moved in 1990 to 1994 (%) - Black or African American
Year householder moved into unit - Moved in 1990 to 1994 (%) - Asian
Year householder moved into unit - Moved in 1990 to 1994 (%) - Hispanic or Latino
Year householder moved into unit - Moved in 1990 to 1994 (%) - American Indian and Alaska Native
Year householder moved into unit - Moved in 1990 to 1994 (%) - Multirace
Year householder moved into unit - Moved in 1990 to 1994 (%) - Other Race
Year householder moved into unit - Moved in 1980 to 1989 (%)
Year householder moved into unit - Moved in 1980 to 1989 (%) - White
Year householder moved into unit - Moved in 1980 to 1989 (%) - Black or African American
Year householder moved into unit - Moved in 1980 to 1989 (%) - Asian
Year householder moved into unit - Moved in 1980 to 1989 (%) - Hispanic or Latino
Year householder moved into unit - Moved in 1980 to 1989 (%) - American Indian and Alaska Native
Year householder moved into unit - Moved in 1980 to 1989 (%) - Multirace
Year householder moved into unit - Moved in 1980 to 1989 (%) - Other Race
Year householder moved into unit - Moved in 1970 to 1979 (%)
Year householder moved into unit - Moved in 1970 to 1979 (%) - White
Year householder moved into unit - Moved in 1970 to 1979 (%) - Black or African American
Year householder moved into unit - Moved in 1970 to 1979 (%) - Asian
Year householder moved into unit - Moved in 1970 to 1979 (%) - Hispanic or Latino
Year householder moved into unit - Moved in 1970 to 1979 (%) - American Indian and Alaska Native
Year householder moved into unit - Moved in 1970 to 1979 (%) - Multirace
Year householder moved into unit - Moved in 1970 to 1979 (%) - Other Race
Year householder moved into unit - Moved in 1969 or earlier (%)
Year householder moved into unit - Moved in 1969 or earlier (%) - White
Year householder moved into unit - Moved in 1969 or earlier (%) - Black or African American
Year householder moved into unit - Moved in 1969 or earlier (%) - Asian
Year householder moved into unit - Moved in 1969 or earlier (%) - Hispanic or Latino
Year householder moved into unit - Moved in 1969 or earlier (%) - American Indian and Alaska Native
Year householder moved into unit - Moved in 1969 or earlier (%) - Multirace
Year householder moved into unit - Moved in 1969 or earlier (%) - Other Race
Housing units lacking complete plumbing facilities (%)
Housing units lacking complete kitchen facilities (%)
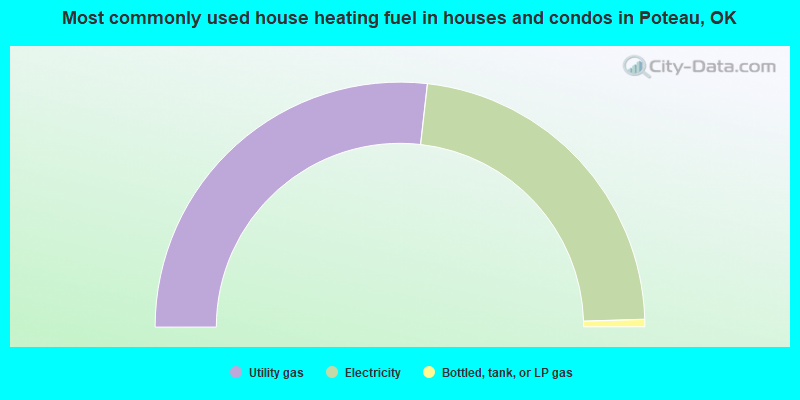
House heating fuel used in houses and condos - Utility gas (%)
House heating fuel used in houses and condos - Bottled, tank, or LP gas (%)
House heating fuel used in houses and condos - Electricity (%)
House heating fuel used in houses and condos - Fuel oil, kerosene, etc. (%)
House heating fuel used in houses and condos - Coal or coke (%)
House heating fuel used in houses and condos - Wood (%)
House heating fuel used in houses and condos - Solar energy (%)
House heating fuel used in houses and condos - Other fuel (%)
House heating fuel used in houses and condos - No fuel used (%)
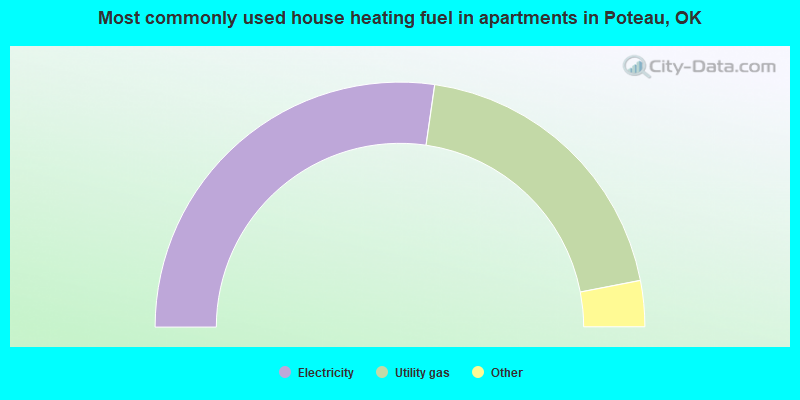
House heating fuel used in apartments - Utility gas (%)
House heating fuel used in apartments - Bottled, tank, or LP gas (%)
House heating fuel used in apartments - Electricity (%)
House heating fuel used in apartments - Fuel oil, kerosene, etc. (%)
House heating fuel used in apartments - Coal or coke (%)
House heating fuel used in apartments - Wood (%)
House heating fuel used in apartments - Solar energy (%)
House heating fuel used in apartments - Other fuel (%)
House heating fuel used in apartments - No fuel used (%)
Latest news about housing in Poteau, OK collected exclusively by city-data.com from local newspapers, TV, and radio stations
Median year house/condo built: 1978Median year apartment built: 1975Household type by relationship:
Households: 8,961
Male householders: 1,626 (539 living alone ), Female householders: 1,553 (392 living alone )1,269 spouses (1,269 opposite-sex spouses ), 256 unmarried partners , (256 opposite-sex unmarried partners ), 2,803 children (2,440 natural , 117 adopted , 245 stepchildren ), 199 grandchildren , 234 brothers or sisters , 227 parents , 48 foster children , 148 other relatives , 202 non-relatives In group quarters: 390
Size of family households: 803 2-persons , 411 3-persons , 517 4-persons , 234 5-persons , 112 6-persons , 43 7-or-more-persons .
Size of nonfamily households: 943 1-person , 140 2-persons , 24 3-persons .
1,041 married couples with children. single-parent households (376 men , 514 women ).
86.8% of residents of Poteau speak English at home. of residents speak Spanish at home (49% speak English very well , 19% speak English well , 18% speak English not well , 14% don't speak English at all ).of residents speak other Indo-European language at home (100% speak English very well ).of residents speak Asian or Pacific Island language at home (22% speak English well , 30% speak English not well , 48% don't speak English at all ).of residents speak other language at home (100% speak English very well ).
Foreign born population: 816 (9.1%)of them are naturalized citizens )
Median number of rooms in houses and condos:
Median number of rooms in apartments
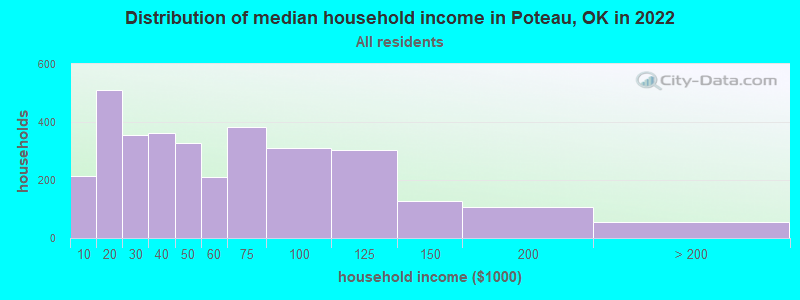
Poteau, OK household income distribution 215 Less than $10,000512 $10,000 to $19,999356 $20,000 to $29,999363 $30,000 to $39,999328 $40,000 to $49,999211 $50,000 to $59,999383 $60,000 to $74,999309 $75,000 to $99,999305 $100,000 to $124,999128 $125,000 to $149,999106 $150,000 to $199,99956 $200,000 or more
Home value of owner - occupied houses in 2022 in Poteau, OK 2 Less than $10,0000 $10,000 to $14,99924 $20,000 to $24,99918 $25,000 to $29,99949 $30,000 to $34,99977 $50,000 to $59,99994 $60,000 to $69,999122 $70,000 to $79,99960 $80,000 to $89,99995 $90,000 to $99,999180 $100,000 to $124,999176 $125,000 to $149,999216 $150,000 to $174,999157 $175,000 to $199,999296 $200,000 to $249,999101 $250,000 to $299,99977 $300,000 to $399,9996 $500,000 to $749,999Rent paid by renters in 2022 in Poteau, OK 54 Less than $1004 $100 to $14946 $150 to $19927 $200 to $24937 $250 to $29930 $300 to $34998 $350 to $39935 $400 to $44993 $450 to $499150 $500 to $549105 $550 to $59990 $600 to $649134 $650 to $69999 $700 to $74968 $750 to $799132 $800 to $89940 $900 to $9991 $1,000 to $1,2499 $2,000 to $2,49962 No cash rent
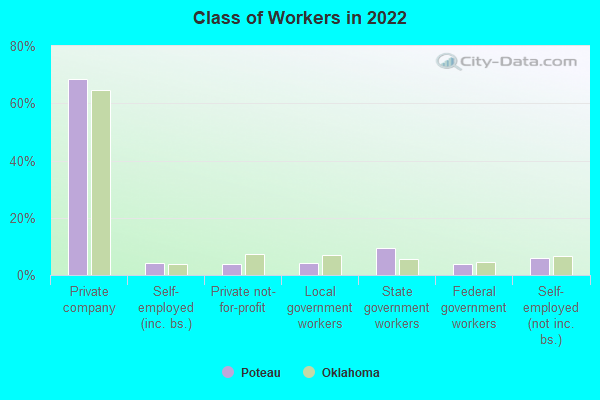
Percentage of workers working in this county: 77.3%Number of people working at home: 181 (5.0% of all workers )
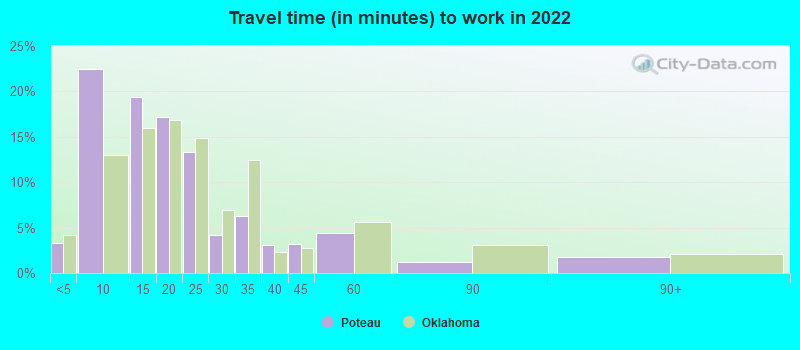
Travel time to work (commute)
Less than 5 minutes: 1675 to 9 minutes: 84110 to 14 minutes: 59315 to 19 minutes: 44320 to 24 minutes: 7725 to 29 minutes: 5030 to 34 minutes: 37035 to 39 minutes: 18140 to 44 minutes: 12445 to 59 minutes: 22360 to 89 minutes: 15090 or more minutes: 193
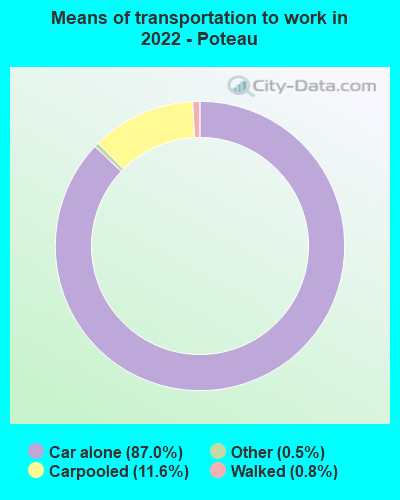
Means of transportation to work:
Drove a car alone: 4,626 (82.8%)Carpooled: 632 (11.3%)Taxi: 22 (0.4%)Bicycle: 1 (0.0%)Walked: 45 (0.8%)Worked at home: 181 (3.2%)
Unemployment by race in 2022
Unemployment rate for White non-Hispanic residents 4.3% Males5.6% FemalesUnemployment rate for Black residents 37.5% FemalesUnemployment rate for American Indian and Alaska Native residents 18.6% FemalesUnemployment rate for two or more race residents 0.5% MalesUnemployment rate for Hispanic or Latino residents 1.9% Males4.8% Females
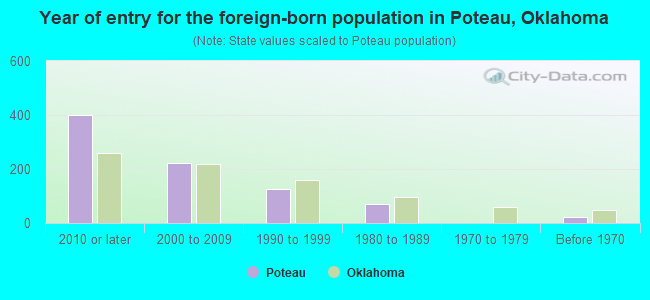
Year of entry for the foreign-born population in Poteau, Oklahoma
401 2010 or later 222 2000 to 2009 127 1990 to 1999 70 1980 to 1989 0 1970 to 1979 21 Before 1970
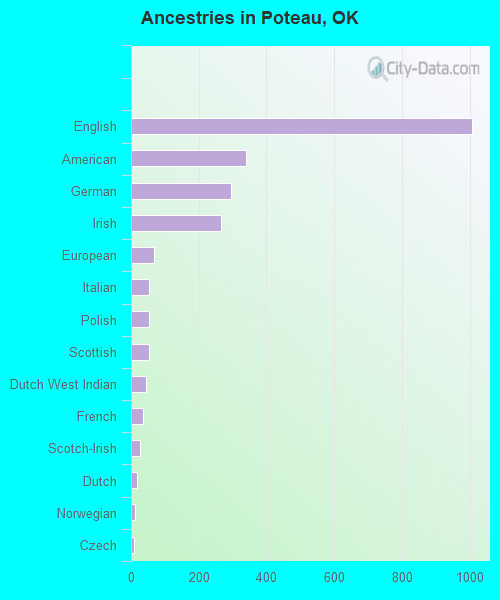
First ancestries reported:
English: 1,007 (20.0%)
American: 339 (6.7%)
German: 294 (5.8%)
Irish: 265 (5.3%)
European: 67 (1.3%)
Italian: 52 (1.0%)
Polish: 52 (1.0%)
Scottish: 52 (1.0%)
Dutch West Indian: 44 (0.9%)
French: 34 (0.7%)
Scotch-Irish: 27 (0.5%)
Dutch: 19 (0.4%)
Norwegian: 13 (0.3%)
Czech: 10 (0.2%)
African: 6 (0.1%) Most common places of birth for foreign-born residents (%): Mexico Poteau:
92.5% (755)Oklahoma:
42.4% (103,425)
Guatemala Poteau:
2.8% (23)Oklahoma:
4.2% (10,287)
Vietnam Poteau:
2.1% (17)Oklahoma:
5.6% (13,699)
Venezuela Poteau:
2.1% (17)Oklahoma:
1.2% (3,010)
Place of birth for U.S.-born residents:
This state: 3,820Other state: 4,279Northeast: 50Midwest: 617South: 2,540West: 1,070 84.2% of Poteau residents lived in the same house 1 years ago.
Out of people who lived in different houses, 37.6% lived in this county.
Out of people who lived in different counties, 31.3% lived in Oklahoma.
Poteau:
84.2%State average:
85.5%
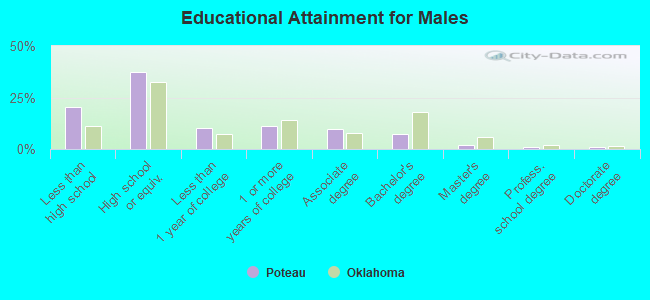
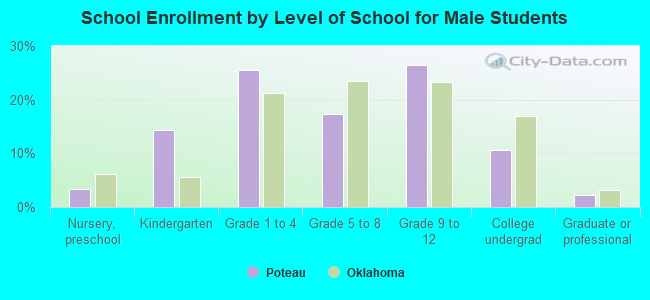
Education attainment for males 25 years and older:
No schooling: 140Nursery to 4th grade: 185th and 6th grade: 537th and 8th grade: 219th grade: 7710th grade: 8211th grade: 10312th grade, no diploma: 123High school graduate (or equivalency): 1,136Less than 1 year of college: 310Some college more than 1 year, no degree: 335Associate degree: 297Bachelor's degree: 224Master's degree: 53Professional school degree: 31Doctorate degree: 30
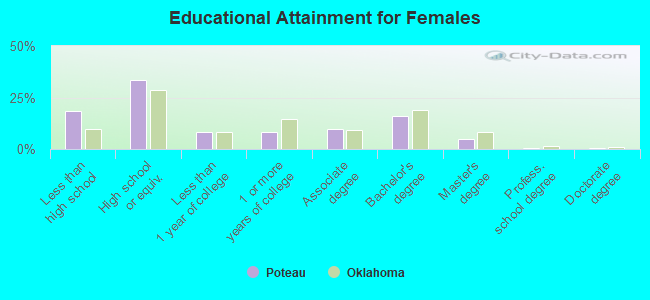
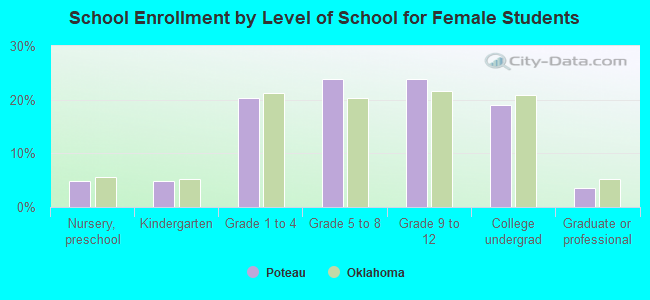
Education attainment for females 25 years and older:
No schooling: 140Nursery to 4th grade: 175th and 6th grade: 517th and 8th grade: 249th grade: 5310th grade: 5411th grade: 6712th grade, no diploma: 104High school graduate (or equivalency): 933Less than 1 year of college: 229Some college more than 1 year, no degree: 229Associate degree: 264Bachelor's degree: 438Master's degree: 139Professional school degree: 12Doctorate degree: 18
Housing units in structures:
One, detached: 2,857One, attached: 21Two: 673 or 4: 865 to 9: 15910 to 19: 2320 to 49: 8150 or more: 13Mobile homes: 323Median worth of mobile homes: $37,213
Housing units lacking complete plumbing facilities in 2022: 2.2%Housing units lacking complete kitchen facilities in 2022: 2.9%House/condo owner moved in on average 8 years ago
Renter moved in on average 3 years ago
Private vs. public school enrollment:
Students in private schools in grades 1 to 8 (elementary and middle school): 53 Students in private schools in grades 9 to 12 (high school): 50 Students in private undergraduate colleges: 60