Roanoke, VA (Virginia) Houses and Residents
Estimated median house or condo value in 2022: $183,400 (it was $80,100 in 2000 )
Roanoke:
$183,400Virginia:
$365,700
Lower value quartile - upper value quartile: $133,000 - $291,200Mean price in 2022: Detached houses: $227,821 Here:
$227,821State:
$472,865
Townhouses or other attached units: $213,150 Here:
$213,150State:
$457,437
In 2-unit structures: $246,865 Here:
$246,865State:
$396,289
In 3-to-4-unit structures: $291,184 Here:
$291,184State:
$252,346
In 5-or-more-unit structures: $287,669 Here:
$287,669State:
$382,551
Mobile homes: $140,099 Here:
$140,099State:
$100,736
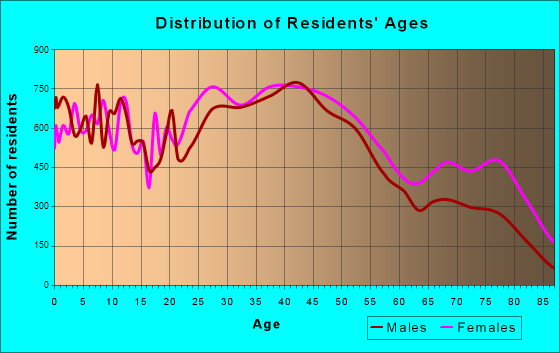
Total population: 99,428 (Urban population: 94,911, Rural population: 0)
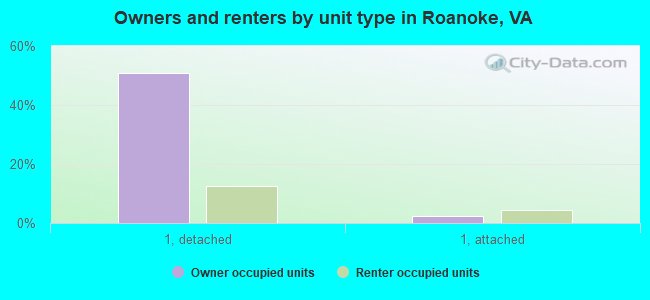
Houses: 49,154 (44,543 occupied: 22,465 owner occupied, 22,078 renter occupied )
% of renters here:
50%State:
33%
Housing density: 1,146 houses/condos per square mile
Median price asked for vacant for-sale houses and condos in 2022: $233,803.
Median contract rent in 2022: $773 (lower quartile is $594, upper quartile is $937)
Median rent asked for vacant for-rent units in 2022: $640
Median gross rent in Roanoke, VA in 2022: $905
Housing units in Roanoke with a mortgage: 14,270 (1,395 second mortgage, 173 home equity loan, 565 both second mortgage and home equity loan )Houses without a mortgage: 1,050
Median household income for houses/condos with a mortgage: $78,134
Median household income for apartments without a mortgage: $63,400
Median monthly housing costs: $921
Data:
Median house or condo value ($)
Median house or condo value ($ change since 2000)
Median house or condo value ($) - White
Median house or condo value ($) - Black or African American
Median house or condo value ($) - Asian
Median house or condo value ($) - Hispanic or Latino
Median house or condo value ($) - American Indian and Alaska Native
Median house or condo value ($) - Multirace
Median house or condo value ($) - Other Race
Median price asked for mobile homes ($)
Household density (households per square mile)
Mean house or condo value by units in structure - 1, detached ($)
Mean house or condo value by units in structure - 1, attached ($)
Mean house or condo value by units in structure - 2 ($)
Mean house or condo value by units in structure by units in structure - 3 or 4 ($)
Mean house or condo value by units in structure - 5 or more ($)
Mean house or condo value by units in structure - Boat, RV, van, etc. ($)
Mean house or condo value by units in structure - Mobile home ($)
Median contract rent ($)
Median contract rent - Lower quartile ($)
Median contract rent - Upper quartile ($)
Median gross rent ($)
Urban houses (%)
Rural houses (%)
Houses occupied (%)
Houses occupied (% change since 2000)
Houses owner occupied (%)
Houses owner occupied (% change since 2000)
Houses renter occupied (%)
Houses renter occupied (% change since 2000)
Vacant housing units - For rent (%)
Vacant housing units - For rent (% change since 2000)
Vacant housing units - For sale only (%)
Vacant housing units - For sale only (% change since 2000)
Vacant housing units - Rented or sold, not occupied (%)
Vacant housing units - Rented or sold, not occupied (% change since 2000)
Vacant housing units - For seasonal, recreational, or occasional use (%)
Vacant housing units - For seasonal, recreational, or occasional use (% change since 2000)
Vacant housing units - For migrant workers (%)
Vacant housing units - For migrant workers (% change since 2000)
Vacant housing units - Other vacant (%)
Vacant housing units - Other vacant (% change since 2000)
Median monthly housing costs ($)
Median household income for houses/condos with a mortgage ($)
Median household income for houses/condos without a mortgage ($)
Median household income ($)
Median household income ($) - White
Median household income ($) - Black or African American
Median household income ($) - Asian
Median household income ($) - Hispanic or Latino
Median household income ($) - American Indian and Alaska Native
Median household income ($) - Multirace
Median household income ($) - Other Race
Mortgage status - with mortgage (%)
Mortgage status - with second mortgage (%)
Mortgage status - with home equity loan (%)
Mortgage status - with both second mortgage and home equity loan (%)
Mortgage status - without a mortgage (%)
Median year house/condo built
Median year apartment built
Household type by relationship - Male householder living alone (%)
Household type by relationship - Male householder not living alone (%)
Household type by relationship - Female householder living alone (%)
Household type by relationship - Female householder not living alone (%)
Household type by relationship - Opposite-Sex spouse (%)
Household type by relationship - Same-Sex spouse (%)
Household type by relationship - Opposite-Sex unmarried partner (%)
Household type by relationship - Same-Sex unmarried partner (%)
Household type by relationship - In group quarters (%)
Size of family households - 2-person household (%)
Size of family households - 3-person household (%)
Size of family households - 4-person household (%)
Size of family households - 5-person household (%)
Size of family households - 6-person household (%)
Size of family households - 7-or-more-person household (%)
Size of nonfamily households - 1-person household (%)
Size of nonfamily households - 2-person household (%)
Size of nonfamily households - 3-person household (%)
Size of nonfamily households - 4-person household (%)
Size of nonfamily households - 5-person household (%)
Size of nonfamily households - 6-person household (%)
Size of nonfamily households - 7-or-moreperson household (%)
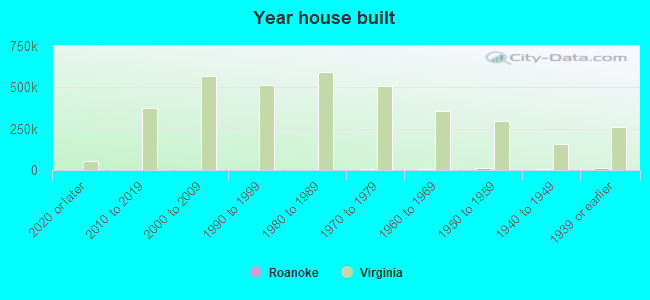
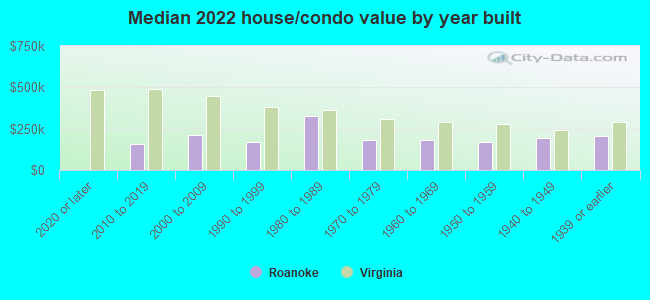
Year house built - Built 2010 or later (%)
Year house built - Built 2000 to 2009 (%)
Year house built - Built 1990 to 1999 (%)
Year house built - Built 1980 to 1989 (%)
Year house built - Built 1970 to 1979 (%)
Year house built - Built 1960 to 1969 (%)
Year house built - Built 1950 to 1959 (%)
Year house built - Built 1940 to 1949 (%)
Year house built - Built 1939 or earlier (%)
Median number of rooms in houses and condos
Median number of rooms in apartments
Median number of bedrooms in owner occupied houses
Mean number of bedrooms in owner occupied houses
Median number of bedrooms in renter occupied houses
Mean number of bedrooms in renter occupied houses
Median number of vehichles in owner occupied houses
Mean number of vehichles in owner occupied houses
Median number of vehichles in renter occupied houses
Mean number of vehichles in renter occupied houses
Rooms in owner-occupied houses - 1 room (%)
Rooms in owner-occupied houses - 2 rooms (%)
Rooms in owner-occupied houses - 3 rooms (%)
Rooms in owner-occupied houses - 4 rooms (%)
Rooms in owner-occupied houses - 5 rooms (%)
Rooms in owner-occupied houses - 6 rooms (%)
Rooms in owner-occupied houses - 7 rooms (%)
Rooms in owner-occupied houses - 8 rooms (%)
Rooms in owner-occupied houses - 9+ rooms (%)
Rooms in renter-occupied houses - 1 room (%)
Rooms in renter-occupied houses - 2 rooms (%)
Rooms in renter-occupied houses - 3 rooms (%)
Rooms in renter-occupied houses - 4 rooms (%)
Rooms in renter-occupied houses - 5 rooms (%)
Rooms in renter-occupied houses - 6 rooms (%)
Rooms in renter-occupied houses - 7 rooms (%)
Rooms in renter-occupied houses - 8 rooms (%)
Rooms in renter-occupied houses - 9+ rooms (%)
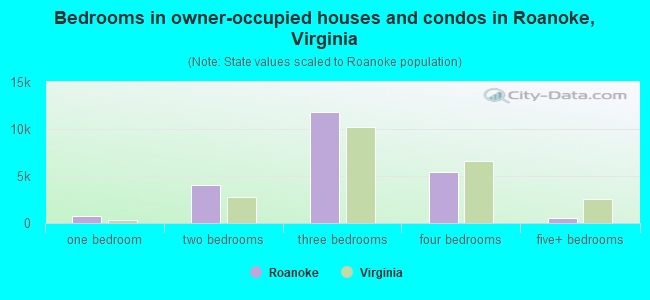
Bedrooms in owner-occupied houses - no bedrooms (%)
Bedrooms in owner-occupied houses - 1 bedroom (%)
Bedrooms in owner-occupied houses - 2 bedrooms (%)
Bedrooms in owner-occupied houses - 3 bedrooms (%)
Bedrooms in owner-occupied houses - 4 bedrooms (%)
Bedrooms in owner-occupied houses - 5+ bedrooms (%)
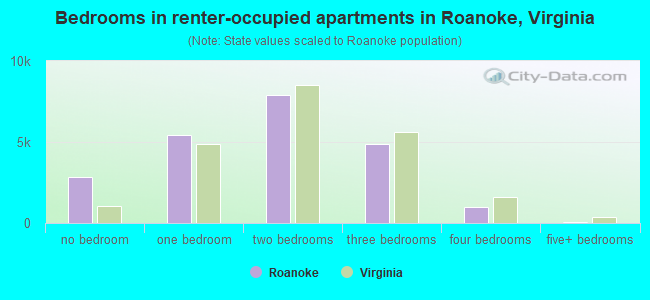
Bedrooms in renter-occupied houses - no bedrooms (%)
Bedrooms in renter-occupied houses - 1 bedroom (%)
Bedrooms in renter-occupied houses - 2 bedrooms (%)
Bedrooms in renter-occupied houses - 3 bedrooms (%)
Bedrooms in renter-occupied houses - 4 bedrooms (%)
Bedrooms in renter-occupied houses - 5+ bedrooms (%)
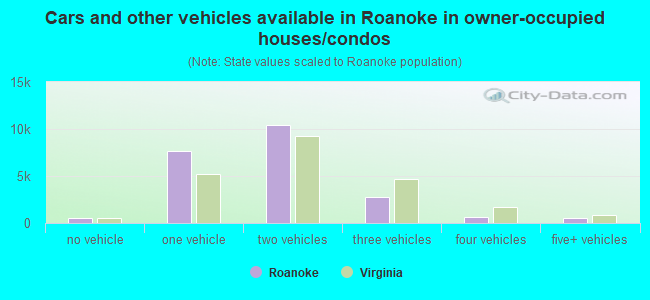
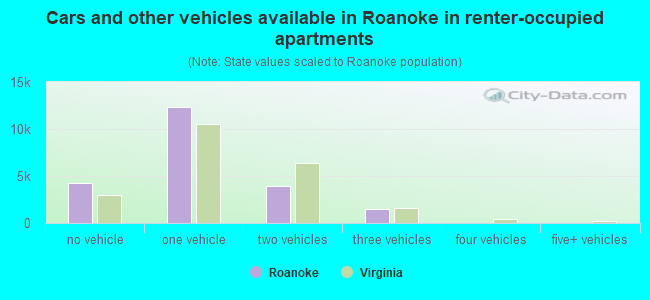
Vehicles available in owner-occupied houses - no vehicle available (%)
Vehicles available in owner-occupied houses - 1 vehicle available(%)
Vehicles available in owner-occupied houses - 2 Vehicles available (%)
Vehicles available in owner-occupied houses - 3 Vehicles available (%)
Vehicles available in owner-occupied houses - 4 Vehicles available (%)
Vehicles available in owner-occupied houses - 5+ Vehicles available (%)
Vehicles available in renter-occupied houses - no vehicle available (%)
Vehicles available in renter-occupied houses - 1 vehicle available (%)
Vehicles available in renter-occupied houses - 2 Vehicles available (%)
Vehicles available in renter-occupied houses - 3 Vehicles available (%)
Vehicles available in renter-occupied houses - 4 Vehicles available (%)
Vehicles available in renter-occupied houses - 5+ Vehicles available (%)
Housing units in structures - 1, detached (%)
Housing units in structures - 1, attached (%)
Housing units in structures - 2 (%)
Housing units in structures - 3 or 4 (%)
Housing units in structures - 5 to 9 (%)
Housing units in structures - 10 to 19 (%)
Housing units in structures - 20 to 49 (%)
Housing units in structures - 50 or more (%)
Housing units in structures - Mobile home (%)
Housing units in structures - Boat, RV, van, etc. (%)
Housing units in structures - Owners - 1, detached (%)
Housing units in structures - Owners - 1, attached (%)
Housing units in structures - Owners - 2 (%)
Housing units in structures - Owners - 3 or 4 (%)
Housing units in structures - Owners - 5 to 9 (%)
Housing units in structures - Owners - 10 to 19 (%)
Housing units in structures - Owners - 20 to 49 (%)
Housing units in structures - Owners - 50 or more (%)
Housing units in structures - Owners - Mobile home (%)
Housing units in structures - Owners - Boat, RV, van, etc. (%)
Housing units in structures - Renters - 1, detached (%)
Housing units in structures - Renters - 1, attached (%)
Housing units in structures - Renters - 2 (%)
Housing units in structures - Renters - 3 or 4 (%)
Housing units in structures - Renters - 5 to 9 (%)
Housing units in structures - Renters - 10 to 19 (%)
Housing units in structures - Renters - 20 to 49 (%)
Housing units in structures - Renters - 50 or more (%)
Housing units in structures - Renters - Mobile home (%)
Housing units in structures - Renters - Boat, RV, van, etc. (%)
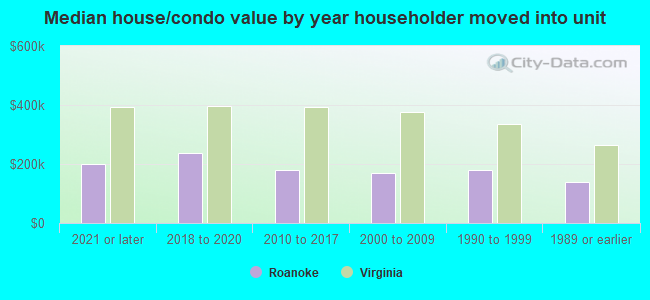
House/condo owner moved in on average (years ago)
Renter moved in on average (years ago)
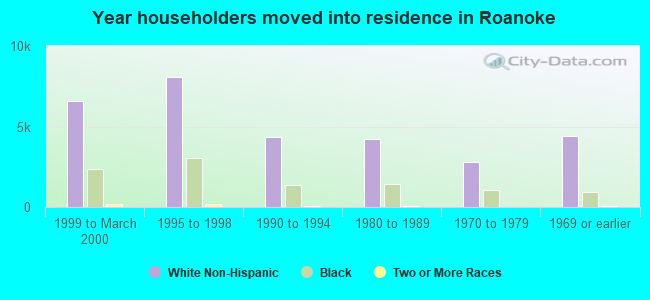
Year householder moved into unit - Moved in 1999 to March 2000 (%)
Year householder moved into unit - Moved in 1999 to March 2000 (%) - White
Year householder moved into unit - Moved in 1999 to March 2000 (%) - Black or African American
Year householder moved into unit - Moved in 1999 to March 2000 (%) - Asian
Year householder moved into unit - Moved in 1999 to March 2000 (%) - Hispanic or Latino
Year householder moved into unit - Moved in 1999 to March 2000 (%) - American Indian and Alaska Native
Year householder moved into unit - Moved in 1999 to March 2000 (%) - Multirace
Year householder moved into unit - Moved in 1999 to March 2000 (%) - Other Race
Year householder moved into unit - Moved in 1995 to 1998 (%)
Year householder moved into unit - Moved in 1995 to 1998 (%) - White
Year householder moved into unit - Moved in 1995 to 1998 (%) - Black or African American
Year householder moved into unit - Moved in 1995 to 1998 (%) - Asian
Year householder moved into unit - Moved in 1995 to 1998 (%) - Hispanic or Latino
Year householder moved into unit - Moved in 1995 to 1998 (%) - American Indian and Alaska Native
Year householder moved into unit - Moved in 1995 to 1998 (%) - Multirace
Year householder moved into unit - Moved in 1995 to 1998 (%) - Other Race
Year householder moved into unit - Moved in 1990 to 1994 (%)
Year householder moved into unit - Moved in 1990 to 1994 (%) - White
Year householder moved into unit - Moved in 1990 to 1994 (%) - Black or African American
Year householder moved into unit - Moved in 1990 to 1994 (%) - Asian
Year householder moved into unit - Moved in 1990 to 1994 (%) - Hispanic or Latino
Year householder moved into unit - Moved in 1990 to 1994 (%) - American Indian and Alaska Native
Year householder moved into unit - Moved in 1990 to 1994 (%) - Multirace
Year householder moved into unit - Moved in 1990 to 1994 (%) - Other Race
Year householder moved into unit - Moved in 1980 to 1989 (%)
Year householder moved into unit - Moved in 1980 to 1989 (%) - White
Year householder moved into unit - Moved in 1980 to 1989 (%) - Black or African American
Year householder moved into unit - Moved in 1980 to 1989 (%) - Asian
Year householder moved into unit - Moved in 1980 to 1989 (%) - Hispanic or Latino
Year householder moved into unit - Moved in 1980 to 1989 (%) - American Indian and Alaska Native
Year householder moved into unit - Moved in 1980 to 1989 (%) - Multirace
Year householder moved into unit - Moved in 1980 to 1989 (%) - Other Race
Year householder moved into unit - Moved in 1970 to 1979 (%)
Year householder moved into unit - Moved in 1970 to 1979 (%) - White
Year householder moved into unit - Moved in 1970 to 1979 (%) - Black or African American
Year householder moved into unit - Moved in 1970 to 1979 (%) - Asian
Year householder moved into unit - Moved in 1970 to 1979 (%) - Hispanic or Latino
Year householder moved into unit - Moved in 1970 to 1979 (%) - American Indian and Alaska Native
Year householder moved into unit - Moved in 1970 to 1979 (%) - Multirace
Year householder moved into unit - Moved in 1970 to 1979 (%) - Other Race
Year householder moved into unit - Moved in 1969 or earlier (%)
Year householder moved into unit - Moved in 1969 or earlier (%) - White
Year householder moved into unit - Moved in 1969 or earlier (%) - Black or African American
Year householder moved into unit - Moved in 1969 or earlier (%) - Asian
Year householder moved into unit - Moved in 1969 or earlier (%) - Hispanic or Latino
Year householder moved into unit - Moved in 1969 or earlier (%) - American Indian and Alaska Native
Year householder moved into unit - Moved in 1969 or earlier (%) - Multirace
Year householder moved into unit - Moved in 1969 or earlier (%) - Other Race
Housing units lacking complete plumbing facilities (%)
Housing units lacking complete kitchen facilities (%)
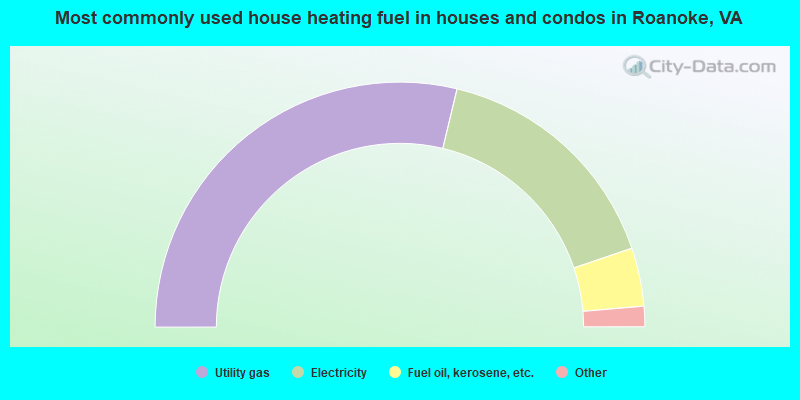
House heating fuel used in houses and condos - Utility gas (%)
House heating fuel used in houses and condos - Bottled, tank, or LP gas (%)
House heating fuel used in houses and condos - Electricity (%)
House heating fuel used in houses and condos - Fuel oil, kerosene, etc. (%)
House heating fuel used in houses and condos - Coal or coke (%)
House heating fuel used in houses and condos - Wood (%)
House heating fuel used in houses and condos - Solar energy (%)
House heating fuel used in houses and condos - Other fuel (%)
House heating fuel used in houses and condos - No fuel used (%)
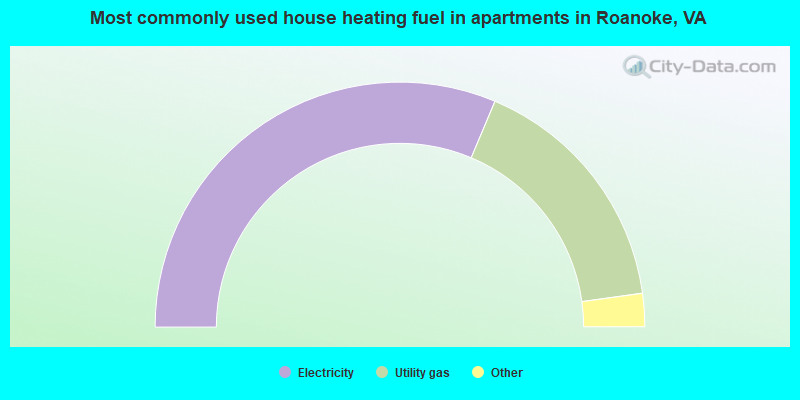
House heating fuel used in apartments - Utility gas (%)
House heating fuel used in apartments - Bottled, tank, or LP gas (%)
House heating fuel used in apartments - Electricity (%)
House heating fuel used in apartments - Fuel oil, kerosene, etc. (%)
House heating fuel used in apartments - Coal or coke (%)
House heating fuel used in apartments - Wood (%)
House heating fuel used in apartments - Solar energy (%)
House heating fuel used in apartments - Other fuel (%)
House heating fuel used in apartments - No fuel used (%)
Latest news about housing in Roanoke, VA collected exclusively by city-data.com from local newspapers, TV, and radio stations
Median year house/condo built: 1955Median year apartment built: 1963Household type by relationship:
Households: 97,847
Male householders: 19,599 (8,427 living alone ), Female householders: 24,944 (10,607 living alone )12,362 spouses (12,094 opposite-sex spouses ), 4,294 unmarried partners , (3,958 opposite-sex unmarried partners ), 27,110 children (24,799 natural , 976 adopted , 1,335 stepchildren ), 1,960 grandchildren , 772 brothers or sisters , 1,058 parents , 93 foster children , 1,549 other relatives , 2,537 non-relatives In group quarters: 1,569
Size of family households: 11,102 2-persons , 5,314 3-persons , 2,935 4-persons , 1,748 5-persons , 418 6-persons , 352 7-or-more-persons .
Size of nonfamily households: 19,034 1-person , 3,236 2-persons , 290 3-persons , 77 4-persons , 37 5-persons .
8,891 married couples with children. single-parent households (1,986 men , 8,599 women ).
90.1% of residents of Roanoke speak English at home. of residents speak Spanish at home (61% speak English very well , 8% speak English well , 23% speak English not well , 8% don't speak English at all ).of residents speak other Indo-European language at home (59% speak English very well , 33% speak English well , 4% speak English not well , 4% don't speak English at all ).of residents speak Asian or Pacific Island language at home (69% speak English very well , 26% speak English well , 4% speak English not well , 1% don't speak English at all ).of residents speak other language at home (54% speak English very well , 38% speak English well , 8% speak English not well ).
Foreign born population: 8,891 (9.1%)of them are naturalized citizens )
Median number of rooms in houses and condos:
Median number of rooms in apartments
Owner-occupied Renter-occupied
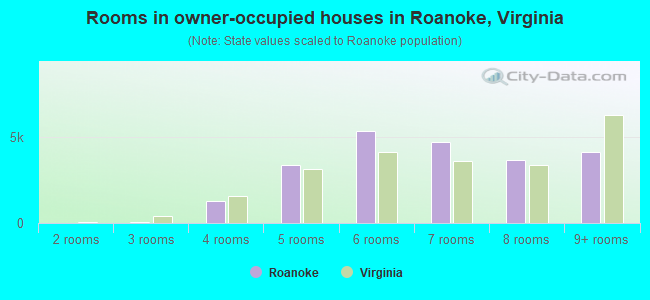
Rooms in owner-occupied houses in Roanoke, Virginia
0 1 room 0 2 rooms 56 3 rooms 1,291 4 rooms 3,336 5 rooms 5,336 6 rooms 4,679 7 rooms 3,650 8 rooms 4,117 9+ rooms
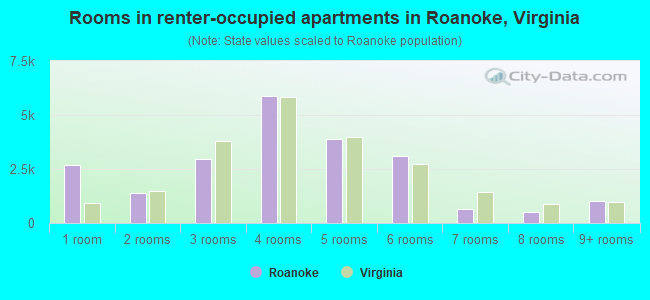
Rooms in renter-occupied apartments in Roanoke, Virginia
2,667 1 room 1,399 2 rooms 2,970 3 rooms 5,872 4 rooms 3,906 5 rooms 3,114 6 rooms 633 7 rooms 516 8 rooms 1,001 9+ rooms
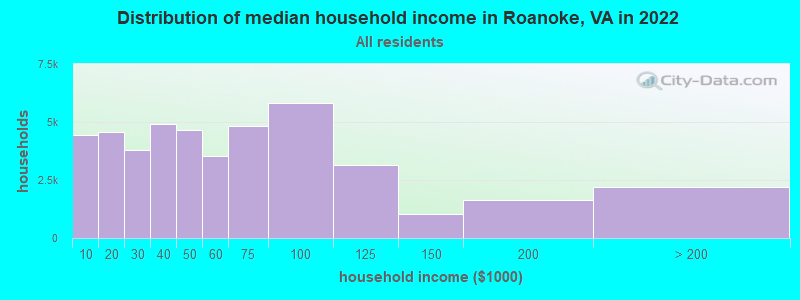
Roanoke, VA household income distribution 4,430 Less than $10,0004,572 $10,000 to $19,9993,811 $20,000 to $29,9994,924 $30,000 to $39,9994,650 $40,000 to $49,9993,532 $50,000 to $59,9994,816 $60,000 to $74,9995,807 $75,000 to $99,9993,152 $100,000 to $124,9991,036 $125,000 to $149,9991,627 $150,000 to $199,9992,186 $200,000 or more
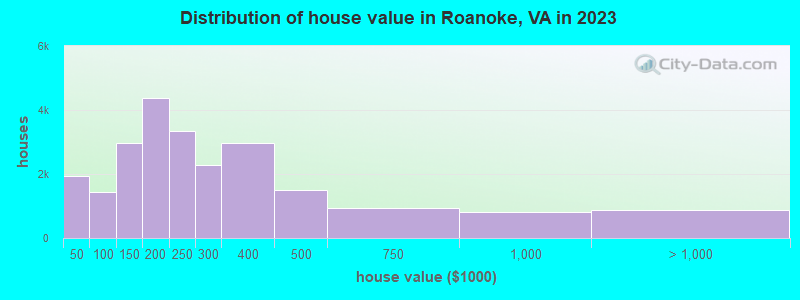
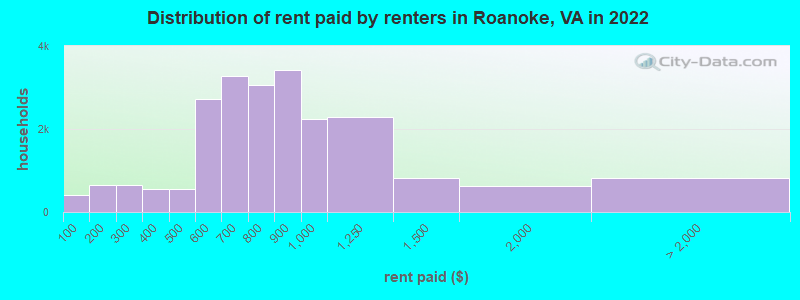
Home value of owner - occupied houses in 2022 in Roanoke, VA 277 Less than $10,00073 $15,000 to $19,999109 $25,000 to $29,999142 $30,000 to $34,99956 $40,000 to $49,999243 $60,000 to $69,999622 $70,000 to $79,999717 $80,000 to $89,999612 $90,000 to $99,9992,029 $100,000 to $124,9992,289 $125,000 to $149,9993,367 $150,000 to $174,9992,077 $175,000 to $199,9993,112 $200,000 to $249,9991,364 $250,000 to $299,9992,549 $300,000 to $399,999470 $400,000 to $499,9991,123 $500,000 to $749,999891 $750,000 to $999,999343 $1,000,000 to $1,499,999Rent paid by renters in 2022 in Roanoke, VA 405 Less than $100152 $100 to $149488 $150 to $199280 $200 to $249372 $250 to $299285 $300 to $349276 $350 to $399268 $400 to $449292 $450 to $4991,333 $500 to $5491,382 $550 to $5991,358 $600 to $6491,913 $650 to $699978 $700 to $7492,075 $750 to $7993,428 $800 to $8992,235 $900 to $9992,291 $1,000 to $1,249821 $1,250 to $1,499636 $1,500 to $1,999111 $2,000 to $2,499115 $3,500 or more584 No cash rent
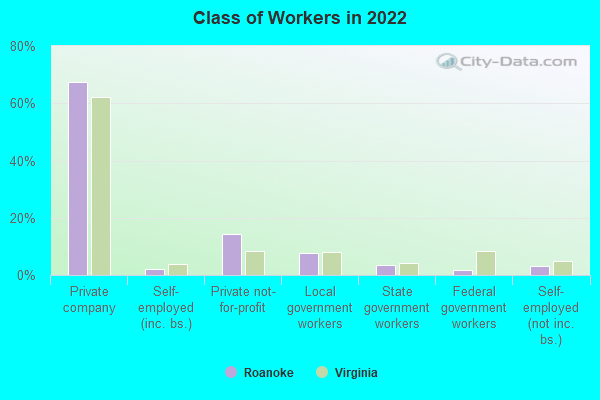
Percentage of workers working in this county: 69.2%Number of people working at home: 5,953 (12.7% of all workers )
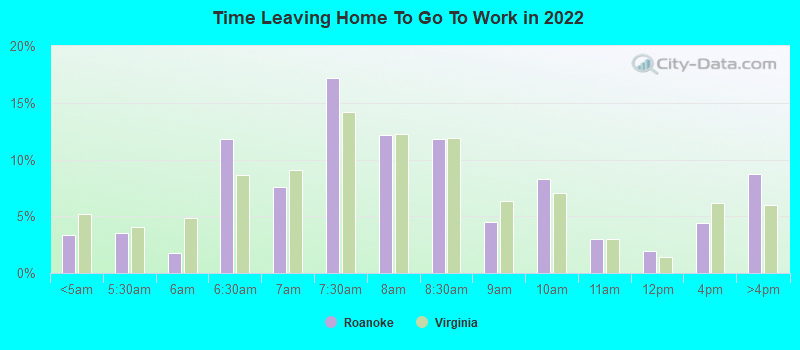
Travel time to work (commute)
Less than 5 minutes: 1,1415 to 9 minutes: 3,95410 to 14 minutes: 7,92815 to 19 minutes: 10,93020 to 24 minutes: 7,81225 to 29 minutes: 1,25930 to 34 minutes: 1,72435 to 39 minutes: 67740 to 44 minutes: 62145 to 59 minutes: 1,28960 to 89 minutes: 61690 or more minutes: 520
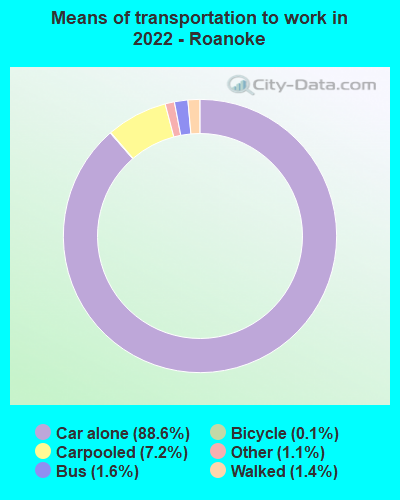
Means of transportation to work:
Drove a car alone: 55,958 (78.9%)Carpooled: 4,615 (6.5%)Bus : 726 (1.0%)Light rail, streetcar or trolley : 2 (0.0%)Taxi: 817 (1.2%)Bicycle: 74 (0.1%)Walked: 954 (1.3%)Worked at home: 5,953 (8.4%)
Unemployment by race in 2022
Unemployment rate for White non-Hispanic residents 3.0% Males4.2% FemalesUnemployment rate for Black residents 12.0% Males8.6% FemalesUnemployment rate for Asian residents 7.2% Males9.2% FemalesUnemployment rate for other race residents 5.0% Males12.1% FemalesUnemployment rate for two or more race residents 0.5% Males5.4% FemalesUnemployment rate for Hispanic or Latino residents 6.5% Males15.4% Females
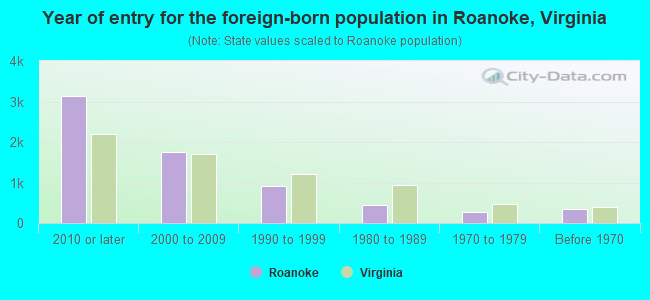
Year of entry for the foreign-born population in Roanoke, Virginia
3,125 2010 or later 1,752 2000 to 2009 913 1990 to 1999 453 1980 to 1989 281 1970 to 1979 347 Before 1970
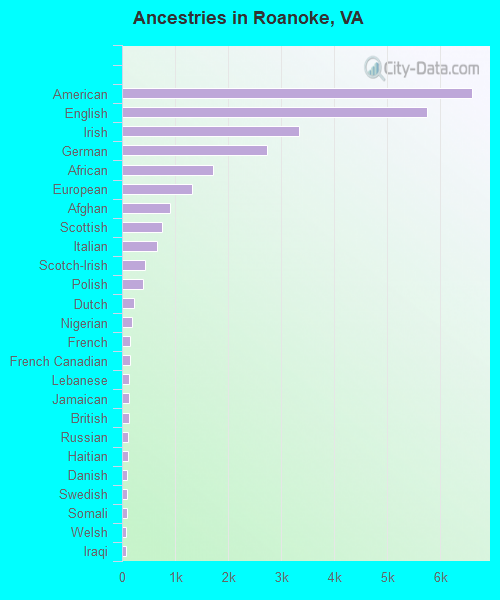
First ancestries reported:
American: 6,588 (12.3%)
English: 5,755 (10.8%)
Irish: 3,330 (6.2%)
German: 2,739 (5.1%)
African: 1,707 (3.2%)
European: 1,318 (2.5%)
Afghan: 912 (1.7%)
Scottish: 749 (1.4%)
Italian: 659 (1.2%)
Scotch-Irish: 425 (0.8%)
Polish: 397 (0.7%)
Dutch: 219 (0.4%)
Nigerian: 192 (0.4%)
French: 157 (0.3%)
French Canadian: 142 (0.3%)
Lebanese: 138 (0.3%)
Jamaican: 135 (0.3%)
British: 134 (0.3%)
Russian: 117 (0.2%)
Haitian: 105 (0.2%)
Danish: 99 (0.2%)
Swedish: 93 (0.2%)
Somali: 91 (0.2%)
Welsh: 84 (0.2%)
Iraqi: 79 (0.1%)
Ghanaian: 73 (0.1%)
Sierra Leonean: 68 (0.1%)
Eastern European: 58 (0.1%)
Romanian: 55 (0.1%)
South African: 53 (0.10%)
Egyptian: 47 (0.09%)
Canadian: 45 (0.08%)
Norwegian: 39 (0.07%)
Greek: 38 (0.07%)
Austrian: 37 (0.07%)
Hungarian: 33 (0.06%)
Northern European: 32 (0.06%)
Armenian: 31 (0.06%)
Arab: 30 (0.06%)
Palestinian: 29 (0.05%)
Yugoslavian: 29 (0.05%)
Sudanese: 24 (0.04%)
Czech: 22 (0.04%)
Scandinavian: 18 (0.03%)
Brazilian: 14 (0.03%)
Slavic: 13 (0.02%)
Latvian: 12 (0.02%)
Iranian: 10 (0.02%)
U.S. Virgin Islander: 10 (0.02%)
Croatian: 9 (0.02%)
Slovak: 7 (0.01%)
Turkish: 7 (0.01%)
Lithuanian: 4 (0.01%)
Most common places of birth for foreign-born residents (%): Afghanistan Roanoke:
14.3% (998)Virginia:
1.8% (19,426)
Honduras Roanoke:
12.2% (852)Virginia:
3.0% (32,892)
Mexico Roanoke:
9.9% (689)Virginia:
5.3% (57,498)
China, excluding Hong Kong and Taiwan Roanoke:
6.8% (476)Virginia:
3.9% (42,989)
Congo Roanoke:
5.2% (360)Virginia:
0.1% (843)
Korea Roanoke:
4.8% (333)Virginia:
4.9% (52,857)
Cuba Roanoke:
4.2% (295)Virginia:
0.5% (5,899)
Philippines Roanoke:
3.9% (274)Virginia:
4.8% (52,629)
Dominican Republic Roanoke:
3.8% (264)Virginia:
0.6% (6,698)
Vietnam Roanoke:
3.5% (244)Virginia:
4.2% (45,750)
Japan Roanoke:
2.8% (192)Virginia:
0.8% (8,805)
Colombia Roanoke:
2.5% (175)Virginia:
1.3% (14,435)
Sierra Leone Roanoke:
2.5% (173)Virginia:
0.6% (6,458)
India Roanoke:
2.3% (162)Virginia:
9.0% (97,830)
Pakistan Roanoke:
2.2% (153)Virginia:
2.3% (24,582)
Guatemala Roanoke:
1.9% (134)Virginia:
3.3% (35,938)
Haiti Roanoke:
1.8% (126)Virginia:
0.4% (4,246)
Place of birth for U.S.-born residents:
This state: 60,992Other state: 27,387Northeast: 8,252Midwest: 4,101South: 12,681West: 2,353 86.3% of Roanoke residents lived in the same house 1 years ago.
Out of people who lived in different houses, 31.8% lived in this county.
Out of people who lived in different counties, 65.9% lived in Virginia.
Roanoke:
86.3%State average:
86.6%
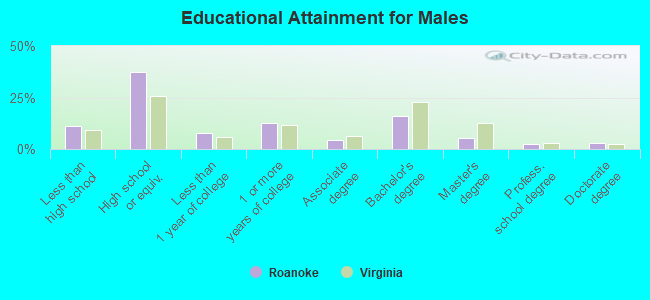
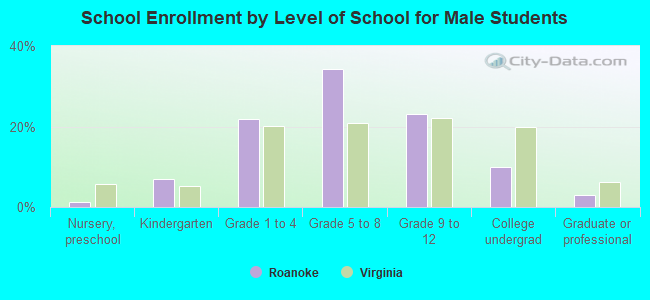
Education attainment for males 25 years and older:
No schooling: 1,322Nursery to 4th grade: 05th and 6th grade: 877th and 8th grade: 6509th grade: 22210th grade: 36111th grade: 27612th grade, no diploma: 604High school graduate (or equivalency): 11,874Less than 1 year of college: 2,463Some college more than 1 year, no degree: 4,001Associate degree: 1,419Bachelor's degree: 5,005Master's degree: 1,687Professional school degree: 798Doctorate degree: 897
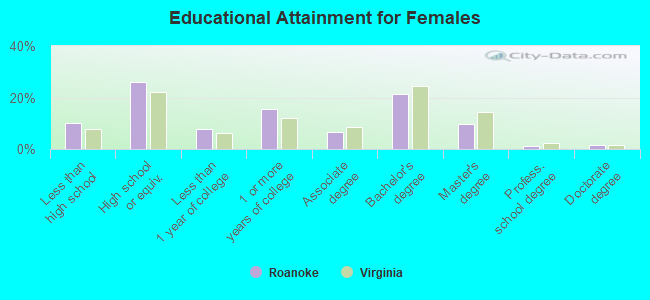
Education attainment for females 25 years and older:
No schooling: 813Nursery to 4th grade: 585th and 6th grade: 447th and 8th grade: 3039th grade: 28110th grade: 70211th grade: 1,02112th grade, no diploma: 513High school graduate (or equivalency): 9,417Less than 1 year of college: 2,781Some college more than 1 year, no degree: 5,646Associate degree: 2,356Bachelor's degree: 7,753Master's degree: 3,560Professional school degree: 488Doctorate degree: 623
Housing units in structures:
One, detached: 28,506One, attached: 1,856Two: 4,3613 or 4: 2,1395 to 9: 3,55510 to 19: 3,53120 to 49: 1,96150 or more: 2,643Mobile homes: 602Housing units lacking complete plumbing facilities in 2022: 1.7%Housing units lacking complete kitchen facilities in 2022: 1.4%House/condo owner moved in on average 13 years ago
Renter moved in on average 3 years ago
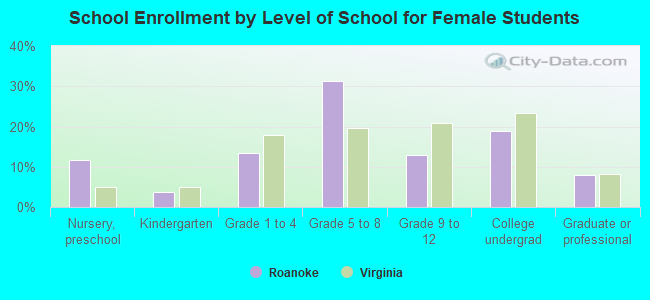
Private vs. public school enrollment:
Students in private schools in grades 1 to 8 (elementary and middle school): 1,560 Students in private schools in grades 9 to 12 (high school): 211 Students in private undergraduate colleges: 850