Rockport, MA (Massachusetts) Houses and Residents
| Rockport: | $702,103 |
| Massachusetts: | $534,700 |
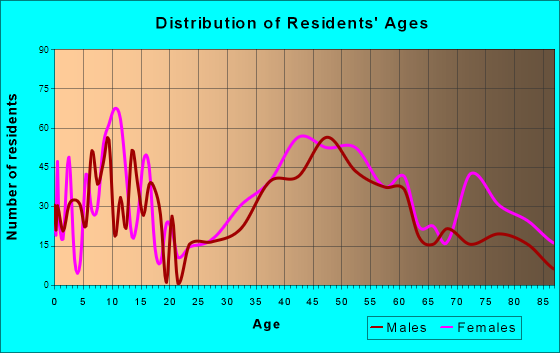
Total population: 4,966 (All urban)
Houses: 3,212 (2,395 occupied: 1,605 owner occupied, 797 renter occupied)
| % of renters here: | 33% |
| State: | 38% |
Housing density: 804 houses/condos per square mile
Median price asked for vacant for-sale houses and condos in 2022: $2,544,598.
Median contract rent in 2022: $1,697 (lower quartile is $879, upper quartile is $1,957)
Median rent asked for vacant for-rent units in 2022: $6,105
Median gross rent in Rockport, MA in 2022: $1,835
Housing units in Rockport with a mortgage: 846 (141 second mortgage, 0 home equity loan, 143 both second mortgage and home equity loan)
Houses without a mortgage: 144
Median household income for houses/condos with a mortgage: $133,530
Median household income for apartments without a mortgage: $84,262
Median monthly housing costs: $1,719
Compare current foreclosures near Rockport, MA:
| Photo | Address | Area | Beds / Baths | Price | Details |
|---|---|---|---|---|---|

|
#1
Whale Cove Rd
Rockport, MA 01966
|
- sq. feet
|
3 baths 3 beds |
$1,496,250
|
show details |

|
#2
Curtis St
Rockport, MA 01966
|
1,500 sq. feet
|
1 baths 3 beds |
show details | |

|
#3
Gap Head Rd
Rockport, MA 01966
|
4,266 sq. feet
|
4 baths 7 beds |
show details | |

|
#4
1/2 Pleasant St
Rockport, MA 01966
|
- sq. feet
|
- baths - beds |
show details | |

|
#5
Highview Rd
Rockport, MA 01966
|
- sq. feet
|
- baths - beds |
show details | |

|
#6
Naugus Ave
Marblehead, MA 01945
|
1,544 sq. feet
|
1 baths 3 beds |
show details | |

|
#7
Mill River Ln
Rowley, MA 01969
|
2,705 sq. feet
|
2 baths 4 beds |
show details | |

|
#8
Holly St
Gloucester, MA 01930
|
1,416 sq. feet
|
1 baths 3 beds |
show details | |

|
#9
Sycamore St
Danvers, MA 01923
|
1,056 sq. feet
|
1 baths 3 beds |
show details | |

|
#10
Front St
Beverly, MA 01915
|
2,886 sq. feet
|
2 baths 4 beds |
show details |
| Photo | Address | Area | Beds / Baths | Price | Details |
|---|---|---|---|---|---|

|
#11
Walden St
Beverly, MA 01915
|
1,854 sq. feet
|
2 baths 4 beds |
show details | |

|
#12
Story Ave
Beverly, MA 01915
|
1,348 sq. feet
|
2 baths 2 beds |
show details | |

|
#13
Wenham St
Danvers, MA 01923
|
2,303 sq. feet
|
2 baths 3 beds |
show details | |

|
#14
64th St
Newburyport, MA 01950
|
1,517 sq. feet
|
2 baths 2 beds |
show details | |

|
#15
Swan St
Amesbury, MA 01913
|
1,940 sq. feet
|
1 baths 3 beds |
show details | |

|
#16
Cabot St
Beverly, MA 01915
|
1,697 sq. feet
|
1 baths 2 beds |
show details | |

|
#17
Sonning Rd
Beverly, MA 01915
|
1,365 sq. feet
|
2 baths 3 beds |
show details | |

|
#18
Chase St
Beverly, MA 01915
|
1,407 sq. feet
|
1 baths 3 beds |
show details | |

|
#19
Knights Ct
Newbury, MA 01951
|
4,057 sq. feet
|
3 baths 5 beds |
show details | |

|
#20
Linebrook Rd
Ipswich, MA 01938
|
901 sq. feet
|
1 baths 1 beds |
show details |
| Photo | Address | Area | Beds / Baths | Price | Details |
|---|---|---|---|---|---|

|
#21
Naugus Ave
Marblehead, MA 01945
|
1,716 sq. feet
|
1 baths 3 beds |
show details | |

|
#22
Frost Ln
Marblehead, MA 01945
|
1,261 sq. feet
|
1 baths 2 beds |
show details | |

|
#23
Farnham Rd
Rowley, MA 01969
|
1,106 sq. feet
|
2 baths 3 beds |
show details | |

|
#24
Radcliffe Rd
Beverly, MA 01915
|
1,494 sq. feet
|
1 baths 3 beds |
show details | |

|
#25
Radcliffe Rd
Beverly, MA 01915
|
1,798 sq. feet
|
2 baths 3 beds |
show details | |

|
#26
Gardner St
Beverly, MA 01915
|
1,534 sq. feet
|
1 baths 2 beds |
show details | |

|
#27
Village St
Marblehead, MA 01945
|
2,006 sq. feet
|
2 baths 4 beds |
show details | |

|
#28
Pearl St
Salem, MA 01970
|
1,832 sq. feet
|
2 baths 2 beds |
show details | |

|
#29
Village St # 1
Marblehead, MA 01945
|
894 sq. feet
|
1 baths 2 beds |
show details | |

|
#30
Birch Rd
Wenham, MA 01984
|
2,558 sq. feet
|
2 baths 4 beds |
show details |
| Photo | Address | Area | Beds / Baths | Price | Details |
|---|---|---|---|---|---|

|
#31
Baldwin Rd
Danvers, MA 01923
|
958 sq. feet
|
1 baths 2 beds |
show details | |

|
#32
Burley St
Danvers, MA 01923
|
3,180 sq. feet
|
2 baths 4 beds |
show details | |

|
#33
Burley St
Danvers, MA 01923
|
1,280 sq. feet
|
1 baths 2 beds |
show details | |

|
#34
Brown St Apt 5
Salem, MA 01970
|
325 sq. feet
|
1 baths 1 beds |
show details | |

|
#35
Orchard Ter
Salem, MA 01970
|
1,519 sq. feet
|
2 baths 2 beds |
show details | |

|
#36
Lothrop St
Beverly, MA 01915
|
1,918 sq. feet
|
1 baths 3 beds |
show details | |

|
#37
Northern Blvd
Newburyport, MA 01950
|
805 sq. feet
|
1 baths 2 beds |
show details | |

|
#38
Lawrence Rd Un 22
Rowley, MA 01969
|
720 sq. feet
|
1 baths 1 beds |
show details | |

|
#39
Essex Rd Unit 10
Ipswich, MA 01938
|
1,992 sq. feet
|
2 baths 3 beds |
show details | |

|
#40
Thatcher Rd
Gloucester, MA 01930
|
2,824 sq. feet
|
2 baths 2 beds |
show details |
| Photo | Address | Area | Beds / Baths | Price | Details |
|---|---|---|---|---|---|

|
#41
Old Farm Ln
Gloucester, MA 01930
|
2,162 sq. feet
|
3 baths 5 beds |
show details | |

|
#42
Hartz St
Gloucester, MA 01930
|
1,562 sq. feet
|
1 baths 4 beds |
show details | |

|
#43
Perkins St
Gloucester, MA 01930
|
1,105 sq. feet
|
1 baths 4 beds |
show details | |

|
#44
Burnham St
Gloucester, MA 01930
|
1,152 sq. feet
|
2 baths 3 beds |
show details | |

|
#45
Ellery St
Gloucester, MA 01930
|
3,140 sq. feet
|
2 baths 3 beds |
show details | |

|
#46
Willow St
Gloucester, MA 01930
|
1,698 sq. feet
|
1 baths 3 beds |
show details | |

|
#47
Washington St Apt 4
Gloucester, MA 01930
|
778 sq. feet
|
1 baths 2 beds |
show details | |

|
#48
Brooks Rd
Gloucester, MA 01930
|
1,149 sq. feet
|
1 baths 2 beds |
show details | |

|
#49
W Parish Ln
Boxford, MA 01921
|
2,638 sq. feet
|
2 baths 3 beds |
show details | |

|
Check over 1 million property listings on Foreclosure.com!
|
browse all offers | |||

Latest news about housing in Rockport, MA collected exclusively by city-data.com from local newspapers, TV, and radio stations

 | How Much Massachusetts Households Make Per Year: Census Data (37 replies) |
| Rockport, Plymouth and Newburyport (28 replies) |
| Seniors downsizing to Apartment (23 replies) |
| towns that offer the most jobs per dollar of house (58 replies) |
| Towns within 495 with nice walkable downtowns and good schools (205 replies) |
| Pick a New England place for us (62 replies) |
Median year apartment built: 1939
Household type by relationship:
Households: 4,947- Male householders: 1,009 (302 living alone), Female householders: 1,364 (524 living alone)
1,209 spouses (1,197 opposite-sex spouses), 102 unmarried partners, (102 opposite-sex unmarried partners), 927 children (871 natural, 56 adopted, 0 stepchildren), 62 grandchildren, 17 brothers or sisters, 77 parents, 0 foster children, 87 other relatives, 39 non-relatives
- In group quarters: 51
Size of family households: 970 2-persons, 187 3-persons, 160 4-persons, 103 5-persons, 14 6-persons.
Size of nonfamily households: 890 1-person, 84 2-persons.
324 married couples with children.
173 single-parent households (75 men, 98 women).
95.4% of residents of Rockport speak English at home.
2.3% of residents speak Spanish at home (91% speak English very well, 9% speak English not well).
2.1% of residents speak other Indo-European language at home (95% speak English very well, 5% speak English well).
0.2% of residents speak other language at home (100% speak English very well).
Foreign born population: 175 (3.5%)
(63.4% of them are naturalized citizens)
| Here: | 6.9 |
| State: | 6.5 |
| Here: | 4.3 |
| State: | 4.0 |

- Bedrooms in owner-occupied houses and condos in Rockport, Massachusetts
- 8no bedroom
- 971 bedroom
- 4082 bedrooms
- 6623 bedrooms
- 3514 bedrooms
- 785+ bedrooms

- Bedrooms in renter-occupied apartments in Rockport, Massachusetts
- 32no bedroom
- 3721 bedroom
- 3172 bedrooms
- 473 bedrooms
- 204 bedrooms
- 95+ bedrooms

- Cars and other vehicles available in Rockport in owner-occupied houses/condos
- 94no vehicle
- 4631 vehicle
- 7422 vehicles
- 2103 vehicles
- 814 vehicles
- 155+ vehicles

- Cars and other vehicles available in Rockport in renter-occupied apartments
- 124no vehicle
- 5601 vehicle
- 882 vehicles
- 03 vehicles
- 254 vehicles
- 05+ vehicles

- Rooms in owner-occupied houses in Rockport, Massachusetts
- 01 room
- 82 rooms
- 613 rooms
- 1044 rooms
- 2115 rooms
- 3126 rooms
- 2837 rooms
- 3098 rooms
- 3189+ rooms

- Rooms in renter-occupied apartments in Rockport, Massachusetts
- 181 room
- 1262 rooms
- 1143 rooms
- 1964 rooms
- 1315 rooms
- 986 rooms
- 597 rooms
- 318 rooms
- 239+ rooms


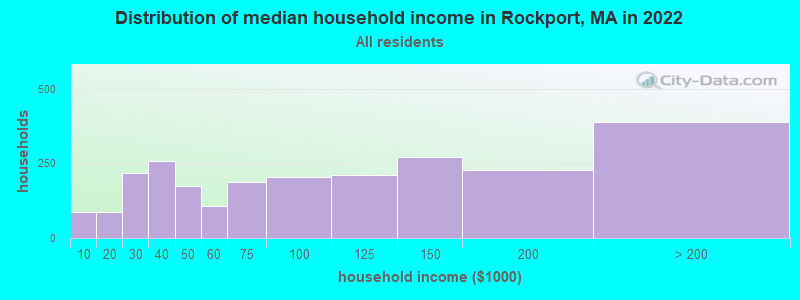
Rockport, MA household income distribution

- 87Less than $10,000
- 88$10,000 to $19,999
- 219$20,000 to $29,999
- 258$30,000 to $39,999
- 173$40,000 to $49,999
- 106$50,000 to $59,999
- 187$60,000 to $74,999
- 206$75,000 to $99,999
- 210$100,000 to $124,999
- 270$125,000 to $149,999
- 228$150,000 to $199,999
- 389$200,000 or more
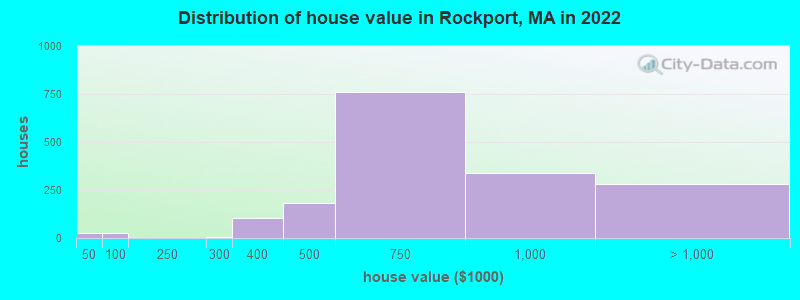
Home value of owner - occupied houses in 2022 in Rockport, MA
-
- 15Less than $10,000
- 4$30,000 to $34,999
- 6$35,000 to $39,999
- 24$80,000 to $89,999
- 5$250,000 to $299,999
- 101$300,000 to $399,999
- 183$400,000 to $499,999
- 761$500,000 to $749,999
- 337$750,000 to $999,999
- 129$1,000,000 to $1,499,999
- 78$1,500,000 to $1,999,999
- 75$2,000,000 or more
Rent paid by renters in 2022 in Rockport, MA
-
- 25$350 to $399
- 9$450 to $499
- 4$550 to $599
- 40$600 to $649
- 106$750 to $799
- 26$800 to $899
- 51$1,000 to $1,249
- 59$1,250 to $1,499
- 335$1,500 to $1,999
- 120$2,000 to $2,499
- 50No cash rent


Percentage of workers working in this county: 82.6%
Number of people working at home: 517 (21.7% of all workers)
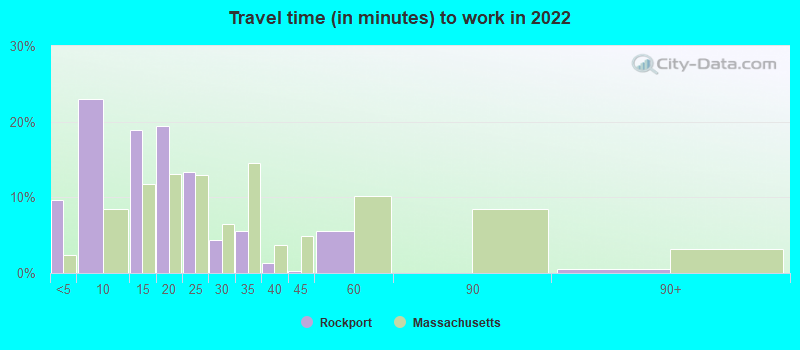
Travel time to work (commute)
- Less than 5 minutes: 181
- 5 to 9 minutes: 383
- 10 to 14 minutes: 186
- 15 to 19 minutes: 220
- 20 to 24 minutes: 185
- 25 to 29 minutes: 120
- 30 to 34 minutes: 126
- 35 to 39 minutes: 8
- 40 to 44 minutes: 156
- 45 to 59 minutes: 152
- 60 to 89 minutes: 72
- 90 or more minutes: 155
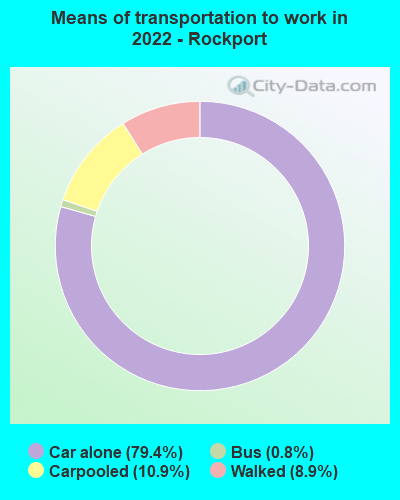
Means of transportation to work:
- Drove a car alone: 962 (57.8%)
- Carpooled: 100 (6.0%)
- Bus: 8 (0.5%)
- Walked: 96 (5.8%)
- Worked at home: 517 (31.1%)

- Unemployment by race in 2022
- Unemployment rate for White non-Hispanic residents
- 3.7%Males
- 3.5%Females
- Unemployment rate for two or more race residents
- 19.4%Females
- Unemployment rate for Hispanic or Latino residents
- 34.8%Females

- Year of entry for the foreign-born population in Rockport, Massachusetts
- 172010 or later
- 232000 to 2009
- 271990 to 1999
- 881980 to 1989
- 231970 to 1979
- 157Before 1970
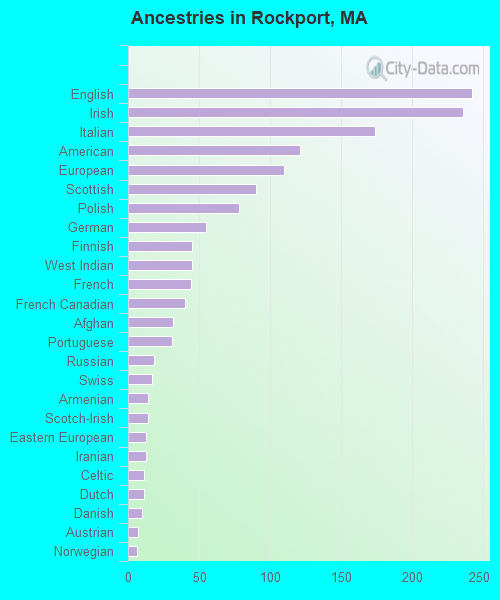
First ancestries reported:
- English: 242 (14.7%)
- Irish: 236 (14.3%)
- Italian: 174 (10.6%)
- American: 121 (7.3%)
- European: 110 (6.7%)
- Scottish: 90 (5.5%)
- Polish: 78 (4.7%)
- German: 55 (3.3%)
- Finnish: 45 (2.7%)
- West Indian: 45 (2.7%)
- French: 44 (2.7%)
- French Canadian: 40 (2.4%)
- Afghan: 32 (1.9%)
- Portuguese: 31 (1.9%)
- Russian: 18 (1.1%)
- Swiss: 17 (1.0%)
- Armenian: 14 (0.8%)
- Scotch-Irish: 14 (0.8%)
- Eastern European: 13 (0.8%)
- Iranian: 13 (0.8%)
- Celtic: 11 (0.7%)
- Dutch: 11 (0.7%)
- Danish: 10 (0.6%)
- Austrian: 7 (0.4%)
- Norwegian: 6 (0.4%)
- Swedish: 5 (0.3%)
- British: 4 (0.2%)
- Greek: 3 (0.2%)
Most common places of birth for foreign-born residents (%):
| Rockport: | 14.2% (24) |
| Massachusetts: | 2.3% (28,158) |
| Rockport: | 13.0% (22) |
| Massachusetts: | 0.6% (7,364) |
| Rockport: | 12.4% (21) |
| Massachusetts: | 2.3% (27,810) |
| Rockport: | 11.2% (19) |
| Massachusetts: | 0.1% (883) |
| Rockport: | 7.7% (13) |
| Massachusetts: | 0.2% (1,923) |
| Rockport: | 7.7% (13) |
| Massachusetts: | 8.3% (101,767) |
| Rockport: | 7.1% (12) |
| Massachusetts: | 3.7% (45,667) |
| Rockport: | 5.9% (10) |
| Massachusetts: | 0.1% (1,702) |
| Rockport: | 4.1% (7) |
| Massachusetts: | 0.6% (7,064) |
| Rockport: | 4.1% (7) |
| Massachusetts: | 1.0% (12,529) |
| Rockport: | 4.1% (7) |
| Massachusetts: | 0.9% (10,698) |
| Rockport: | 3.0% (5) |
| Massachusetts: | 0.2% (2,666) |
Place of birth for U.S.-born residents:
- This state: 3,095
- Other state: 1,501
- Northeast: 913
- Midwest: 184
- South: 231
- West: 171
89.5% of Rockport residents lived in the same house 1 years ago.
Out of people who lived in different houses, 41.5% lived in this county.
Out of people who lived in different counties, 84.7% lived in Massachusetts.
| Rockport: | 89.5% |
| State average: | 87.7% |
Education attainment for males 25 years and older:
- No schooling: 0
- Nursery to 4th grade: 0
- 5th and 6th grade: 0
- 7th and 8th grade: 0
- 9th grade: 38
- 10th grade: 35
- 11th grade: 0
- 12th grade, no diploma: 23
- High school graduate (or equivalency): 181
- Less than 1 year of college: 78
- Some college more than 1 year, no degree: 220
- Associate degree: 107
- Bachelor's degree: 553
- Master's degree: 341
- Professional school degree: 131
- Doctorate degree: 95

Education attainment for females 25 years and older:
- No schooling: 0
- Nursery to 4th grade: 12
- 5th and 6th grade: 0
- 7th and 8th grade: 0
- 9th grade: 0
- 10th grade: 13
- 11th grade: 29
- 12th grade, no diploma: 0
- High school graduate (or equivalency): 313
- Less than 1 year of college: 91
- Some college more than 1 year, no degree: 231
- Associate degree: 237
- Bachelor's degree: 612
- Master's degree: 565
- Professional school degree: 78
- Doctorate degree: 56

Housing units in structures:
- One, detached: 2,133
- One, attached: 126
- Two: 338
- 3 or 4: 277
- 5 to 9: 230
- 10 to 19: 49
- 20 to 49: 29
- 50 or more: 4
- Mobile homes: 23
Housing units lacking complete kitchen facilities in 2022: 0.8%
House/condo owner moved in on average 15 years ago
Renter moved in on average 5 years ago

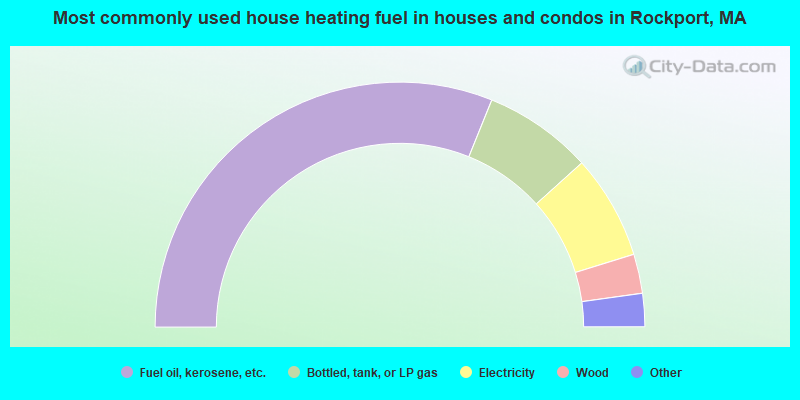
- 62.3%Fuel oil, kerosene, etc.
- 14.4%Bottled, tank, or LP gas
- 13.8%Electricity
- 5.2%Wood
- 1.9%Utility gas
- 1.1%Other fuel
- 0.8%Coal or coke
- 0.5%Solar energy
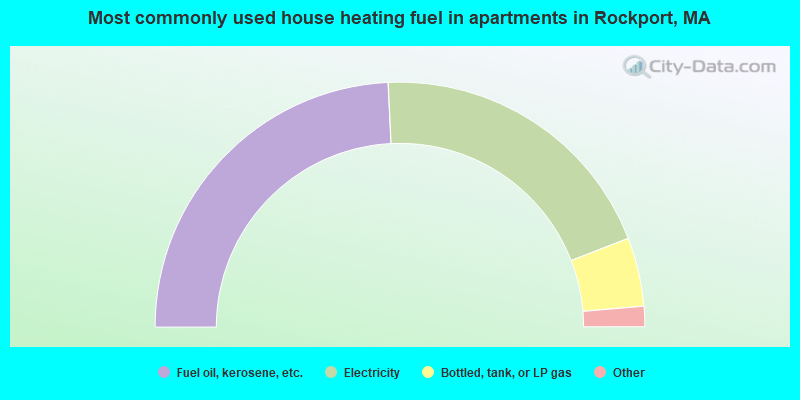
- 48.5%Fuel oil, kerosene, etc.
- 39.8%Electricity
- 9.1%Bottled, tank, or LP gas
- 1.5%Utility gas
- 1.0%Wood
Private vs. public school enrollment:
| Here: | 0.0% |
| Massachusetts: | 10.3% |
| Here: | 20.4% |
| Massachusetts: | 12.3% |
| Here: | 60.7% |
| Massachusetts: | 51.2% |


