Rolling Hills Estates, CA (California) Houses and Residents
| Rolling Hills Estates: | $1,734,978 |
| California: | $715,900 |
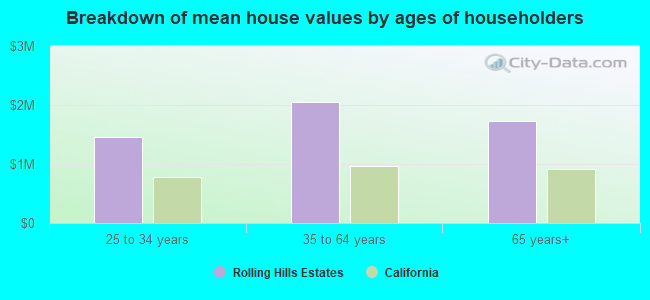
Mean price in 2022:
Detached houses: $2,065,488
Here: $2,065,488 State: $988,808 Townhouses or other attached units: $1,161,759
Here: $1,161,759 State: $838,546 In 3-to-4-unit structures: $1,008,576
Here: $1,008,576 State: $824,253 In 5-or-more-unit structures: $1,116,446
Here: $1,116,446 State: $730,996
Total population: 8,251 (Urban population: 7,669, Rural population: 0)
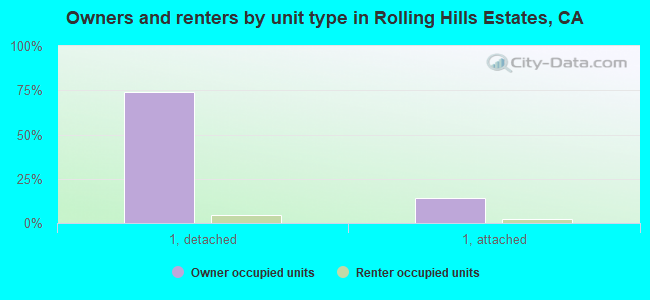
Houses: 3,076 (2,824 occupied: 2,627 owner occupied, 208 renter occupied)
| % of renters here: | 7% |
| State: | 44% |
Housing density: 857 houses/condos per square mile
Median price asked for vacant for-sale houses and condos in 2022: $2,295,441.
Median contract rent in 2022: over $2,000
Median rent asked for vacant for-rent units in 2022: $24,647
Median gross rent in Rolling Hills Estates, CA in 2022: over $2,000
Housing units in Rolling Hills Estates with a mortgage: 1,686 (249 second mortgage, 30 home equity loan, 168 both second mortgage and home equity loan)
Houses without a mortgage: 6
Median household income for houses/condos with a mortgage: $200,565
Median household income for apartments without a mortgage: $155,324
Median monthly housing costs: $3,935
Compare current foreclosures near Rolling Hills Estates, CA:
| Photo | Address | Area | Beds / Baths | Price | Details |
|---|---|---|---|---|---|

|
#1
E 60th St
Los Angeles, CA 90001
|
1,883 sq. feet
|
3 baths 5 beds |
show details | |

|
#2
W Arbor St # 57
Long Beach, CA 90805
|
1,585 sq. feet
|
2 baths 3 beds |
show details | |

|
#3
Mira Mar Ave
Long Beach, CA 90814
|
1,902 sq. feet
|
2 baths 4 beds |
show details | |

|
#4
Marina City Dr Unit 116
Marina Del Rey, CA 90292
|
1,722 sq. feet
|
2 baths 3 beds |
show details | |

|
#5
W 110th St
Inglewood, CA 90303
|
3,481 sq. feet
|
4 baths 6 beds |
show details | |

|
#6
6th Ave
Venice, CA 90291
|
3,192 sq. feet
|
3 baths 6 beds |
show details | |

|
#7
Redondo Avenue, Units 5-8
Long Beach, CA 90804
|
3,360 sq. feet
|
4 baths 8 beds |
show details | |

|
#8
S Tamarind Ave
Compton, CA 90220
|
900 sq. feet
|
1 baths 4 beds |
show details | |

|
#9
Faust Ave
Long Beach, CA 90808
|
1,434 sq. feet
|
2 baths 3 beds |
show details | |

|
#10
E Poppy St
Long Beach, CA 90805
|
1,091 sq. feet
|
2 baths 2 beds |
show details |
| Photo | Address | Area | Beds / Baths | Price | Details |
|---|---|---|---|---|---|

|
#11
S Garth Ave
Los Angeles, CA 90056
|
2,275 sq. feet
|
2 baths 3 beds |
show details | |

|
#12
W 168th Pl
Gardena, CA 90247
|
1,400 sq. feet
|
2 baths 4 beds |
show details | |

|
#13
Regway Ave
Long Beach, CA 90810
|
924 sq. feet
|
1 baths 2 beds |
show details | |

|
#14
E Keynote St
Long Beach, CA 90808
|
1,064 sq. feet
|
1 baths 2 beds |
show details | |

|
#15
W 98th St
Los Angeles, CA 90044
|
1,022 sq. feet
|
2 baths 3 beds |
show details | |

|
#16
W 70th St
Los Angeles, CA 90044
|
1,102 sq. feet
|
1 baths 2 beds |
show details | |

|
#17
Missouri Ave
South Gate, CA 90280
|
1,441 sq. feet
|
2 baths 3 beds |
show details | |

|
#18
Denrock Ave
Los Angeles, CA 90045
|
3,720 sq. feet
|
5 baths 4 beds |
show details | |

|
#19
And 4308 1/2s Dalton Ave
Los Angeles, CA 90062
|
1,772 sq. feet
|
2 baths 4 beds |
show details | |

|
#20
Myrtle Ave
Long Beach, CA 90807
|
3,563 sq. feet
|
4 baths 6 beds |
show details |
| Photo | Address | Area | Beds / Baths | Price | Details |
|---|---|---|---|---|---|

|
#21
Strongs Dr
Venice, CA 90291
|
1,723 sq. feet
|
2 baths 2 beds |
show details | |

|
#22
E 60th St
Los Angeles, CA 90003
|
672 sq. feet
|
1 baths 2 beds |
show details | |

|
#23
S 5th Ave
Inglewood, CA 90303
|
2,010 sq. feet
|
3 baths 4 beds |
show details | |

|
#24
Don Ricardo Dr Apt 20
Los Angeles, CA 90008
|
641 sq. feet
|
1 baths 1 beds |
show details | |

|
#25
Cortland Ave
Paramount, CA 90723
|
2,354 sq. feet
|
3 baths 4 beds |
show details | |

|
#26
4th Ave
Los Angeles, CA 90008
|
1,265 sq. feet
|
1 baths 2 beds |
show details | |

|
#27
Eastwood Ave
Torrance, CA 90504
|
1,217 sq. feet
|
2 baths 2 beds |
show details | |

|
#28
Glencoe Ave Apt 205
Marina Del Rey, CA 90292
|
970 sq. feet
|
2 baths 2 beds |
show details | |

|
#29
Playa Vista Dr Apt 15
Los Angeles, CA 90094
|
1,920 sq. feet
|
3 baths 1 beds |
show details | |

|
#30
Saint Albans Dr
Los Alamitos, CA 90720
|
- sq. feet
|
5 baths 5 beds |
show details |
| Photo | Address | Area | Beds / Baths | Price | Details |
|---|---|---|---|---|---|

|
#31
Holmes Ave
Los Angeles, CA 90001
|
1,129 sq. feet
|
2 baths 4 beds |
show details | |

|
#32
Cole St
Downey, CA 90242
|
1,768 sq. feet
|
2 baths 3 beds |
show details | |

|
#33
Village Way
Signal Hill, CA 90755
|
1,524 sq. feet
|
3 baths 3 beds |
show details | |

|
#34
Alviso Ave
Los Angeles, CA 90043
|
1,330 sq. feet
|
1 baths 3 beds |
show details | |

|
#35
Acacia St
Los Angeles, CA 90056
|
2,186 sq. feet
|
2 baths 3 beds |
show details | |

|
#36
W 83rd St
Inglewood, CA 90305
|
1,374 sq. feet
|
2 baths 3 beds |
show details | |

|
#37
Hathaway Ave Unit 26
Long Beach, CA 90815
|
957 sq. feet
|
2 baths 2 beds |
show details | |

|
#38
E 215th Pl
Carson, CA 90745
|
1,225 sq. feet
|
2 baths 4 beds |
show details | |

|
#39
S 5th Ave
Inglewood, CA 90305
|
1,574 sq. feet
|
2 baths 4 beds |
show details | |

|
#40
W Home St
Long Beach, CA 90805
|
1,628 sq. feet
|
2 baths 3 beds |
show details |
| Photo | Address | Area | Beds / Baths | Price | Details |
|---|---|---|---|---|---|

|
#41
Ardath Ave
Gardena, CA 90249
|
1,304 sq. feet
|
2 baths 3 beds |
show details | |

|
#42
Wilmington Ave
Los Angeles, CA 90059
|
850 sq. feet
|
1 baths 2 beds |
show details | |

|
#43
W 60th St
Los Angeles, CA 90043
|
1,638 sq. feet
|
2 baths 4 beds |
show details | |

|
#44
Leapwood Ave
Carson, CA 90746
|
1,478 sq. feet
|
2 baths 4 beds |
show details | |

|
#45
W 105th St
Los Angeles, CA 90044
|
792 sq. feet
|
1 baths 2 beds |
show details | |

|
#46
Josephine St
Lynwood, CA 90262
|
1,414 sq. feet
|
1 baths 3 beds |
show details | |

|
#47
S Budlong Ave
Los Angeles, CA 90044
|
1,201 sq. feet
|
2 baths 4 beds |
show details | |

|
#48
W 82nd St
Los Angeles, CA 90047
|
1,384 sq. feet
|
2 baths 3 beds |
show details | |

|
#49
E 7th St
Long Beach, CA 90813
|
2,456 sq. feet
|
4 baths 6 beds |
show details | |

|
Check over 1 million property listings on Foreclosure.com!
|
browse all offers | |||


Median year apartment built: 1967
Household type by relationship:
Households: 8,035- Male householders: 1,412 (146 living alone), Female householders: 1,318 (332 living alone)
1,908 spouses (1,886 opposite-sex spouses), 22 unmarried partners, (22 opposite-sex unmarried partners), 2,563 children (2,429 natural, 7 adopted, 126 stepchildren), 458 grandchildren, 4 brothers or sisters, 112 parents, 0 foster children, 94 other relatives, 138 non-relatives
Size of family households: 980 2-persons, 458 3-persons, 578 4-persons, 195 5-persons, 45 6-persons, 5 7-or-more-persons.
Size of nonfamily households: 514 1-person, 13 2-persons, 17 3-persons, 19 4-persons.
1,388 married couples with children.
154 single-parent households (33 men, 121 women).
77.1% of residents of Rolling Hills Estates speak English at home.
3.2% of residents speak Spanish at home (96% speak English very well, 4% speak English well).
4.6% of residents speak other Indo-European language at home (87% speak English very well, 12% speak English well, 1% speak English not well).
16.2% of residents speak Asian or Pacific Island language at home (62% speak English very well, 31% speak English well, 7% speak English not well, 1% don't speak English at all).
0.2% of residents speak other language at home (100% speak English very well).
Foreign born population: 1,875 (23.3%)
(61.5% of them are naturalized citizens)
| Here: | 6.4 |
| State: | 6.0 |
| Here: | 5.8 |
| State: | 3.9 |
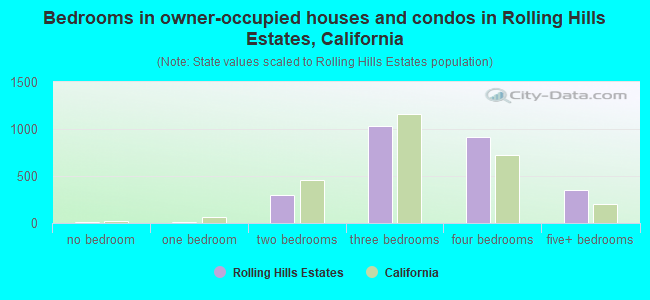
- Bedrooms in owner-occupied houses and condos in Rolling Hills Estates, California
- 7no bedroom
- 141 bedroom
- 3022 bedrooms
- 1,0343 bedrooms
- 9194 bedrooms
- 3515+ bedrooms

- Bedrooms in renter-occupied apartments in Rolling Hills Estates, California
- 0no bedroom
- 101 bedroom
- 452 bedrooms
- 723 bedrooms
- 754 bedrooms
- 65+ bedrooms
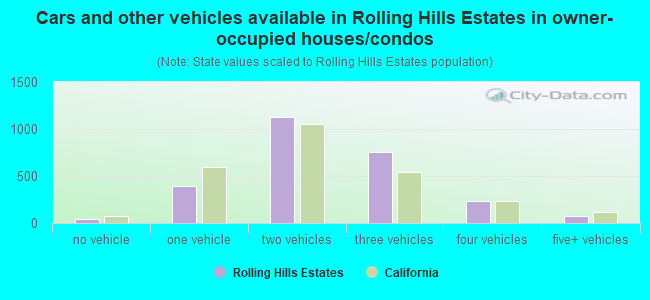
- Cars and other vehicles available in Rolling Hills Estates in owner-occupied houses/condos
- 45no vehicle
- 3951 vehicle
- 1,1302 vehicles
- 7533 vehicles
- 2294 vehicles
- 765+ vehicles
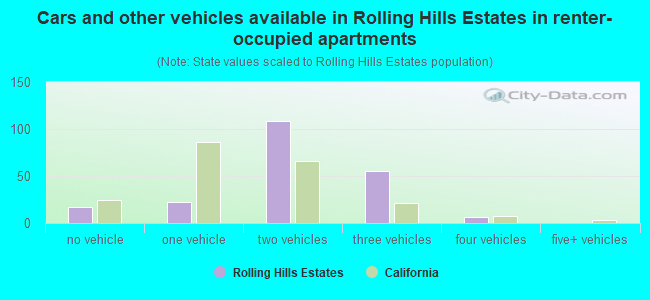
- Cars and other vehicles available in Rolling Hills Estates in renter-occupied apartments
- 17no vehicle
- 221 vehicle
- 1082 vehicles
- 553 vehicles
- 64 vehicles
- 05+ vehicles
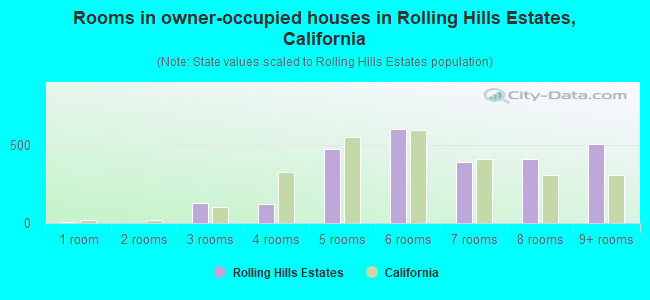
- Rooms in owner-occupied houses in Rolling Hills Estates, California
- 71 room
- 02 rooms
- 1283 rooms
- 1234 rooms
- 4695 rooms
- 5996 rooms
- 3877 rooms
- 4098 rooms
- 5059+ rooms
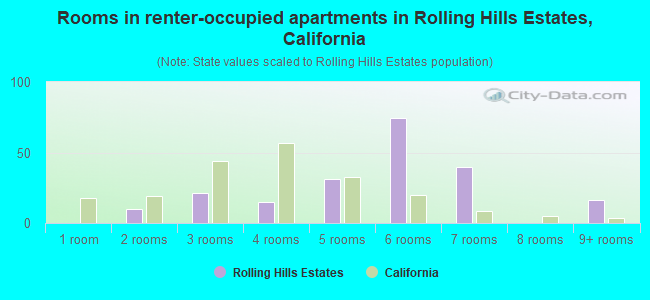
- Rooms in renter-occupied apartments in Rolling Hills Estates, California
- 01 room
- 102 rooms
- 213 rooms
- 154 rooms
- 315 rooms
- 746 rooms
- 407 rooms
- 08 rooms
- 169+ rooms
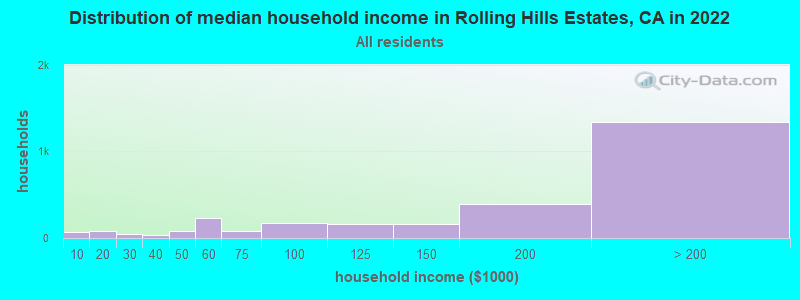
Rolling Hills Estates, CA household income distribution

- 72Less than $10,000
- 82$10,000 to $19,999
- 41$20,000 to $29,999
- 36$30,000 to $39,999
- 82$40,000 to $49,999
- 235$50,000 to $59,999
- 80$60,000 to $74,999
- 175$75,000 to $99,999
- 158$100,000 to $124,999
- 159$125,000 to $149,999
- 392$150,000 to $199,999
- 1,339$200,000 or more
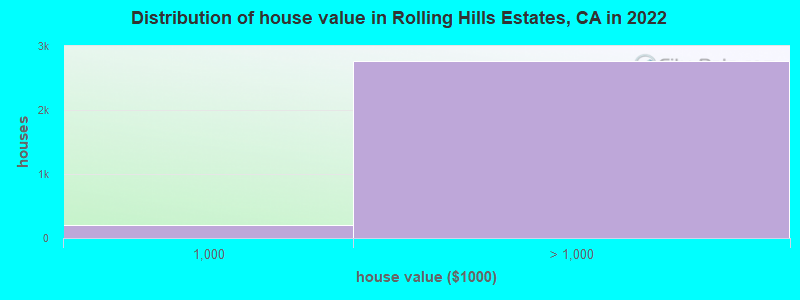
Home value of owner - occupied houses in 2022 in Rolling Hills Estates, CA
-
- 8Less than $10,000
- 5$10,000 to $14,999
- 5$50,000 to $59,999
- 18$80,000 to $89,999
- 5$100,000 to $124,999
- 10$400,000 to $499,999
- 23$500,000 to $749,999
- 208$750,000 to $999,999
- 1,059$1,000,000 to $1,499,999
- 754$1,500,000 to $1,999,999
- 952$2,000,000 or more
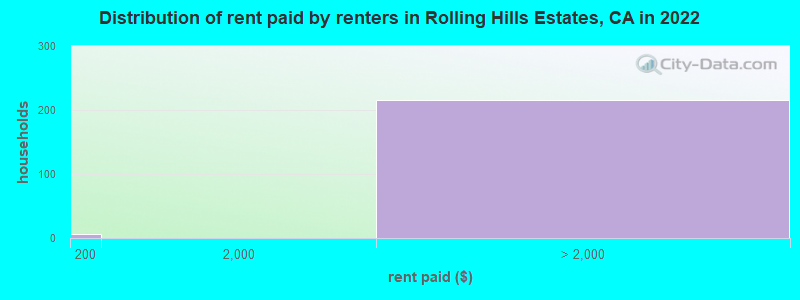
Rent paid by renters in 2022 in Rolling Hills Estates, CA
-
- 6$150 to $199
- 36$2,500 to $2,999
- 26$3,000 to $3,499
- 152$3,500 or more
Percentage of workers working in this county: 97.1%
Number of people working at home: 964 (30.0% of all workers)
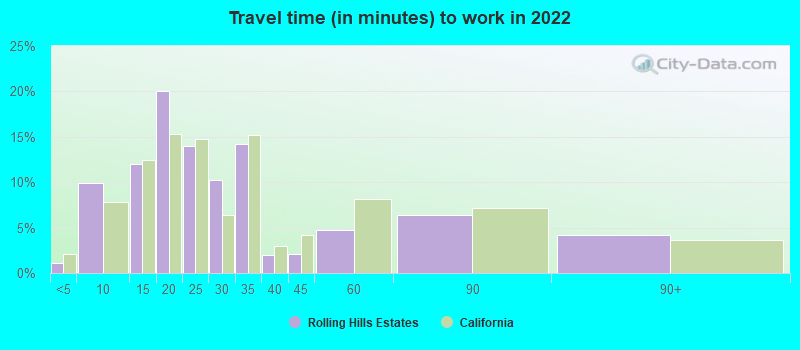
Travel time to work (commute)
- Less than 5 minutes: 20
- 5 to 9 minutes: 192
- 10 to 14 minutes: 200
- 15 to 19 minutes: 458
- 20 to 24 minutes: 273
- 25 to 29 minutes: 132
- 30 to 34 minutes: 322
- 35 to 39 minutes: 110
- 40 to 44 minutes: 90
- 45 to 59 minutes: 207
- 60 to 89 minutes: 241
- 90 or more minutes: 96
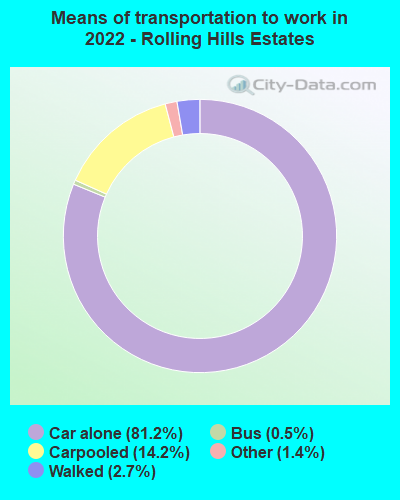
Means of transportation to work:
- Drove a car alone: 2,499 (62.6%)
- Carpooled: 484 (12.1%)
- Bus: 13 (0.3%)
- Taxi: 48 (1.2%)
- Walked: 88 (2.2%)
- Worked at home: 964 (24.1%)
- Unemployment by race in 2022
- Unemployment rate for White non-Hispanic residents
- 4.4%Males
- 11.0%Females
- Unemployment rate for Black residents
- 27.2%Males
- Unemployment rate for Asian residents
- 6.1%Males
- 9.1%Females
- Unemployment rate for two or more race residents
- 3.5%Males
- 29.7%Females
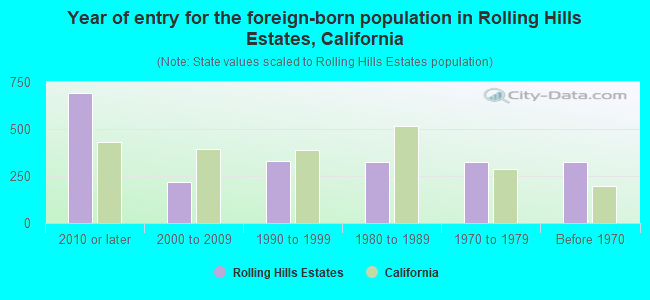
- Year of entry for the foreign-born population in Rolling Hills Estates, California
- 6922010 or later
- 2172000 to 2009
- 3321990 to 1999
- 3231980 to 1989
- 3251970 to 1979
- 326Before 1970
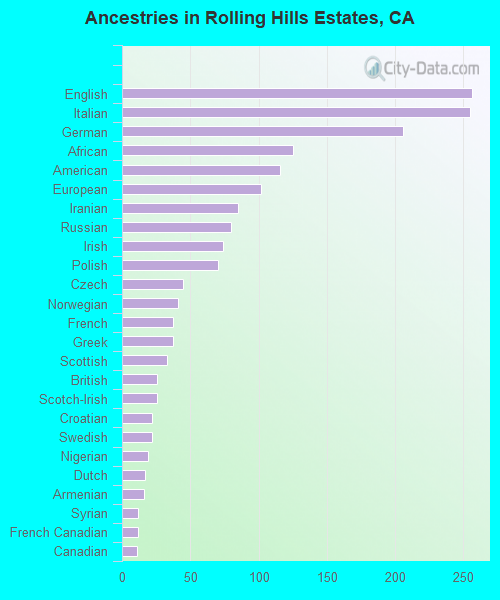
First ancestries reported:
- English: 256 (6.7%)
- Italian: 255 (6.7%)
- German: 206 (5.4%)
- African: 125 (3.3%)
- American: 116 (3.0%)
- European: 102 (2.7%)
- Iranian: 85 (2.2%)
- Russian: 80 (2.1%)
- Irish: 74 (1.9%)
- Polish: 70 (1.8%)
- Czech: 45 (1.2%)
- Norwegian: 41 (1.1%)
- French: 37 (1.0%)
- Greek: 37 (1.0%)
- Scottish: 33 (0.9%)
- British: 26 (0.7%)
- Scotch-Irish: 26 (0.7%)
- Croatian: 22 (0.6%)
- Swedish: 22 (0.6%)
- Nigerian: 19 (0.5%)
- Dutch: 17 (0.4%)
- Armenian: 16 (0.4%)
- Syrian: 12 (0.3%)
- French Canadian: 12 (0.3%)
- Canadian: 11 (0.3%)
- Hungarian: 11 (0.3%)
- Brazilian: 7 (0.2%)
- Ukrainian: 7 (0.2%)
- Welsh: 7 (0.2%)
- Northern European: 6 (0.2%)
- Jamaican: 6 (0.2%)
- Austrian: 4 (0.1%)
Most common places of birth for foreign-born residents (%):
| Rolling Hills Estates: | 20.7% (388) |
| California: | 6.6% (684,672) |
| Rolling Hills Estates: | 14.6% (273) |
| California: | 3.0% (315,248) |
| Rolling Hills Estates: | 9.0% (168) |
| California: | 1.0% (103,575) |
| Rolling Hills Estates: | 6.0% (113) |
| California: | 7.8% (818,297) |
| Rolling Hills Estates: | 5.7% (107) |
| California: | 1.7% (176,274) |
| Rolling Hills Estates: | 5.3% (100) |
| California: | 0.6% (60,582) |
| Rolling Hills Estates: | 4.7% (88) |
| California: | 2.0% (206,004) |
| Rolling Hills Estates: | 3.9% (74) |
| California: | 1.2% (127,477) |
| Rolling Hills Estates: | 3.7% (69) |
| California: | 5.2% (539,184) |
| Rolling Hills Estates: | 3.0% (56) |
| California: | 0.7% (73,304) |
| Rolling Hills Estates: | 2.2% (42) |
| California: | 4.9% (512,335) |
| Rolling Hills Estates: | 2.1% (39) |
| California: | 0.0% (4,947) |
| Rolling Hills Estates: | 2.0% (38) |
| California: | 0.6% (57,953) |
| Rolling Hills Estates: | 1.7% (31) |
| California: | 1.0% (105,215) |
Place of birth for U.S.-born residents:
- This state: 3,972
- Other state: 2,087
- Northeast: 809
- Midwest: 755
- South: 226
- West: 291
92.7% of Rolling Hills Estates residents lived in the same house 1 years ago.
Out of people who lived in different houses, 44.1% lived in this county.
Out of people who lived in different counties, 61.5% lived in California.
| Rolling Hills Estates: | 92.7% |
| State average: | 88.9% |
Education attainment for males 25 years and older:
- No schooling: 0
- Nursery to 4th grade: 0
- 5th and 6th grade: 9
- 7th and 8th grade: 0
- 9th grade: 0
- 10th grade: 0
- 11th grade: 0
- 12th grade, no diploma: 16
- High school graduate (or equivalency): 161
- Less than 1 year of college: 138
- Some college more than 1 year, no degree: 251
- Associate degree: 91
- Bachelor's degree: 1,063
- Master's degree: 679
- Professional school degree: 240
- Doctorate degree: 158
Education attainment for females 25 years and older:
- No schooling: 0
- Nursery to 4th grade: 0
- 5th and 6th grade: 4
- 7th and 8th grade: 7
- 9th grade: 0
- 10th grade: 0
- 11th grade: 0
- 12th grade, no diploma: 10
- High school graduate (or equivalency): 191
- Less than 1 year of college: 169
- Some college more than 1 year, no degree: 267
- Associate degree: 173
- Bachelor's degree: 1,437
- Master's degree: 582
- Professional school degree: 161
- Doctorate degree: 83
Housing units in structures:
- One, detached: 2,445
- One, attached: 503
- 3 or 4: 44
- 5 to 9: 23
- 10 to 19: 15
- 20 to 49: 15
- 50 or more: 29
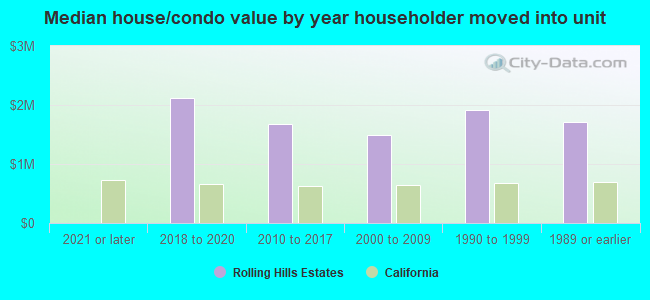
House/condo owner moved in on average 18 years ago
Renter moved in on average 4 years ago

- 80.6%Utility gas
- 16.8%Electricity
- 1.2%Bottled, tank, or LP gas
- 0.8%Solar energy
- 0.4%No fuel used
- 0.2%Fuel oil, kerosene, etc.
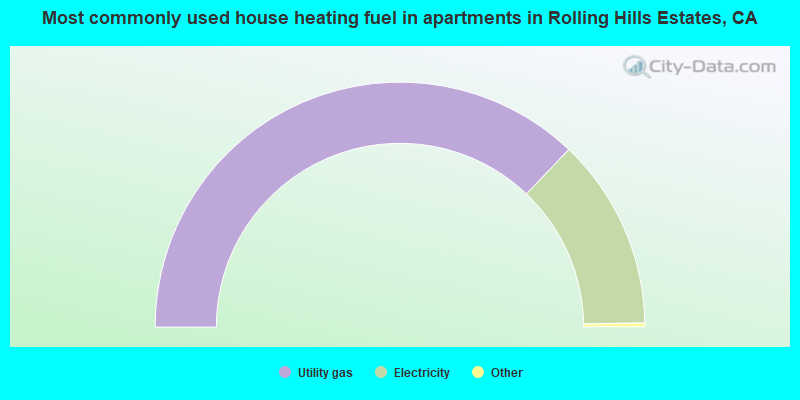
- 74.6%Utility gas
- 25.4%Electricity
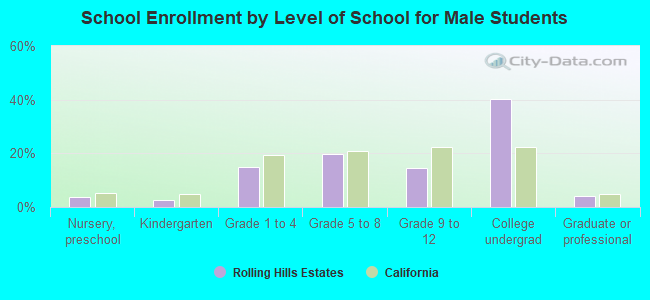
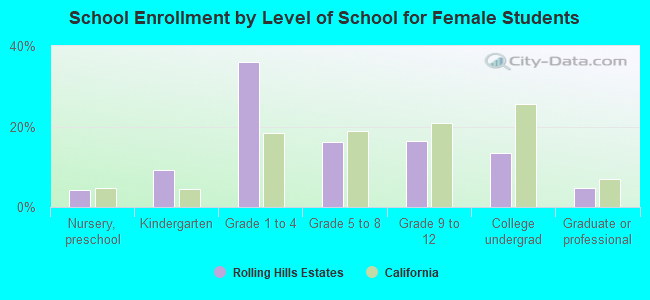
Private vs. public school enrollment:
| Here: | 15.8% |
| California: | 10.5% |
| Here: | 6.2% |
| California: | 8.5% |
| Here: | 8.6% |
| California: | 15.9% |