Roseville, MI (Michigan) Houses and Residents
Estimated median house or condo value in 2022: $143,884 (it was $97,100 in 2000 )
Roseville:
$143,884Michigan:
$224,400
Lower value quartile - upper value quartile: $102,746 - $177,091Mean price in 2022: Detached houses: $123,403 Here:
$123,403State:
$280,038
Townhouses or other attached units: $78,089 Here:
$78,089State:
$239,520
In 2-unit structures: $115,498 Here:
$115,498State:
$219,481
In 3-to-4-unit structures: $45,701 Here:
$45,701State:
$207,067
In 5-or-more-unit structures: $64,909 Here:
$64,909State:
$192,733
Mobile homes: $64,338 Here:
$64,338State:
$72,868
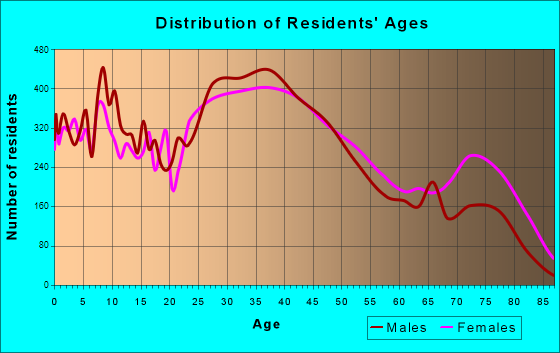
Total population: 47,598 (All urban)
Houses: 22,144 (21,161 occupied: 13,542 owner occupied, 7,703 renter occupied )
% of renters here:
36%State:
27%
Housing density: 2,257 houses/condos per square mile
Median price asked for vacant for-sale houses and condos in 2022: $179,438.
Median contract rent in 2022: $918 (lower quartile is $756, upper quartile is $1,099)
Median rent asked for vacant for-rent units in 2022: $1,169
Median gross rent in Roseville, MI in 2022: $1,114
Housing units in Roseville with a mortgage: 7,921 (714 second mortgage, 9 home equity loan, 542 both second mortgage and home equity loan )Houses without a mortgage: 337
Median household income for houses/condos with a mortgage: $77,967
Median household income for apartments without a mortgage: $46,410
Median monthly housing costs: $961
Data:
Median house or condo value ($)
Median house or condo value ($ change since 2000)
Median house or condo value ($) - White
Median house or condo value ($) - Black or African American
Median house or condo value ($) - Asian
Median house or condo value ($) - Hispanic or Latino
Median house or condo value ($) - American Indian and Alaska Native
Median house or condo value ($) - Multirace
Median house or condo value ($) - Other Race
Median price asked for mobile homes ($)
Household density (households per square mile)
Mean house or condo value by units in structure - 1, detached ($)
Mean house or condo value by units in structure - 1, attached ($)
Mean house or condo value by units in structure - 2 ($)
Mean house or condo value by units in structure by units in structure - 3 or 4 ($)
Mean house or condo value by units in structure - 5 or more ($)
Mean house or condo value by units in structure - Boat, RV, van, etc. ($)
Mean house or condo value by units in structure - Mobile home ($)
Median contract rent ($)
Median contract rent - Lower quartile ($)
Median contract rent - Upper quartile ($)
Median gross rent ($)
Urban houses (%)
Rural houses (%)
Houses occupied (%)
Houses occupied (% change since 2000)
Houses owner occupied (%)
Houses owner occupied (% change since 2000)
Houses renter occupied (%)
Houses renter occupied (% change since 2000)
Vacant housing units - For rent (%)
Vacant housing units - For rent (% change since 2000)
Vacant housing units - For sale only (%)
Vacant housing units - For sale only (% change since 2000)
Vacant housing units - Rented or sold, not occupied (%)
Vacant housing units - Rented or sold, not occupied (% change since 2000)
Vacant housing units - For seasonal, recreational, or occasional use (%)
Vacant housing units - For seasonal, recreational, or occasional use (% change since 2000)
Vacant housing units - For migrant workers (%)
Vacant housing units - For migrant workers (% change since 2000)
Vacant housing units - Other vacant (%)
Vacant housing units - Other vacant (% change since 2000)
Median monthly housing costs ($)
Median household income for houses/condos with a mortgage ($)
Median household income for houses/condos without a mortgage ($)
Median household income ($)
Median household income ($) - White
Median household income ($) - Black or African American
Median household income ($) - Asian
Median household income ($) - Hispanic or Latino
Median household income ($) - American Indian and Alaska Native
Median household income ($) - Multirace
Median household income ($) - Other Race
Mortgage status - with mortgage (%)
Mortgage status - with second mortgage (%)
Mortgage status - with home equity loan (%)
Mortgage status - with both second mortgage and home equity loan (%)
Mortgage status - without a mortgage (%)
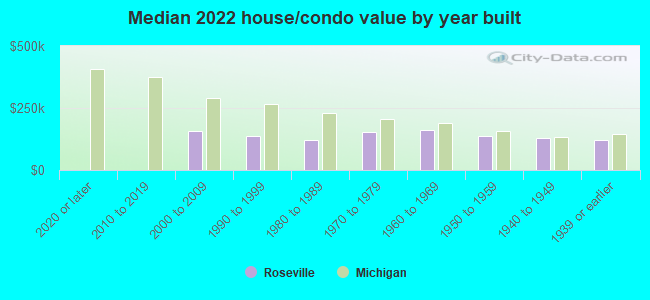
Median year house/condo built
Median year apartment built
Household type by relationship - Male householder living alone (%)
Household type by relationship - Male householder not living alone (%)
Household type by relationship - Female householder living alone (%)
Household type by relationship - Female householder not living alone (%)
Household type by relationship - Opposite-Sex spouse (%)
Household type by relationship - Same-Sex spouse (%)
Household type by relationship - Opposite-Sex unmarried partner (%)
Household type by relationship - Same-Sex unmarried partner (%)
Household type by relationship - In group quarters (%)
Size of family households - 2-person household (%)
Size of family households - 3-person household (%)
Size of family households - 4-person household (%)
Size of family households - 5-person household (%)
Size of family households - 6-person household (%)
Size of family households - 7-or-more-person household (%)
Size of nonfamily households - 1-person household (%)
Size of nonfamily households - 2-person household (%)
Size of nonfamily households - 3-person household (%)
Size of nonfamily households - 4-person household (%)
Size of nonfamily households - 5-person household (%)
Size of nonfamily households - 6-person household (%)
Size of nonfamily households - 7-or-moreperson household (%)
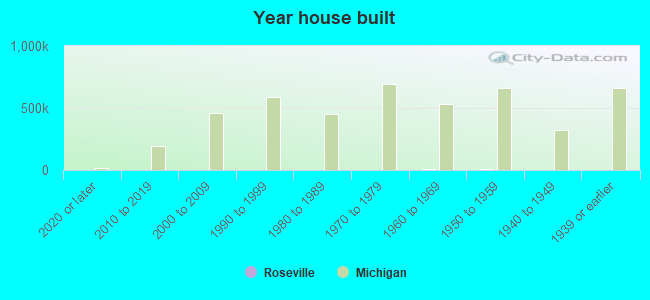
Year house built - Built 2010 or later (%)
Year house built - Built 2000 to 2009 (%)
Year house built - Built 1990 to 1999 (%)
Year house built - Built 1980 to 1989 (%)
Year house built - Built 1970 to 1979 (%)
Year house built - Built 1960 to 1969 (%)
Year house built - Built 1950 to 1959 (%)
Year house built - Built 1940 to 1949 (%)
Year house built - Built 1939 or earlier (%)
Median number of rooms in houses and condos
Median number of rooms in apartments
Median number of bedrooms in owner occupied houses
Mean number of bedrooms in owner occupied houses
Median number of bedrooms in renter occupied houses
Mean number of bedrooms in renter occupied houses
Median number of vehichles in owner occupied houses
Mean number of vehichles in owner occupied houses
Median number of vehichles in renter occupied houses
Mean number of vehichles in renter occupied houses
Rooms in owner-occupied houses - 1 room (%)
Rooms in owner-occupied houses - 2 rooms (%)
Rooms in owner-occupied houses - 3 rooms (%)
Rooms in owner-occupied houses - 4 rooms (%)
Rooms in owner-occupied houses - 5 rooms (%)
Rooms in owner-occupied houses - 6 rooms (%)
Rooms in owner-occupied houses - 7 rooms (%)
Rooms in owner-occupied houses - 8 rooms (%)
Rooms in owner-occupied houses - 9+ rooms (%)
Rooms in renter-occupied houses - 1 room (%)
Rooms in renter-occupied houses - 2 rooms (%)
Rooms in renter-occupied houses - 3 rooms (%)
Rooms in renter-occupied houses - 4 rooms (%)
Rooms in renter-occupied houses - 5 rooms (%)
Rooms in renter-occupied houses - 6 rooms (%)
Rooms in renter-occupied houses - 7 rooms (%)
Rooms in renter-occupied houses - 8 rooms (%)
Rooms in renter-occupied houses - 9+ rooms (%)
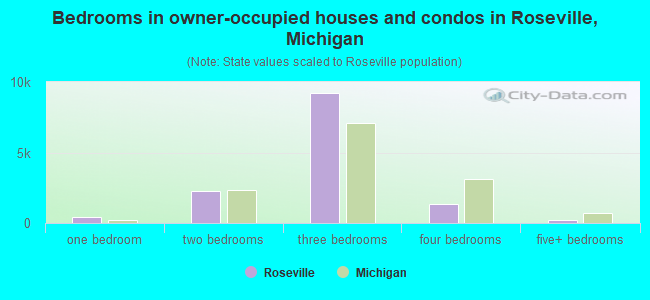
Bedrooms in owner-occupied houses - no bedrooms (%)
Bedrooms in owner-occupied houses - 1 bedroom (%)
Bedrooms in owner-occupied houses - 2 bedrooms (%)
Bedrooms in owner-occupied houses - 3 bedrooms (%)
Bedrooms in owner-occupied houses - 4 bedrooms (%)
Bedrooms in owner-occupied houses - 5+ bedrooms (%)
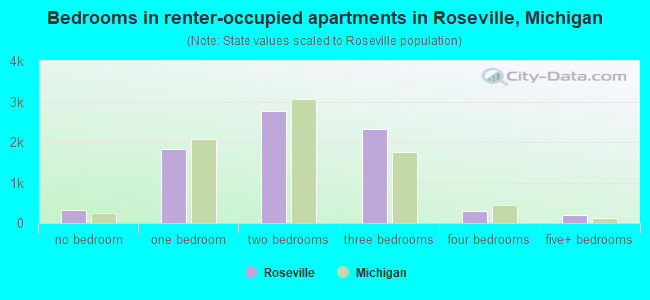
Bedrooms in renter-occupied houses - no bedrooms (%)
Bedrooms in renter-occupied houses - 1 bedroom (%)
Bedrooms in renter-occupied houses - 2 bedrooms (%)
Bedrooms in renter-occupied houses - 3 bedrooms (%)
Bedrooms in renter-occupied houses - 4 bedrooms (%)
Bedrooms in renter-occupied houses - 5+ bedrooms (%)
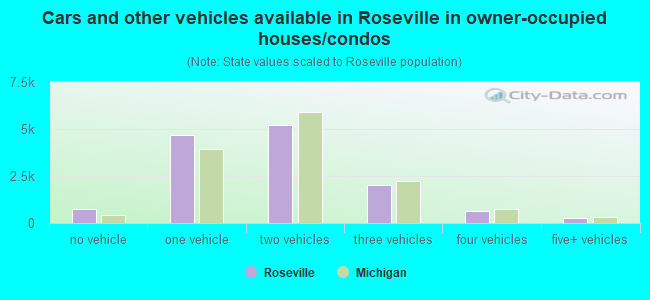
Vehicles available in owner-occupied houses - no vehicle available (%)
Vehicles available in owner-occupied houses - 1 vehicle available(%)
Vehicles available in owner-occupied houses - 2 Vehicles available (%)
Vehicles available in owner-occupied houses - 3 Vehicles available (%)
Vehicles available in owner-occupied houses - 4 Vehicles available (%)
Vehicles available in owner-occupied houses - 5+ Vehicles available (%)
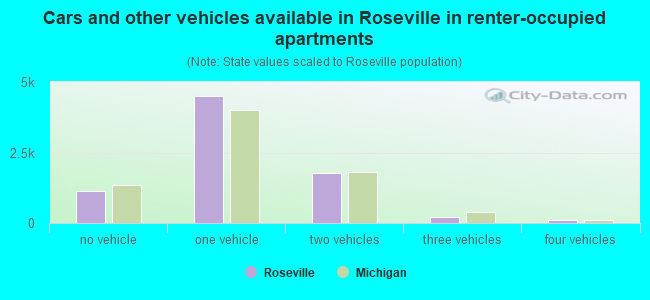
Vehicles available in renter-occupied houses - no vehicle available (%)
Vehicles available in renter-occupied houses - 1 vehicle available (%)
Vehicles available in renter-occupied houses - 2 Vehicles available (%)
Vehicles available in renter-occupied houses - 3 Vehicles available (%)
Vehicles available in renter-occupied houses - 4 Vehicles available (%)
Vehicles available in renter-occupied houses - 5+ Vehicles available (%)
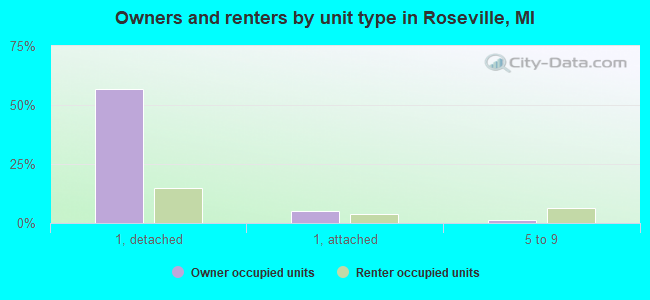
Housing units in structures - 1, detached (%)
Housing units in structures - 1, attached (%)
Housing units in structures - 2 (%)
Housing units in structures - 3 or 4 (%)
Housing units in structures - 5 to 9 (%)
Housing units in structures - 10 to 19 (%)
Housing units in structures - 20 to 49 (%)
Housing units in structures - 50 or more (%)
Housing units in structures - Mobile home (%)
Housing units in structures - Boat, RV, van, etc. (%)
Housing units in structures - Owners - 1, detached (%)
Housing units in structures - Owners - 1, attached (%)
Housing units in structures - Owners - 2 (%)
Housing units in structures - Owners - 3 or 4 (%)
Housing units in structures - Owners - 5 to 9 (%)
Housing units in structures - Owners - 10 to 19 (%)
Housing units in structures - Owners - 20 to 49 (%)
Housing units in structures - Owners - 50 or more (%)
Housing units in structures - Owners - Mobile home (%)
Housing units in structures - Owners - Boat, RV, van, etc. (%)
Housing units in structures - Renters - 1, detached (%)
Housing units in structures - Renters - 1, attached (%)
Housing units in structures - Renters - 2 (%)
Housing units in structures - Renters - 3 or 4 (%)
Housing units in structures - Renters - 5 to 9 (%)
Housing units in structures - Renters - 10 to 19 (%)
Housing units in structures - Renters - 20 to 49 (%)
Housing units in structures - Renters - 50 or more (%)
Housing units in structures - Renters - Mobile home (%)
Housing units in structures - Renters - Boat, RV, van, etc. (%)
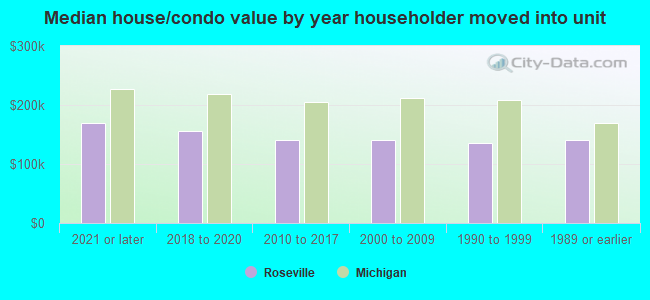
House/condo owner moved in on average (years ago)
Renter moved in on average (years ago)
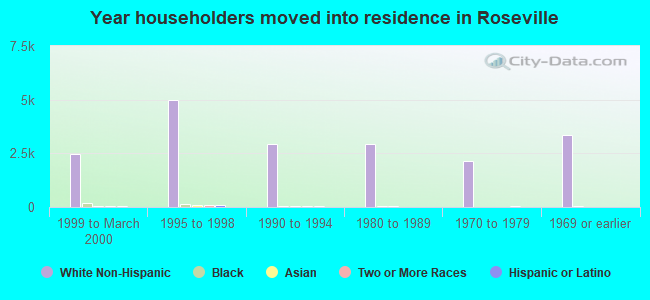
Year householder moved into unit - Moved in 1999 to March 2000 (%)
Year householder moved into unit - Moved in 1999 to March 2000 (%) - White
Year householder moved into unit - Moved in 1999 to March 2000 (%) - Black or African American
Year householder moved into unit - Moved in 1999 to March 2000 (%) - Asian
Year householder moved into unit - Moved in 1999 to March 2000 (%) - Hispanic or Latino
Year householder moved into unit - Moved in 1999 to March 2000 (%) - American Indian and Alaska Native
Year householder moved into unit - Moved in 1999 to March 2000 (%) - Multirace
Year householder moved into unit - Moved in 1999 to March 2000 (%) - Other Race
Year householder moved into unit - Moved in 1995 to 1998 (%)
Year householder moved into unit - Moved in 1995 to 1998 (%) - White
Year householder moved into unit - Moved in 1995 to 1998 (%) - Black or African American
Year householder moved into unit - Moved in 1995 to 1998 (%) - Asian
Year householder moved into unit - Moved in 1995 to 1998 (%) - Hispanic or Latino
Year householder moved into unit - Moved in 1995 to 1998 (%) - American Indian and Alaska Native
Year householder moved into unit - Moved in 1995 to 1998 (%) - Multirace
Year householder moved into unit - Moved in 1995 to 1998 (%) - Other Race
Year householder moved into unit - Moved in 1990 to 1994 (%)
Year householder moved into unit - Moved in 1990 to 1994 (%) - White
Year householder moved into unit - Moved in 1990 to 1994 (%) - Black or African American
Year householder moved into unit - Moved in 1990 to 1994 (%) - Asian
Year householder moved into unit - Moved in 1990 to 1994 (%) - Hispanic or Latino
Year householder moved into unit - Moved in 1990 to 1994 (%) - American Indian and Alaska Native
Year householder moved into unit - Moved in 1990 to 1994 (%) - Multirace
Year householder moved into unit - Moved in 1990 to 1994 (%) - Other Race
Year householder moved into unit - Moved in 1980 to 1989 (%)
Year householder moved into unit - Moved in 1980 to 1989 (%) - White
Year householder moved into unit - Moved in 1980 to 1989 (%) - Black or African American
Year householder moved into unit - Moved in 1980 to 1989 (%) - Asian
Year householder moved into unit - Moved in 1980 to 1989 (%) - Hispanic or Latino
Year householder moved into unit - Moved in 1980 to 1989 (%) - American Indian and Alaska Native
Year householder moved into unit - Moved in 1980 to 1989 (%) - Multirace
Year householder moved into unit - Moved in 1980 to 1989 (%) - Other Race
Year householder moved into unit - Moved in 1970 to 1979 (%)
Year householder moved into unit - Moved in 1970 to 1979 (%) - White
Year householder moved into unit - Moved in 1970 to 1979 (%) - Black or African American
Year householder moved into unit - Moved in 1970 to 1979 (%) - Asian
Year householder moved into unit - Moved in 1970 to 1979 (%) - Hispanic or Latino
Year householder moved into unit - Moved in 1970 to 1979 (%) - American Indian and Alaska Native
Year householder moved into unit - Moved in 1970 to 1979 (%) - Multirace
Year householder moved into unit - Moved in 1970 to 1979 (%) - Other Race
Year householder moved into unit - Moved in 1969 or earlier (%)
Year householder moved into unit - Moved in 1969 or earlier (%) - White
Year householder moved into unit - Moved in 1969 or earlier (%) - Black or African American
Year householder moved into unit - Moved in 1969 or earlier (%) - Asian
Year householder moved into unit - Moved in 1969 or earlier (%) - Hispanic or Latino
Year householder moved into unit - Moved in 1969 or earlier (%) - American Indian and Alaska Native
Year householder moved into unit - Moved in 1969 or earlier (%) - Multirace
Year householder moved into unit - Moved in 1969 or earlier (%) - Other Race
Housing units lacking complete plumbing facilities (%)
Housing units lacking complete kitchen facilities (%)
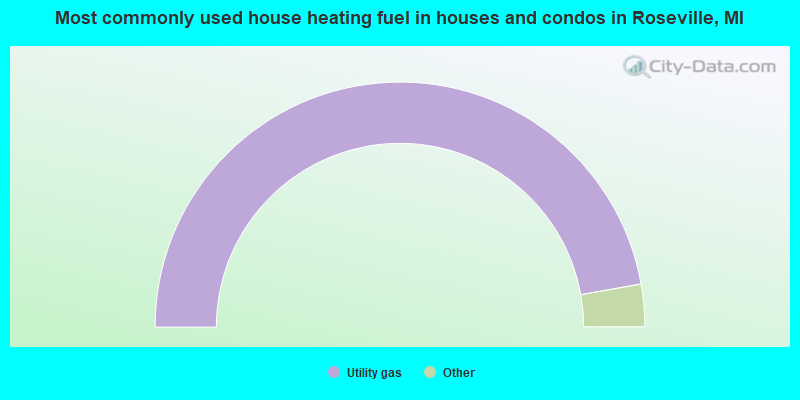
House heating fuel used in houses and condos - Utility gas (%)
House heating fuel used in houses and condos - Bottled, tank, or LP gas (%)
House heating fuel used in houses and condos - Electricity (%)
House heating fuel used in houses and condos - Fuel oil, kerosene, etc. (%)
House heating fuel used in houses and condos - Coal or coke (%)
House heating fuel used in houses and condos - Wood (%)
House heating fuel used in houses and condos - Solar energy (%)
House heating fuel used in houses and condos - Other fuel (%)
House heating fuel used in houses and condos - No fuel used (%)
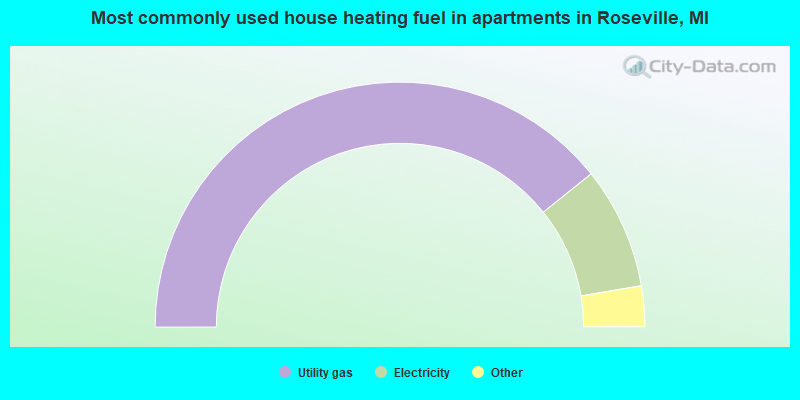
House heating fuel used in apartments - Utility gas (%)
House heating fuel used in apartments - Bottled, tank, or LP gas (%)
House heating fuel used in apartments - Electricity (%)
House heating fuel used in apartments - Fuel oil, kerosene, etc. (%)
House heating fuel used in apartments - Coal or coke (%)
House heating fuel used in apartments - Wood (%)
House heating fuel used in apartments - Solar energy (%)
House heating fuel used in apartments - Other fuel (%)
House heating fuel used in apartments - No fuel used (%)
Latest news about housing in Roseville, MI collected exclusively by city-data.com from local newspapers, TV, and radio stations
Median year house/condo built: 1959Median year apartment built: 1965Household type by relationship:
Households: 47,245
Male householders: 8,985 (3,216 living alone ), Female householders: 11,873 (4,207 living alone )6,861 spouses (6,766 opposite-sex spouses ), 1,779 unmarried partners , (1,703 opposite-sex unmarried partners ), 13,195 children (12,235 natural , 369 adopted , 591 stepchildren ), 952 grandchildren , 653 brothers or sisters , 614 parents , 0 foster children , 841 other relatives , 1,223 non-relatives In group quarters: 265
Size of family households: 5,589 2-persons , 3,147 3-persons , 2,256 4-persons , 763 5-persons , 308 6-persons , 135 7-or-more-persons .
Size of nonfamily households: 7,289 1-person , 1,597 2-persons , 113 3-persons , 50 4-persons .
4,123 married couples with children. single-parent households (960 men , 3,004 women ).
92.8% of residents of Roseville speak English at home. of residents speak Spanish at home (64% speak English very well , 24% speak English well , 12% speak English not well ).of residents speak other Indo-European language at home (61% speak English very well , 28% speak English well , 11% speak English not well ).of residents speak Asian or Pacific Island language at home (62% speak English very well , 18% speak English well , 10% speak English not well , 10% don't speak English at all ).of residents speak other language at home (43% speak English very well , 39% speak English well , 18% speak English not well ).
Foreign born population: 2,045 (4.3%)of them are naturalized citizens )
Median number of rooms in houses and condos:
Median number of rooms in apartments
Owner-occupied Renter-occupied
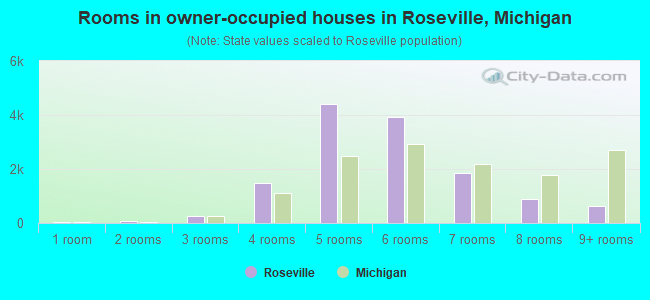
Rooms in owner-occupied houses in Roseville, Michigan
51 1 room 67 2 rooms 241 3 rooms 1,486 4 rooms 4,425 5 rooms 3,944 6 rooms 1,836 7 rooms 873 8 rooms 620 9+ rooms
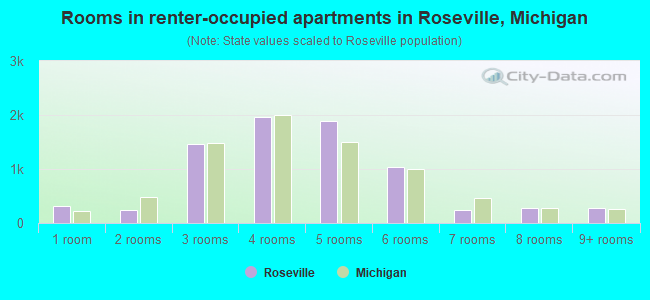
Rooms in renter-occupied apartments in Roseville, Michigan
315 1 room 240 2 rooms 1,456 3 rooms 1,955 4 rooms 1,896 5 rooms 1,043 6 rooms 239 7 rooms 285 8 rooms 275 9+ rooms
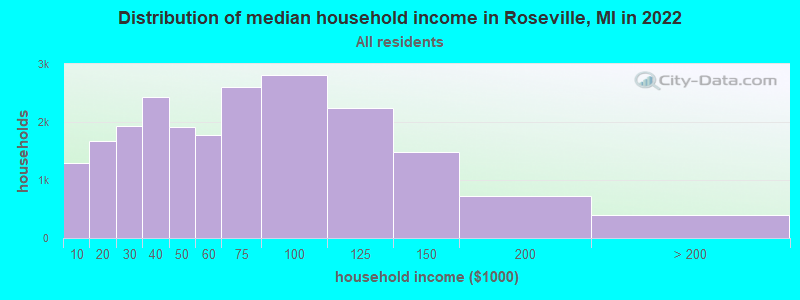
Roseville, MI household income distribution 1,295 Less than $10,0001,673 $10,000 to $19,9991,933 $20,000 to $29,9992,434 $30,000 to $39,9991,920 $40,000 to $49,9991,783 $50,000 to $59,9992,609 $60,000 to $74,9992,804 $75,000 to $99,9992,241 $100,000 to $124,9991,481 $125,000 to $149,999724 $150,000 to $199,999400 $200,000 or more
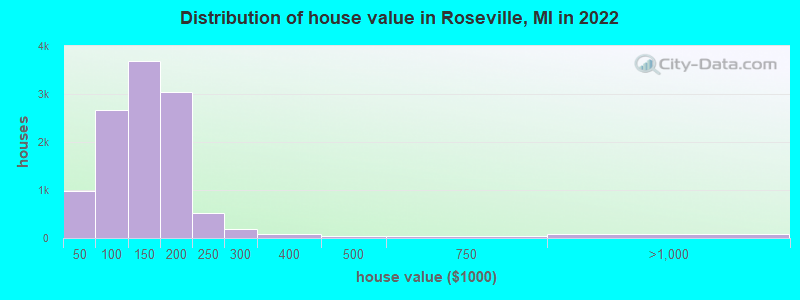
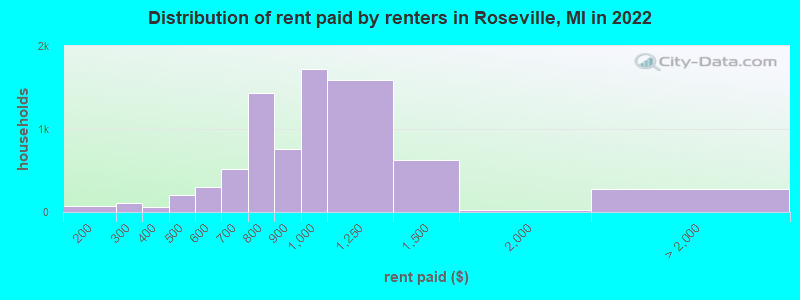
Home value of owner - occupied houses in 2022 in Roseville, MI 209 Less than $10,000122 $10,000 to $14,99964 $15,000 to $19,99922 $20,000 to $24,99956 $25,000 to $29,99948 $30,000 to $34,999110 $35,000 to $39,999338 $40,000 to $49,999444 $50,000 to $59,999329 $60,000 to $69,999312 $70,000 to $79,999855 $80,000 to $89,999393 $90,000 to $99,9991,845 $100,000 to $124,9991,844 $125,000 to $149,9992,123 $150,000 to $174,999910 $175,000 to $199,999524 $200,000 to $249,999195 $250,000 to $299,99974 $300,000 to $399,99933 $400,000 to $499,99952 $500,000 to $749,99931 $750,000 to $999,99910 $1,000,000 to $1,499,99919 $1,500,000 to $1,999,99914 $2,000,000 or moreRent paid by renters in 2022 in Roseville, MI 9 Less than $10016 $100 to $14956 $150 to $19991 $200 to $24913 $250 to $29934 $300 to $34921 $350 to $39950 $400 to $449154 $450 to $499184 $500 to $549113 $550 to $599134 $600 to $649385 $650 to $699620 $700 to $749813 $750 to $799762 $800 to $8991,717 $900 to $9991,594 $1,000 to $1,249621 $1,250 to $1,49920 $1,500 to $1,99993 $2,000 to $2,49911 $3,500 or more175 No cash rent
Percentage of workers working in this county: 63.2%Number of people working at home: 2,240 (9.9% of all workers )
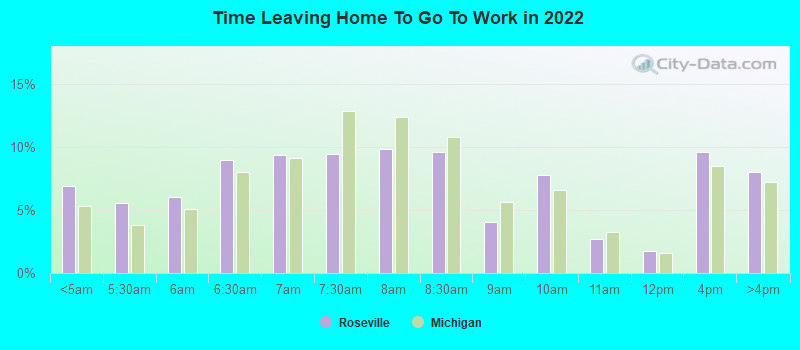
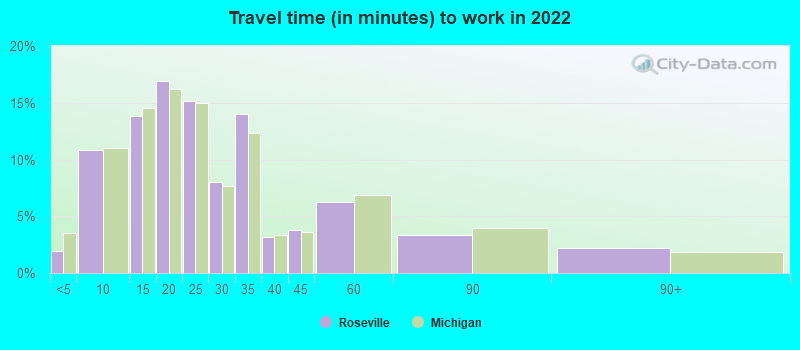
Travel time to work (commute)
Less than 5 minutes: 2185 to 9 minutes: 1,81010 to 14 minutes: 2,03015 to 19 minutes: 3,15920 to 24 minutes: 2,82425 to 29 minutes: 2,14430 to 34 minutes: 3,53835 to 39 minutes: 94240 to 44 minutes: 94045 to 59 minutes: 1,49460 to 89 minutes: 62790 or more minutes: 439
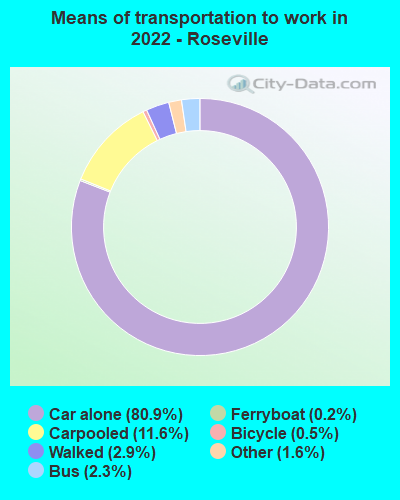
Means of transportation to work:
Drove a car alone: 11,464 (68.9%)Carpooled: 1,734 (10.4%)Bus : 264 (1.6%)Ferryboat: 14 (0.1%)Taxi: 247 (1.5%)Bicycle: 118 (0.7%)Walked: 446 (2.7%)Worked at home: 2,240 (13.5%)
Unemployment by race in 2022
Unemployment rate for White non-Hispanic residents 5.5% Males5.5% FemalesUnemployment rate for Black residents 13.1% Males6.2% FemalesUnemployment rate for Asian residents 2.3% MalesUnemployment rate for other race residents 15.3% MalesUnemployment rate for two or more race residents 6.4% Males1.4% FemalesUnemployment rate for Hispanic or Latino residents 10.1% Males4.0% Females
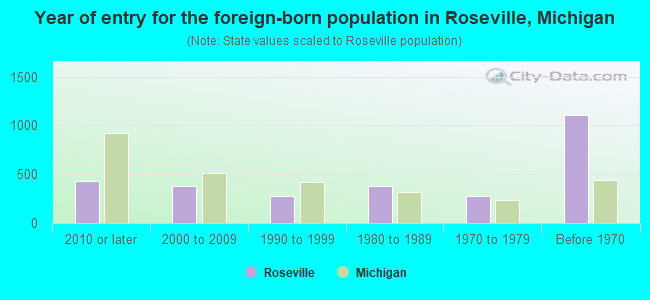
Year of entry for the foreign-born population in Roseville, Michigan
427 2010 or later 381 2000 to 2009 275 1990 to 1999 384 1980 to 1989 274 1970 to 1979 1,106 Before 1970
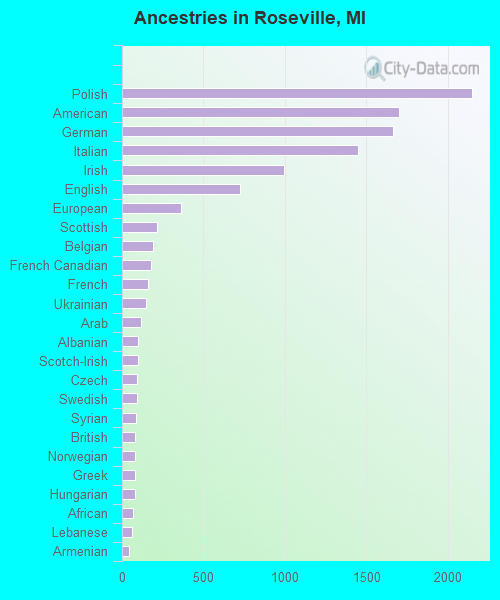
First ancestries reported:
Polish: 2,147 (10.0%)
American: 1,702 (7.9%)
German: 1,667 (7.8%)
Italian: 1,447 (6.7%)
Irish: 994 (4.6%)
English: 724 (3.4%)
European: 361 (1.7%)
Scottish: 213 (1.0%)
Belgian: 188 (0.9%)
French Canadian: 179 (0.8%)
French: 161 (0.8%)
Ukrainian: 148 (0.7%)
Arab: 119 (0.6%)
Albanian: 99 (0.5%)
Scotch-Irish: 96 (0.4%)
Czech: 91 (0.4%)
Swedish: 90 (0.4%)
Syrian: 88 (0.4%)
British: 79 (0.4%)
Norwegian: 78 (0.4%)
Greek: 77 (0.4%)
Hungarian: 77 (0.4%)
African: 68 (0.3%)
Lebanese: 60 (0.3%)
Armenian: 45 (0.2%)
Palestinian: 39 (0.2%)
Jordanian: 36 (0.2%)
Welsh: 30 (0.1%)
Dutch: 25 (0.1%)
Slovak: 24 (0.1%)
Canadian: 21 (0.10%)
Iraqi: 18 (0.08%)
Eastern European: 18 (0.08%)
Nigerian: 17 (0.08%)
Bulgarian: 16 (0.07%)
Finnish: 15 (0.07%)
Lithuanian: 14 (0.07%)
Yugoslavian: 12 (0.06%)
Scandinavian: 11 (0.05%)
South African: 11 (0.05%)
Croatian: 9 (0.04%)
Russian: 9 (0.04%)
Austrian: 8 (0.04%)
Israeli: 7 (0.03%)
Turkish: 7 (0.03%)
Northern European: 6 (0.03%)
Romanian: 4 (0.02%)
Maltese: 3 (0.01%)
Most common places of birth for foreign-born residents (%): Canada Roseville:
12.7% (264)Michigan:
5.0% (35,052)
Ecuador Roseville:
8.6% (179)Michigan:
0.1% (988)
Poland Roseville:
6.1% (128)Michigan:
1.6% (10,857)
Philippines Roseville:
5.8% (120)Michigan:
2.8% (19,112)
Cambodia Roseville:
5.3% (111)Michigan:
0.2% (1,657)
Germany Roseville:
4.4% (91)Michigan:
2.3% (16,126)
India Roseville:
4.3% (90)Michigan:
11.1% (77,240)
Albania Roseville:
3.8% (79)Michigan:
1.9% (12,910)
Mexico Roseville:
3.7% (76)Michigan:
10.9% (75,965)
Iraq Roseville:
3.5% (72)Michigan:
8.1% (55,954)
Italy Roseville:
3.0% (63)Michigan:
1.1% (7,792)
Jordan Roseville:
3.0% (62)Michigan:
0.7% (4,939)
South Africa Roseville:
2.5% (53)Michigan:
0.2% (1,677)
Yemen Roseville:
2.5% (52)Michigan:
3.1% (21,538)
Israel Roseville:
2.4% (49)Michigan:
0.3% (1,942)
Ukraine Roseville:
2.1% (44)Michigan:
1.0% (6,829)
Colombia Roseville:
2.1% (43)Michigan:
0.6% (3,969)
Laos Roseville:
1.6% (33)Michigan:
0.4% (3,027)
Place of birth for U.S.-born residents:
This state: 39,652Other state: 5,099Northeast: 683Midwest: 1,513South: 2,232West: 674 89.8% of Roseville residents lived in the same house 1 years ago.
Out of people who lived in different houses, 40.8% lived in this county.
Out of people who lived in different counties, 62.4% lived in Michigan.
Roseville:
89.8%State average:
88.4%
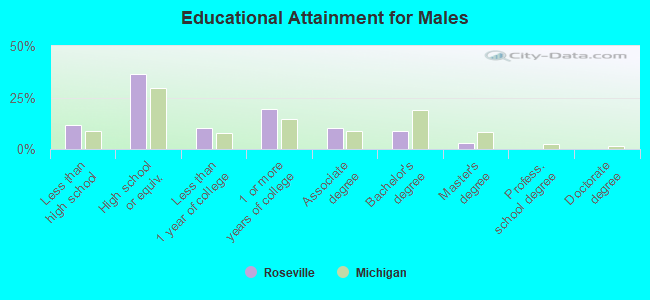
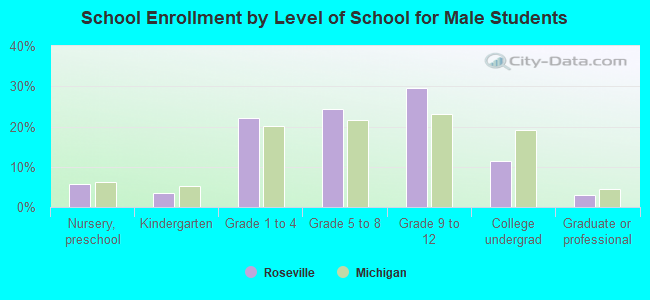
Education attainment for males 25 years and older:
No schooling: 349Nursery to 4th grade: 95th and 6th grade: 977th and 8th grade: 1809th grade: 13410th grade: 37511th grade: 25912th grade, no diploma: 450High school graduate (or equivalency): 5,765Less than 1 year of college: 1,639Some college more than 1 year, no degree: 3,050Associate degree: 1,631Bachelor's degree: 1,367Master's degree: 486Professional school degree: 15Doctorate degree: 20
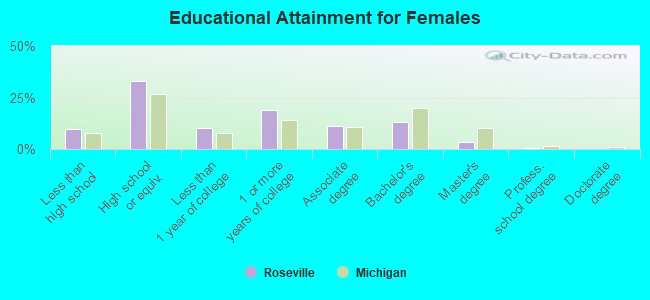
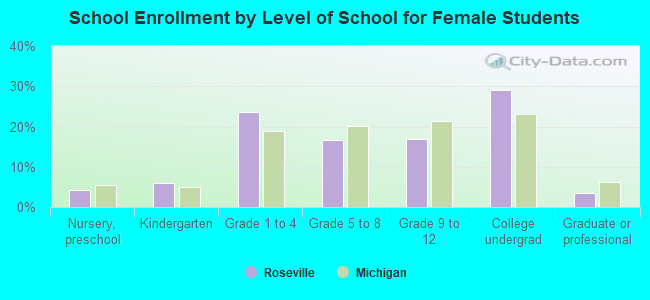
Education attainment for females 25 years and older:
No schooling: 289Nursery to 4th grade: 515th and 6th grade: 577th and 8th grade: 1979th grade: 18410th grade: 17711th grade: 52812th grade, no diploma: 272High school graduate (or equivalency): 5,866Less than 1 year of college: 1,828Some college more than 1 year, no degree: 3,344Associate degree: 1,956Bachelor's degree: 2,324Master's degree: 637Professional school degree: 120Doctorate degree: 20
Housing units in structures:
One, detached: 16,204One, attached: 1,253Two: 4093 or 4: 7315 to 9: 1,84810 to 19: 56820 to 49: 34750 or more: 485Mobile homes: 247Boats, RVs, vans, etc.: 46Median worth of mobile homes: $12,674
Housing units lacking complete plumbing facilities in 2022: 0.6%Housing units lacking complete kitchen facilities in 2022: 0.8%House/condo owner moved in on average 14 years ago
Renter moved in on average 3 years ago
Private vs. public school enrollment:
Students in private schools in grades 1 to 8 (elementary and middle school): 424 Students in private schools in grades 9 to 12 (high school): 95 Students in private undergraduate colleges: 316