Salem, MA (Massachusetts) Houses and Residents
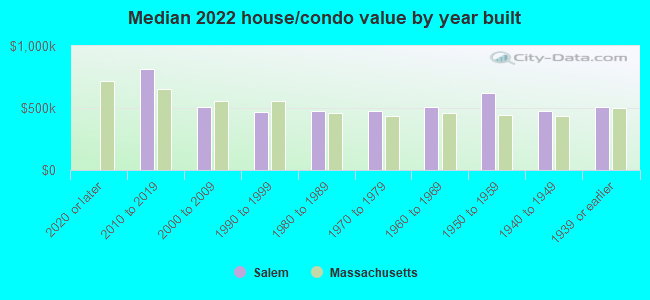
Estimated median house or condo value in 2022: $503,657 (it was $188,300 in 2000 )
Salem:
$503,657Massachusetts:
$534,700
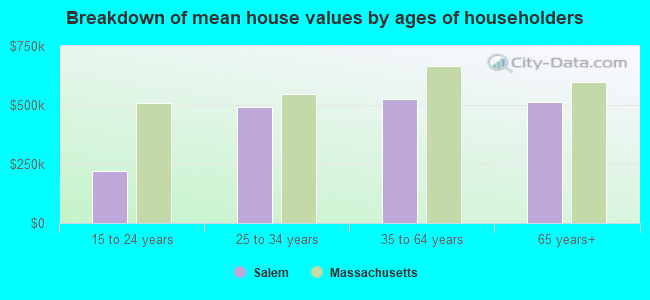
Lower value quartile - upper value quartile: $374,846 - $652,461Mean price in 2022: Detached houses: $578,713 Here:
$578,713State:
$651,570
Townhouses or other attached units: $560,505 Here:
$560,505State:
$617,749
In 2-unit structures: $566,944 Here:
$566,944State:
$594,808
In 3-to-4-unit structures: $505,667 Here:
$505,667State:
$601,912
In 5-or-more-unit structures: $428,162 Here:
$428,162State:
$555,768
Occupied boats, RVs, vans, etc.: $114,185 Here:
$114,185State:
$207,873
Total population: 42,824 (Urban population: 40,407, Rural population: 0)
Houses: 21,293 (20,083 occupied: 10,205 owner occupied, 9,934 renter occupied )
% of renters here:
49%State:
38%
Housing density: 2,627 houses/condos per square mile
Median price asked for vacant for-sale houses and condos in 2022: $423,989.
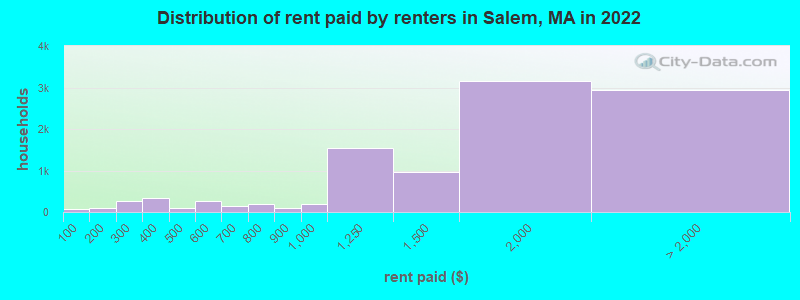
Median contract rent in 2022: $1,670 (lower quartile is $1,186, upper quartile is over $2,000)
Median rent asked for vacant for-rent units in 2022: $2,447
Median gross rent in Salem, MA in 2022: $1,799
Housing units in Salem with a mortgage: 7,487 (1,087 second mortgage, 30 home equity loan, 971 both second mortgage and home equity loan )Houses without a mortgage: 154
Median household income for houses/condos with a mortgage: $130,685
Median household income for apartments without a mortgage: $69,335
Median monthly housing costs: $1,856
Data:
Median house or condo value ($)
Median house or condo value ($ change since 2000)
Median house or condo value ($) - White
Median house or condo value ($) - Black or African American
Median house or condo value ($) - Asian
Median house or condo value ($) - Hispanic or Latino
Median house or condo value ($) - American Indian and Alaska Native
Median house or condo value ($) - Multirace
Median house or condo value ($) - Other Race
Median price asked for mobile homes ($)
Household density (households per square mile)
Mean house or condo value by units in structure - 1, detached ($)
Mean house or condo value by units in structure - 1, attached ($)
Mean house or condo value by units in structure - 2 ($)
Mean house or condo value by units in structure by units in structure - 3 or 4 ($)
Mean house or condo value by units in structure - 5 or more ($)
Mean house or condo value by units in structure - Boat, RV, van, etc. ($)
Mean house or condo value by units in structure - Mobile home ($)
Median contract rent ($)
Median contract rent - Lower quartile ($)
Median contract rent - Upper quartile ($)
Median gross rent ($)
Urban houses (%)
Rural houses (%)
Houses occupied (%)
Houses occupied (% change since 2000)
Houses owner occupied (%)
Houses owner occupied (% change since 2000)
Houses renter occupied (%)
Houses renter occupied (% change since 2000)
Vacant housing units - For rent (%)
Vacant housing units - For rent (% change since 2000)
Vacant housing units - For sale only (%)
Vacant housing units - For sale only (% change since 2000)
Vacant housing units - Rented or sold, not occupied (%)
Vacant housing units - Rented or sold, not occupied (% change since 2000)
Vacant housing units - For seasonal, recreational, or occasional use (%)
Vacant housing units - For seasonal, recreational, or occasional use (% change since 2000)
Vacant housing units - For migrant workers (%)
Vacant housing units - For migrant workers (% change since 2000)
Vacant housing units - Other vacant (%)
Vacant housing units - Other vacant (% change since 2000)
Median monthly housing costs ($)
Median household income for houses/condos with a mortgage ($)
Median household income for houses/condos without a mortgage ($)
Median household income ($)
Median household income ($) - White
Median household income ($) - Black or African American
Median household income ($) - Asian
Median household income ($) - Hispanic or Latino
Median household income ($) - American Indian and Alaska Native
Median household income ($) - Multirace
Median household income ($) - Other Race
Mortgage status - with mortgage (%)
Mortgage status - with second mortgage (%)
Mortgage status - with home equity loan (%)
Mortgage status - with both second mortgage and home equity loan (%)
Mortgage status - without a mortgage (%)
Median year house/condo built
Median year apartment built
Household type by relationship - Male householder living alone (%)
Household type by relationship - Male householder not living alone (%)
Household type by relationship - Female householder living alone (%)
Household type by relationship - Female householder not living alone (%)
Household type by relationship - Opposite-Sex spouse (%)
Household type by relationship - Same-Sex spouse (%)
Household type by relationship - Opposite-Sex unmarried partner (%)
Household type by relationship - Same-Sex unmarried partner (%)
Household type by relationship - In group quarters (%)
Size of family households - 2-person household (%)
Size of family households - 3-person household (%)
Size of family households - 4-person household (%)
Size of family households - 5-person household (%)
Size of family households - 6-person household (%)
Size of family households - 7-or-more-person household (%)
Size of nonfamily households - 1-person household (%)
Size of nonfamily households - 2-person household (%)
Size of nonfamily households - 3-person household (%)
Size of nonfamily households - 4-person household (%)
Size of nonfamily households - 5-person household (%)
Size of nonfamily households - 6-person household (%)
Size of nonfamily households - 7-or-moreperson household (%)
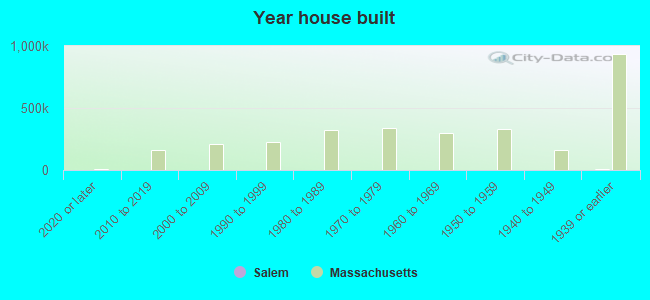
Year house built - Built 2010 or later (%)
Year house built - Built 2000 to 2009 (%)
Year house built - Built 1990 to 1999 (%)
Year house built - Built 1980 to 1989 (%)
Year house built - Built 1970 to 1979 (%)
Year house built - Built 1960 to 1969 (%)
Year house built - Built 1950 to 1959 (%)
Year house built - Built 1940 to 1949 (%)
Year house built - Built 1939 or earlier (%)
Median number of rooms in houses and condos
Median number of rooms in apartments
Median number of bedrooms in owner occupied houses
Mean number of bedrooms in owner occupied houses
Median number of bedrooms in renter occupied houses
Mean number of bedrooms in renter occupied houses
Median number of vehichles in owner occupied houses
Mean number of vehichles in owner occupied houses
Median number of vehichles in renter occupied houses
Mean number of vehichles in renter occupied houses
Rooms in owner-occupied houses - 1 room (%)
Rooms in owner-occupied houses - 2 rooms (%)
Rooms in owner-occupied houses - 3 rooms (%)
Rooms in owner-occupied houses - 4 rooms (%)
Rooms in owner-occupied houses - 5 rooms (%)
Rooms in owner-occupied houses - 6 rooms (%)
Rooms in owner-occupied houses - 7 rooms (%)
Rooms in owner-occupied houses - 8 rooms (%)
Rooms in owner-occupied houses - 9+ rooms (%)
Rooms in renter-occupied houses - 1 room (%)
Rooms in renter-occupied houses - 2 rooms (%)
Rooms in renter-occupied houses - 3 rooms (%)
Rooms in renter-occupied houses - 4 rooms (%)
Rooms in renter-occupied houses - 5 rooms (%)
Rooms in renter-occupied houses - 6 rooms (%)
Rooms in renter-occupied houses - 7 rooms (%)
Rooms in renter-occupied houses - 8 rooms (%)
Rooms in renter-occupied houses - 9+ rooms (%)
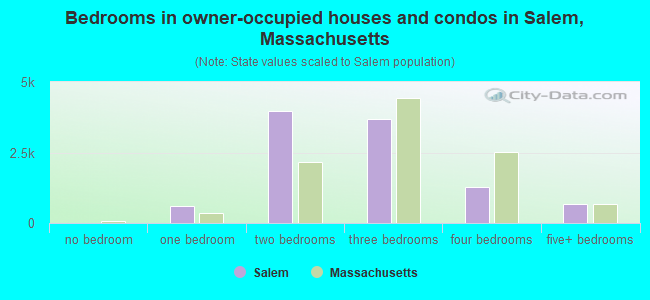
Bedrooms in owner-occupied houses - no bedrooms (%)
Bedrooms in owner-occupied houses - 1 bedroom (%)
Bedrooms in owner-occupied houses - 2 bedrooms (%)
Bedrooms in owner-occupied houses - 3 bedrooms (%)
Bedrooms in owner-occupied houses - 4 bedrooms (%)
Bedrooms in owner-occupied houses - 5+ bedrooms (%)
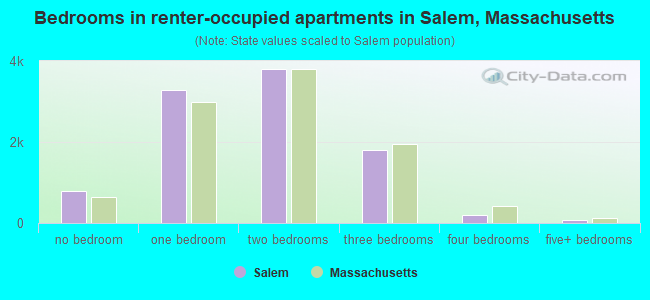
Bedrooms in renter-occupied houses - no bedrooms (%)
Bedrooms in renter-occupied houses - 1 bedroom (%)
Bedrooms in renter-occupied houses - 2 bedrooms (%)
Bedrooms in renter-occupied houses - 3 bedrooms (%)
Bedrooms in renter-occupied houses - 4 bedrooms (%)
Bedrooms in renter-occupied houses - 5+ bedrooms (%)
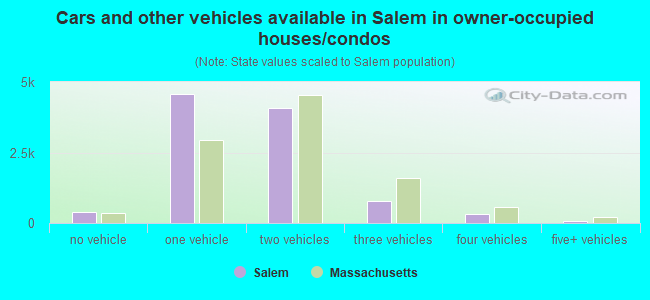
Vehicles available in owner-occupied houses - no vehicle available (%)
Vehicles available in owner-occupied houses - 1 vehicle available(%)
Vehicles available in owner-occupied houses - 2 Vehicles available (%)
Vehicles available in owner-occupied houses - 3 Vehicles available (%)
Vehicles available in owner-occupied houses - 4 Vehicles available (%)
Vehicles available in owner-occupied houses - 5+ Vehicles available (%)
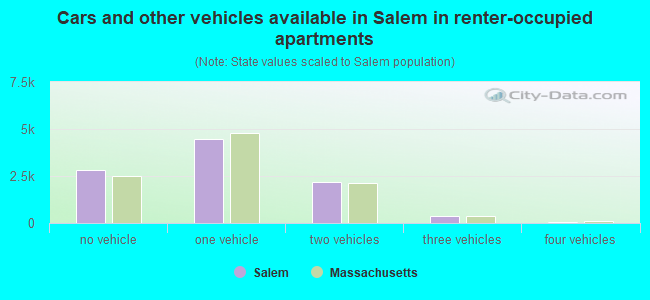
Vehicles available in renter-occupied houses - no vehicle available (%)
Vehicles available in renter-occupied houses - 1 vehicle available (%)
Vehicles available in renter-occupied houses - 2 Vehicles available (%)
Vehicles available in renter-occupied houses - 3 Vehicles available (%)
Vehicles available in renter-occupied houses - 4 Vehicles available (%)
Vehicles available in renter-occupied houses - 5+ Vehicles available (%)
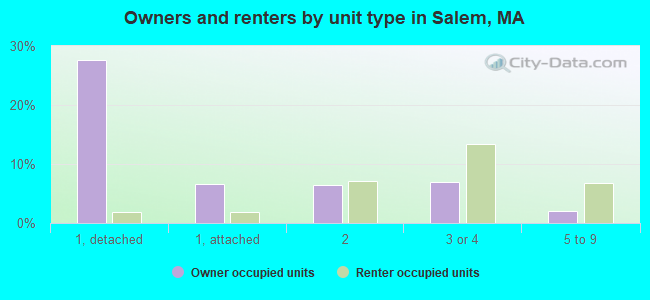
Housing units in structures - 1, detached (%)
Housing units in structures - 1, attached (%)
Housing units in structures - 2 (%)
Housing units in structures - 3 or 4 (%)
Housing units in structures - 5 to 9 (%)
Housing units in structures - 10 to 19 (%)
Housing units in structures - 20 to 49 (%)
Housing units in structures - 50 or more (%)
Housing units in structures - Mobile home (%)
Housing units in structures - Boat, RV, van, etc. (%)
Housing units in structures - Owners - 1, detached (%)
Housing units in structures - Owners - 1, attached (%)
Housing units in structures - Owners - 2 (%)
Housing units in structures - Owners - 3 or 4 (%)
Housing units in structures - Owners - 5 to 9 (%)
Housing units in structures - Owners - 10 to 19 (%)
Housing units in structures - Owners - 20 to 49 (%)
Housing units in structures - Owners - 50 or more (%)
Housing units in structures - Owners - Mobile home (%)
Housing units in structures - Owners - Boat, RV, van, etc. (%)
Housing units in structures - Renters - 1, detached (%)
Housing units in structures - Renters - 1, attached (%)
Housing units in structures - Renters - 2 (%)
Housing units in structures - Renters - 3 or 4 (%)
Housing units in structures - Renters - 5 to 9 (%)
Housing units in structures - Renters - 10 to 19 (%)
Housing units in structures - Renters - 20 to 49 (%)
Housing units in structures - Renters - 50 or more (%)
Housing units in structures - Renters - Mobile home (%)
Housing units in structures - Renters - Boat, RV, van, etc. (%)
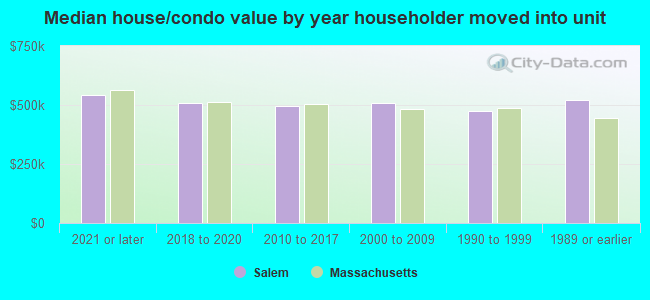
House/condo owner moved in on average (years ago)
Renter moved in on average (years ago)
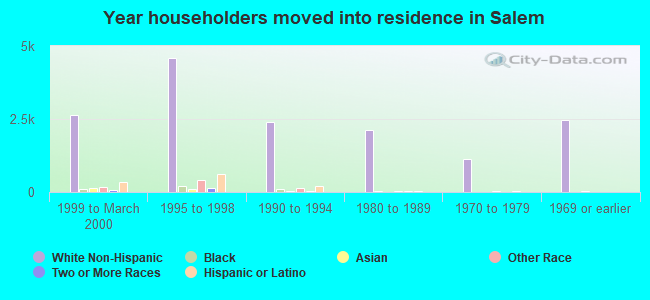
Year householder moved into unit - Moved in 1999 to March 2000 (%)
Year householder moved into unit - Moved in 1999 to March 2000 (%) - White
Year householder moved into unit - Moved in 1999 to March 2000 (%) - Black or African American
Year householder moved into unit - Moved in 1999 to March 2000 (%) - Asian
Year householder moved into unit - Moved in 1999 to March 2000 (%) - Hispanic or Latino
Year householder moved into unit - Moved in 1999 to March 2000 (%) - American Indian and Alaska Native
Year householder moved into unit - Moved in 1999 to March 2000 (%) - Multirace
Year householder moved into unit - Moved in 1999 to March 2000 (%) - Other Race
Year householder moved into unit - Moved in 1995 to 1998 (%)
Year householder moved into unit - Moved in 1995 to 1998 (%) - White
Year householder moved into unit - Moved in 1995 to 1998 (%) - Black or African American
Year householder moved into unit - Moved in 1995 to 1998 (%) - Asian
Year householder moved into unit - Moved in 1995 to 1998 (%) - Hispanic or Latino
Year householder moved into unit - Moved in 1995 to 1998 (%) - American Indian and Alaska Native
Year householder moved into unit - Moved in 1995 to 1998 (%) - Multirace
Year householder moved into unit - Moved in 1995 to 1998 (%) - Other Race
Year householder moved into unit - Moved in 1990 to 1994 (%)
Year householder moved into unit - Moved in 1990 to 1994 (%) - White
Year householder moved into unit - Moved in 1990 to 1994 (%) - Black or African American
Year householder moved into unit - Moved in 1990 to 1994 (%) - Asian
Year householder moved into unit - Moved in 1990 to 1994 (%) - Hispanic or Latino
Year householder moved into unit - Moved in 1990 to 1994 (%) - American Indian and Alaska Native
Year householder moved into unit - Moved in 1990 to 1994 (%) - Multirace
Year householder moved into unit - Moved in 1990 to 1994 (%) - Other Race
Year householder moved into unit - Moved in 1980 to 1989 (%)
Year householder moved into unit - Moved in 1980 to 1989 (%) - White
Year householder moved into unit - Moved in 1980 to 1989 (%) - Black or African American
Year householder moved into unit - Moved in 1980 to 1989 (%) - Asian
Year householder moved into unit - Moved in 1980 to 1989 (%) - Hispanic or Latino
Year householder moved into unit - Moved in 1980 to 1989 (%) - American Indian and Alaska Native
Year householder moved into unit - Moved in 1980 to 1989 (%) - Multirace
Year householder moved into unit - Moved in 1980 to 1989 (%) - Other Race
Year householder moved into unit - Moved in 1970 to 1979 (%)
Year householder moved into unit - Moved in 1970 to 1979 (%) - White
Year householder moved into unit - Moved in 1970 to 1979 (%) - Black or African American
Year householder moved into unit - Moved in 1970 to 1979 (%) - Asian
Year householder moved into unit - Moved in 1970 to 1979 (%) - Hispanic or Latino
Year householder moved into unit - Moved in 1970 to 1979 (%) - American Indian and Alaska Native
Year householder moved into unit - Moved in 1970 to 1979 (%) - Multirace
Year householder moved into unit - Moved in 1970 to 1979 (%) - Other Race
Year householder moved into unit - Moved in 1969 or earlier (%)
Year householder moved into unit - Moved in 1969 or earlier (%) - White
Year householder moved into unit - Moved in 1969 or earlier (%) - Black or African American
Year householder moved into unit - Moved in 1969 or earlier (%) - Asian
Year householder moved into unit - Moved in 1969 or earlier (%) - Hispanic or Latino
Year householder moved into unit - Moved in 1969 or earlier (%) - American Indian and Alaska Native
Year householder moved into unit - Moved in 1969 or earlier (%) - Multirace
Year householder moved into unit - Moved in 1969 or earlier (%) - Other Race
Housing units lacking complete plumbing facilities (%)
Housing units lacking complete kitchen facilities (%)
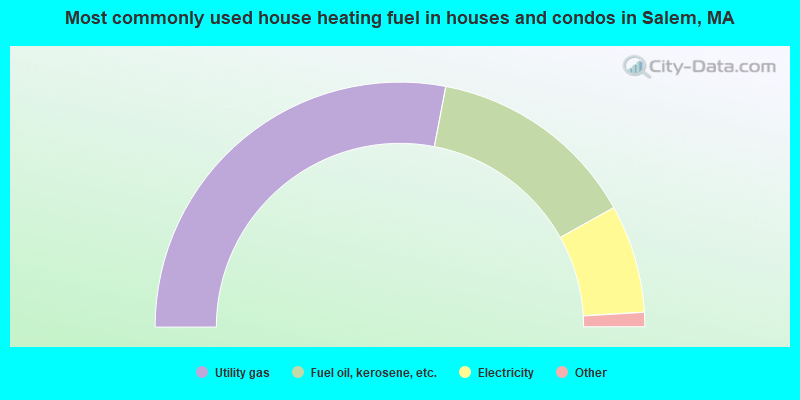
House heating fuel used in houses and condos - Utility gas (%)
House heating fuel used in houses and condos - Bottled, tank, or LP gas (%)
House heating fuel used in houses and condos - Electricity (%)
House heating fuel used in houses and condos - Fuel oil, kerosene, etc. (%)
House heating fuel used in houses and condos - Coal or coke (%)
House heating fuel used in houses and condos - Wood (%)
House heating fuel used in houses and condos - Solar energy (%)
House heating fuel used in houses and condos - Other fuel (%)
House heating fuel used in houses and condos - No fuel used (%)
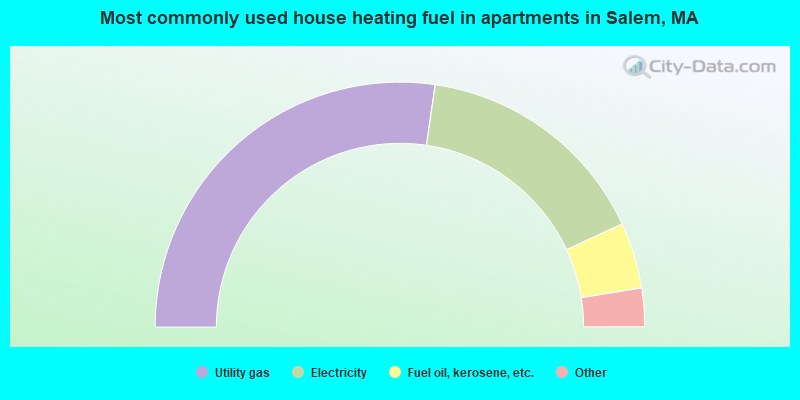
House heating fuel used in apartments - Utility gas (%)
House heating fuel used in apartments - Bottled, tank, or LP gas (%)
House heating fuel used in apartments - Electricity (%)
House heating fuel used in apartments - Fuel oil, kerosene, etc. (%)
House heating fuel used in apartments - Coal or coke (%)
House heating fuel used in apartments - Wood (%)
House heating fuel used in apartments - Solar energy (%)
House heating fuel used in apartments - Other fuel (%)
House heating fuel used in apartments - No fuel used (%)
Latest news about housing in Salem, MA collected exclusively by city-data.com from local newspapers, TV, and radio stations
Median year house/condo built: 1938Median year apartment built: 1949Household type by relationship:
Households: 44,577
Male householders: 7,937 (2,611 living alone ), Female householders: 11,965 (4,541 living alone )7,128 spouses (6,812 opposite-sex spouses ), 1,466 unmarried partners , (1,369 opposite-sex unmarried partners ), 10,702 children (10,196 natural , 79 adopted , 427 stepchildren ), 549 grandchildren , 361 brothers or sisters , 474 parents , 0 foster children , 387 other relatives , 2,190 non-relatives In group quarters: 1,413
Size of family households: 5,043 2-persons , 2,410 3-persons , 1,874 4-persons , 447 5-persons , 261 6-persons , 156 7-or-more-persons .
Size of nonfamily households: 7,706 1-person , 1,794 2-persons , 494 3-persons , 7 4-persons , 11 5-persons .
3,831 married couples with children. single-parent households (247 men , 2,490 women ).
76.5% of residents of Salem speak English at home. of residents speak Spanish at home (46% speak English very well , 21% speak English well , 20% speak English not well , 13% don't speak English at all ).of residents speak other Indo-European language at home (63% speak English very well , 22% speak English well , 14% speak English not well , 1% don't speak English at all ).of residents speak Asian or Pacific Island language at home (48% speak English very well , 22% speak English well , 25% speak English not well , 4% don't speak English at all ).of residents speak other language at home (50% speak English very well , 32% speak English well , 16% speak English not well , 1% don't speak English at all ).
Foreign born population: 6,958 (15.6%)of them are naturalized citizens )
Median number of rooms in houses and condos:
Median number of rooms in apartments
Owner-occupied Renter-occupied
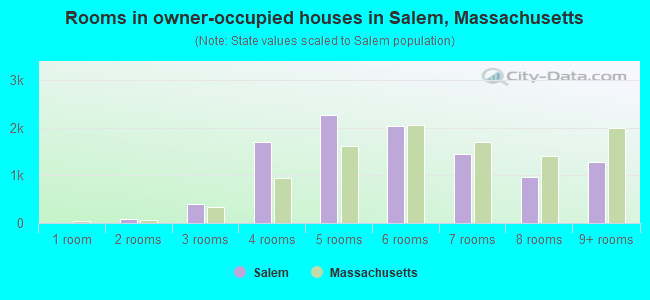
Rooms in owner-occupied houses in Salem, Massachusetts
5 1 room 81 2 rooms 389 3 rooms 1,697 4 rooms 2,271 5 rooms 2,049 6 rooms 1,448 7 rooms 974 8 rooms 1,291 9+ rooms
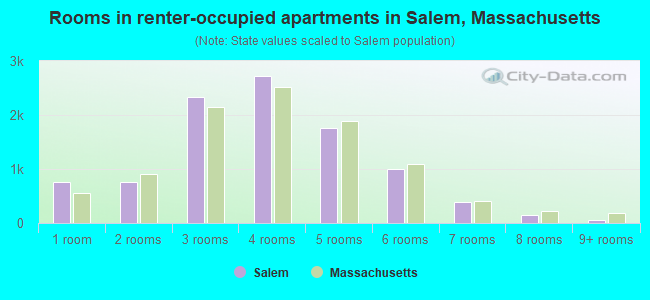
Rooms in renter-occupied apartments in Salem, Massachusetts
760 1 room 752 2 rooms 2,341 3 rooms 2,723 4 rooms 1,758 5 rooms 1,009 6 rooms 392 7 rooms 153 8 rooms 47 9+ rooms
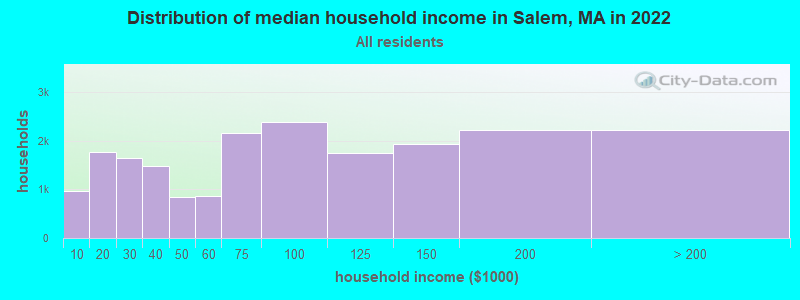
Salem, MA household income distribution 974 Less than $10,0001,758 $10,000 to $19,9991,636 $20,000 to $29,9991,470 $30,000 to $39,999847 $40,000 to $49,999869 $50,000 to $59,9992,161 $60,000 to $74,9992,384 $75,000 to $99,9991,748 $100,000 to $124,9991,941 $125,000 to $149,9992,218 $150,000 to $199,9992,223 $200,000 or more
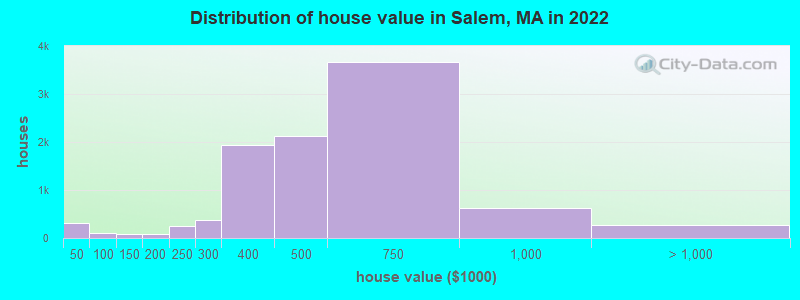
Home value of owner - occupied houses in 2022 in Salem, MA 282 Less than $10,00015 $30,000 to $34,9995 $35,000 to $39,9999 $40,000 to $49,99913 $60,000 to $69,99982 $80,000 to $89,99968 $100,000 to $124,99917 $125,000 to $149,99932 $150,000 to $174,99946 $175,000 to $199,999251 $200,000 to $249,999367 $250,000 to $299,9991,928 $300,000 to $399,9992,135 $400,000 to $499,9993,676 $500,000 to $749,999621 $750,000 to $999,999212 $1,000,000 to $1,499,99961 $2,000,000 or moreRent paid by renters in 2022 in Salem, MA 71 Less than $10053 $100 to $14950 $150 to $199191 $200 to $24981 $250 to $299317 $300 to $34919 $350 to $39995 $400 to $449265 $500 to $5499 $550 to $599120 $600 to $64933 $650 to $69999 $700 to $74982 $750 to $799108 $800 to $899192 $900 to $9991,550 $1,000 to $1,249975 $1,250 to $1,4993,158 $1,500 to $1,9991,851 $2,000 to $2,499659 $2,500 to $2,999221 $3,000 to $3,49971 $3,500 or more128 No cash rent
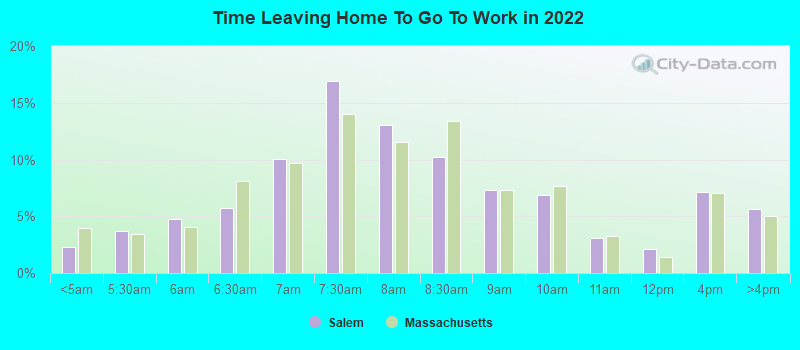
Percentage of workers working in this county: 72.5%Number of people working at home: 5,082 (19.9% of all workers )
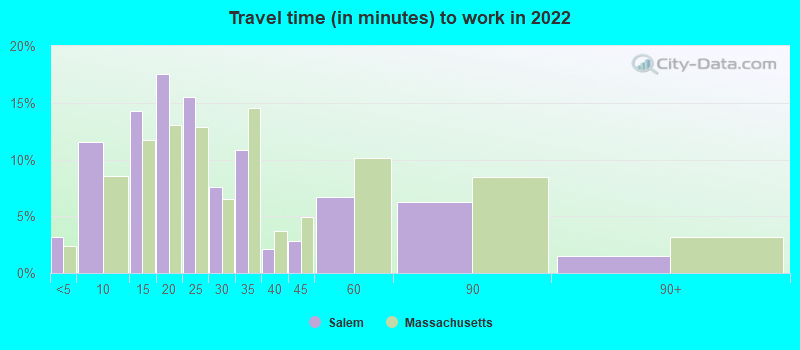
Travel time to work (commute)
Less than 5 minutes: 4225 to 9 minutes: 2,05910 to 14 minutes: 2,46815 to 19 minutes: 3,54220 to 24 minutes: 2,62325 to 29 minutes: 87730 to 34 minutes: 2,28535 to 39 minutes: 42440 to 44 minutes: 93445 to 59 minutes: 1,60160 to 89 minutes: 2,54390 or more minutes: 703
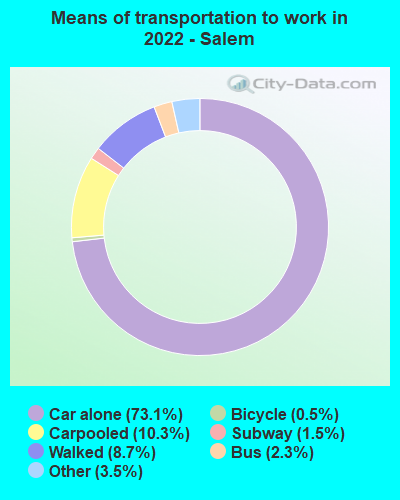
Means of transportation to work:
Drove a car alone: 12,230 (57.2%)Carpooled: 1,310 (6.1%)Bus : 319 (1.5%)Subway or elevated rail : 11 (0.1%)Long-distance train or commuter rail : 239 (1.1%)Taxi: 880 (4.1%)Bicycle: 121 (0.6%)Walked: 1,302 (6.1%)Worked at home: 5,082 (23.8%)
Unemployment by race in 2022
Unemployment rate for White non-Hispanic residents 3.5% Males1.9% FemalesUnemployment rate for Black residents 1.5% Males12.2% FemalesUnemployment rate for American Indian and Alaska Native residents 100.0% FemalesUnemployment rate for other race residents 3.0% Males1.7% FemalesUnemployment rate for two or more race residents 0.9% Males1.6% FemalesUnemployment rate for Hispanic or Latino residents 2.5% Males8.2% Females
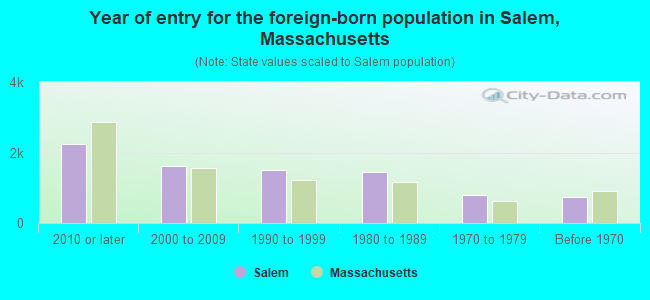
Year of entry for the foreign-born population in Salem, Massachusetts
2,229 2010 or later 1,614 2000 to 2009 1,504 1990 to 1999 1,456 1980 to 1989 801 1970 to 1979 740 Before 1970
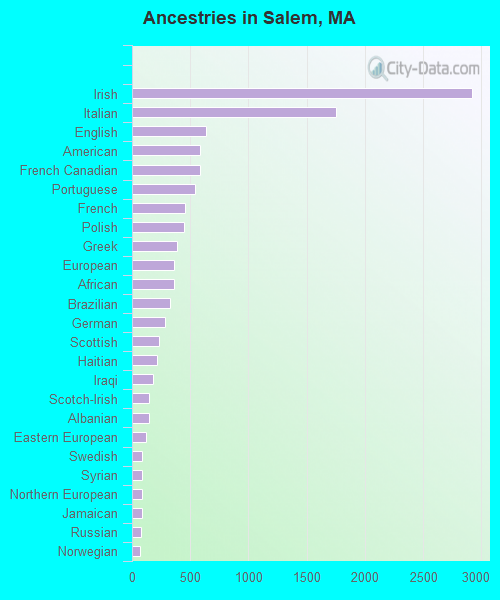
First ancestries reported:
Irish: 2,920 (14.3%)
Italian: 1,756 (8.6%)
English: 638 (3.1%)
American: 588 (2.9%)
French Canadian: 587 (2.9%)
Portuguese: 545 (2.7%)
French: 451 (2.2%)
Polish: 443 (2.2%)
Greek: 389 (1.9%)
European: 364 (1.8%)
African: 358 (1.8%)
Brazilian: 325 (1.6%)
German: 287 (1.4%)
Scottish: 235 (1.1%)
Haitian: 219 (1.1%)
Iraqi: 177 (0.9%)
Scotch-Irish: 146 (0.7%)
Albanian: 143 (0.7%)
Eastern European: 122 (0.6%)
Swedish: 90 (0.4%)
Syrian: 88 (0.4%)
Northern European: 87 (0.4%)
Jamaican: 85 (0.4%)
Russian: 79 (0.4%)
Norwegian: 69 (0.3%)
Romanian: 69 (0.3%)
Ukrainian: 67 (0.3%)
Finnish: 59 (0.3%)
Yugoslavian: 59 (0.3%)
Canadian: 57 (0.3%)
Cape Verdean: 51 (0.2%)
Moroccan: 49 (0.2%)
Turkish: 40 (0.2%)
Danish: 32 (0.2%)
Swiss: 32 (0.2%)
Nigerian: 31 (0.2%)
Hungarian: 30 (0.1%)
Armenian: 26 (0.1%)
Scandinavian: 26 (0.1%)
Cypriot: 25 (0.1%)
British: 24 (0.1%)
Trinidadian and Tobagonian: 23 (0.1%)
Lebanese: 20 (0.10%)
Iranian: 18 (0.09%)
Welsh: 15 (0.07%)
Dutch: 12 (0.06%)
Jordanian: 11 (0.05%)
Czech: 9 (0.04%)
Czechoslovakian: 8 (0.04%)
British West Indian: 8 (0.04%)
Lithuanian: 4 (0.02%)
Guyanese: 3 (0.01%)
Most common places of birth for foreign-born residents (%): Dominican Republic Salem:
38.3% (2,573)Massachusetts:
8.3% (101,767)
Brazil Salem:
10.6% (710)Massachusetts:
7.6% (92,959)
Cameroon Salem:
4.4% (296)Massachusetts:
0.2% (2,679)
Mexico Salem:
2.7% (182)Massachusetts:
1.1% (13,065)
China, excluding Hong Kong and Taiwan Salem:
2.5% (165)Massachusetts:
8.4% (103,233)
Jamaica Salem:
2.3% (153)Massachusetts:
1.7% (21,468)
Colombia Salem:
2.1% (143)Massachusetts:
2.3% (27,810)
El Salvador Salem:
2.1% (140)Massachusetts:
3.7% (45,667)
Iraq Salem:
1.8% (123)Massachusetts:
0.4% (4,735)
Haiti Salem:
1.8% (121)Massachusetts:
4.9% (60,432)
Bangladesh Salem:
1.8% (119)Massachusetts:
0.4% (4,660)
Greece Salem:
1.7% (116)Massachusetts:
0.8% (10,043)
Vietnam Salem:
1.7% (113)Massachusetts:
3.0% (37,197)
Philippines Salem:
1.6% (110)Massachusetts:
0.9% (10,810)
Place of birth for U.S.-born residents:
This state: 27,011Other state: 9,266Northeast: 5,059Midwest: 1,504South: 1,748West: 942 90.0% of Salem residents lived in the same house 1 years ago.
Out of people who lived in different houses, 33.6% lived in this county.
Out of people who lived in different counties, 65.7% lived in Massachusetts.
Salem:
90.0%State average:
87.7%
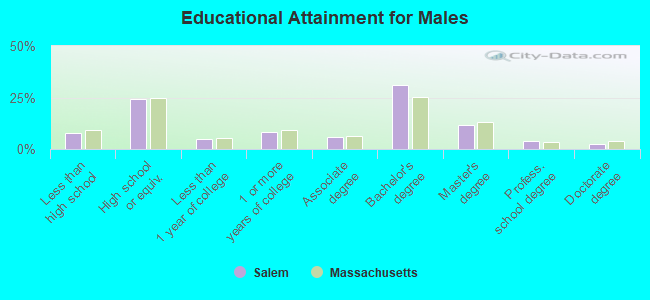
Education attainment for males 25 years and older:
No schooling: 140Nursery to 4th grade: 1855th and 6th grade: 747th and 8th grade: 1249th grade: 10010th grade: 16111th grade: 10312th grade, no diploma: 215High school graduate (or equivalency): 3,493Less than 1 year of college: 699Some college more than 1 year, no degree: 1,175Associate degree: 826Bachelor's degree: 4,419Master's degree: 1,672Professional school degree: 539Doctorate degree: 332
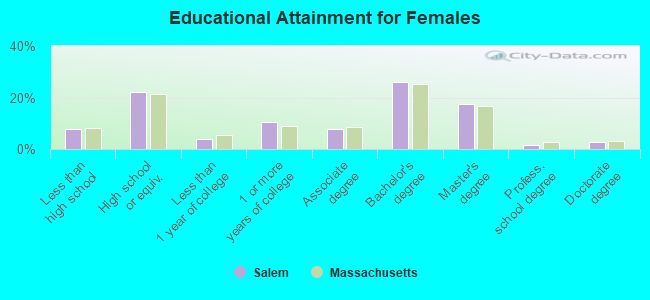
Education attainment for females 25 years and older:
No schooling: 434Nursery to 4th grade: 1235th and 6th grade: 1067th and 8th grade: 1819th grade: 8810th grade: 4411th grade: 15812th grade, no diploma: 247High school graduate (or equivalency): 3,987Less than 1 year of college: 695Some college more than 1 year, no degree: 1,917Associate degree: 1,378Bachelor's degree: 4,690Master's degree: 3,172Professional school degree: 298Doctorate degree: 506
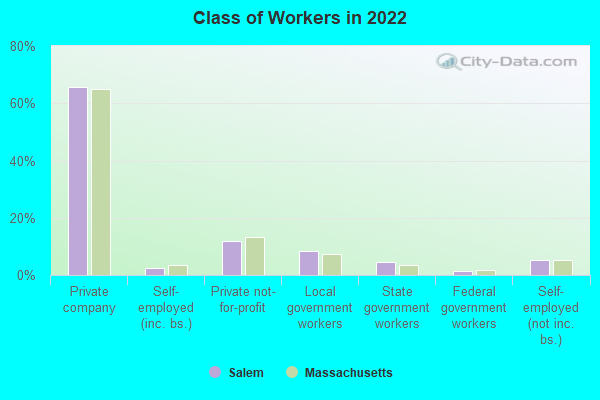
Housing units in structures:
One, detached: 5,424One, attached: 1,479Two: 3,6053 or 4: 4,1005 to 9: 2,19410 to 19: 1,03620 to 49: 1,37450 or more: 2,040Boats, RVs, vans, etc.: 38Housing units lacking complete plumbing facilities in 2022: 0.3%Housing units lacking complete kitchen facilities in 2022: 1.0%House/condo owner moved in on average 10 years ago
Renter moved in on average 3 years ago
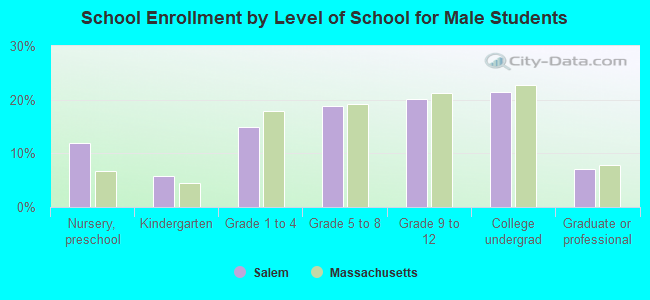
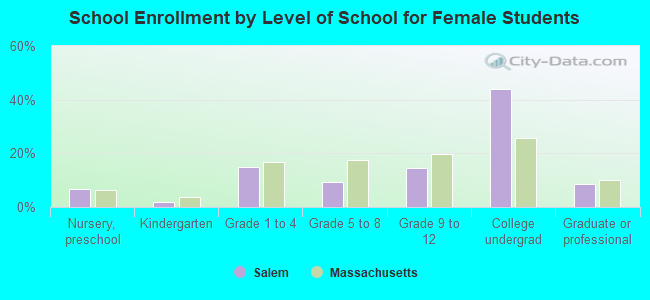
Private vs. public school enrollment:
Students in private schools in grades 1 to 8 (elementary and middle school): 266 Here:
10.6%Massachusetts:
10.3%
Students in private schools in grades 9 to 12 (high school): 357 Here:
23.3%Massachusetts:
12.3%
Students in private undergraduate colleges: 1,060 Here:
35.6%Massachusetts:
51.2%