Santa Fe Springs, CA (California) Houses and Residents
| Santa Fe Springs: | $643,864 |
| California: | $715,900 |
Mean price in 2022:
Detached houses: $596,922
Here: $596,922 State: $988,808 Townhouses or other attached units: $492,431
Here: $492,431 State: $838,546 In 5-or-more-unit structures: $500,734
Here: $500,734 State: $730,996 Mobile homes: $27,948
Here: $27,948 State: $184,506
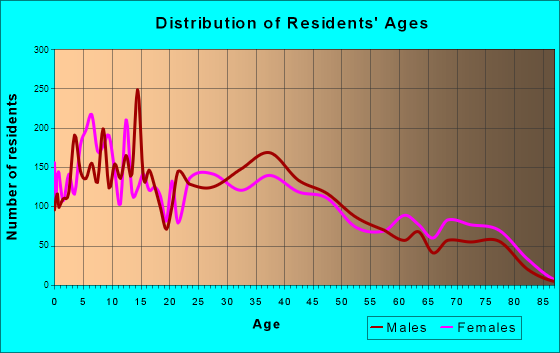
Total population: 17,537 (All urban)
Houses: 5,973 (5,767 occupied: 3,610 owner occupied, 2,178 renter occupied)
| % of renters here: | 38% |
| State: | 44% |
Housing density: 682 houses/condos per square mile
Median price asked for vacant for-sale houses and condos in 2022 in this county: $1,291,802.
Median contract rent in 2022: $1,712 (lower quartile is $1,166, upper quartile is over $2,000)
Median rent asked for vacant for-rent units in 2022: $2,051
Median gross rent in Santa Fe Springs, CA in 2022: $1,839
Housing units in Santa Fe Springs with a mortgage: 2,411 (138 second mortgage, 11 home equity loan, 119 both second mortgage and home equity loan)
Houses without a mortgage: 24
Median household income for houses/condos with a mortgage: $125,112
Median household income for apartments without a mortgage: $72,773
Median monthly housing costs: $1,955
Compare current foreclosures near Santa Fe Springs, CA:
| Photo | Address | Area | Beds / Baths | Price | Details |
|---|---|---|---|---|---|

|
#1
Orr And Day Rd
Santa Fe Springs, CA 90670
|
1,814 sq. feet
|
3 baths 4 beds |
show details | |

|
#2
Bradwell Ave
Santa Fe Springs, CA 90670
|
1,355 sq. feet
|
2 baths 3 beds |
show details | |

|
#3
Millergrove Dr
Santa Fe Springs, CA 90670
|
1,490 sq. feet
|
2 baths 3 beds |
show details | |

|
#4
Flallon Ave
Santa Fe Springs, CA 90670
|
1,269 sq. feet
|
2 baths 3 beds |
show details | |

|
#5
Vicki Dr
Santa Fe Springs, CA 90670
|
1,930 sq. feet
|
3 baths 4 beds |
show details | |

|
#6
Gard Ave
Santa Fe Springs, CA 90670
|
1,000 sq. feet
|
1 baths 3 beds |
show details | |

|
#7
Corby Ave
Santa Fe Springs, CA 90670
|
1,115 sq. feet
|
2 baths 3 beds |
show details | |

|
#8
Bradwell Ave
Santa Fe Springs, CA 90670
|
1,355 sq. feet
|
2 baths 3 beds |
show details | |

|
#9
Buell St
Santa Fe Springs, CA 90670
|
1,490 sq. feet
|
2 baths 3 beds |
show details | |

|
#10
Pioneer Blvd
Santa Fe Springs, CA 90670
|
1,884 sq. feet
|
2 baths 4 beds |
show details |
| Photo | Address | Area | Beds / Baths | Price | Details |
|---|---|---|---|---|---|

|
#11
Pioneer Blvd Unit 8
Santa Fe Springs, CA 90670
|
1,034 sq. feet
|
2 baths 2 beds |
show details | |

|
#12
Glenworth St
Santa Fe Springs, CA 90670
|
1,282 sq. feet
|
2 baths 3 beds |
show details | |

|
#13
Satinwood Ct
Santa Fe Springs, CA 90670
|
- sq. feet
|
- baths - beds |
show details | |

|
#14
Maple Ln
Santa Fe Springs, CA 90670
|
- sq. feet
|
- baths - beds |
show details | |

|
#15
Alburtis Ave # 30
Santa Fe Springs, CA 90670
|
- sq. feet
|
- baths - beds |
show details | |

|
#16
Millbury Ave
Baldwin Park, CA 91706
|
1,632 sq. feet
|
2 baths 4 beds |
$895,000
|
show details |

|
#17
Hawkstone Ave
Whittier, CA 90605
|
1,444 sq. feet
|
2 baths 4 beds |
$674,900
|
show details |

|
#18
E Norma Ave
West Covina, CA 91791
|
1,134 sq. feet
|
2 baths 3 beds |
$599,000
|
show details |

|
#19
Heritage Springs Dr
Santa Fe Springs, CA 90670
|
- sq. feet
|
- baths - beds |
show details | |

|
#20
E Desford St
Carson, CA 90745
|
1,613 sq. feet
|
2 baths 4 beds |
$85,513
|
show details |
| Photo | Address | Area | Beds / Baths | Price | Details |
|---|---|---|---|---|---|

|
#21
Burton Rd
Glendora, CA 91740
|
1,302 sq. feet
|
2 baths 4 beds |
$21,523
|
show details |

|
#22
Mesa Way
Monterey Park, CA 91754
|
1,818 sq. feet
|
3 baths 3 beds |
$30,027
|
show details |

|
#23
W Florence Ave
Los Angeles, CA 90044
|
1,040 sq. feet
|
2 baths 3 beds |
$112,069
|
show details |

|
#24
W 233rd St
Torrance, CA 90501
|
1,350 sq. feet
|
2 baths 2 beds |
$15,199
|
show details |

|
#25
Arvid St
La Puente, CA 91744
|
1,437 sq. feet
|
2 baths 4 beds |
$18,566
|
show details |

|
#26
Armley Ave
Whittier, CA 90603
|
1,461 sq. feet
|
2 baths 2 beds |
$102,885
|
show details |

|
#27
Lexington Gallatin Rd
Pico Rivera, CA 90660
|
1,425 sq. feet
|
2 baths 3 beds |
$23,795
|
show details |

|
#28
Walnut St
El Monte, CA 91731
|
1,012 sq. feet
|
1 baths 2 beds |
$12,525
|
show details |

|
#29
Flint Ave
Long Beach, CA 90814
|
1,365 sq. feet
|
1 baths 2 beds |
$68,525
|
show details |

|
#30
Mobile Ave
Los Angeles, CA 90022
|
1,037 sq. feet
|
3 baths 4 beds |
$37,878
|
show details |
| Photo | Address | Area | Beds / Baths | Price | Details |
|---|---|---|---|---|---|

|
#31
E Holton St
West Covina, CA 91791
|
- sq. feet
|
2 baths 3 beds |
$450,000
|
show details |

|
#32
Elaine Ave
Norwalk, CA 90650
|
1,230 sq. feet
|
2 baths 2 beds |
$65,742
|
show details |

|
#33
Hepburn Ave
Los Angeles, CA 90008
|
1,909 sq. feet
|
2 baths 2 beds |
$23,869
|
show details |

|
#34
N 19th St
Montebello, CA 90640
|
1,141 sq. feet
|
1 baths 3 beds |
$38,542
|
show details |

|
#35
Lafayette St
San Gabriel, CA 91776
|
852 sq. feet
|
1 baths 2 beds |
$14,806
|
show details |

|
#36
Ramona St Unit 7
Bellflower, CA 90706
|
2,493 sq. feet
|
2 baths 3 beds |
$157,255
|
show details |

|
#37
E Vista St
Long Beach, CA 90803
|
1,692 sq. feet
|
2 baths 4 beds |
$67,599
|
show details |

|
#38
Donner Dr
Walnut, CA 91789
|
1,643 sq. feet
|
2 baths 4 beds |
$145,237
|
show details |

|
#39
Parron Ave
Gardena, CA 90249
|
1,058 sq. feet
|
1 baths 3 beds |
$102,148
|
show details |

|
#40
Belle River Dr
Hacienda Heights, CA 91745
|
2,028 sq. feet
|
3 baths 3 beds |
$38,273
|
show details |
| Photo | Address | Area | Beds / Baths | Price | Details |
|---|---|---|---|---|---|

|
#41
W 125th St
Los Angeles, CA 90044
|
1,498 sq. feet
|
2 baths 3 beds |
$11,614
|
show details |

|
#42
Calle Parral
West Covina, CA 91792
|
1,325 sq. feet
|
2 baths 2 beds |
$6,341
|
show details |

|
#43
N Commonwealth Ave
Los Angeles, CA 90004
|
3,937 sq. feet
|
6 baths 6 beds |
show details | |

|
#44
Mira Mar Ave
Long Beach, CA 90814
|
1,902 sq. feet
|
2 baths 4 beds |
show details | |

|
#45
Abourne Rd Apt C
Los Angeles, CA 90008
|
969 sq. feet
|
1 baths 2 beds |
show details | |

|
#46
E 60th St
Los Angeles, CA 90001
|
1,883 sq. feet
|
3 baths 5 beds |
show details | |

|
#47
Redondo Avenue, Units 5-8
Long Beach, CA 90804
|
3,360 sq. feet
|
4 baths 8 beds |
show details | |

|
#48
W Arbor St # 57
Long Beach, CA 90805
|
1,585 sq. feet
|
2 baths 3 beds |
show details | |

|
#49
Norwalk Blvd Apt
Hawaiian Gardens, CA 90716
|
800 sq. feet
|
2 baths 1 beds |
show details | |

|
Check over 1 million property listings on Foreclosure.com!
|
browse all offers | |||


 | Lmao, anyone else frustrated with the housing market? (161 replies) |
| Utterly underwhelmed (108 replies) |
| Safe, family-friendly place to rent when commuting to Whittier/Santa Fe Springs (11 replies) |
| Santa Fe Springs / Housing development photos - 1950s (1 reply) |
| Job relocation to Santa Fe Springs- need school, neighborhood recs (5 replies) |
| Chicago to Santa Fe Springs. (18 replies) |
Median year apartment built: 1974
Household type by relationship:
Households: 18,431- Male householders: 2,815 (586 living alone), Female householders: 2,760 (663 living alone)
2,746 spouses (2,730 opposite-sex spouses), 228 unmarried partners, (197 opposite-sex unmarried partners), 6,064 children (5,868 natural, 13 adopted, 181 stepchildren), 849 grandchildren, 473 brothers or sisters, 766 parents, 25 foster children, 698 other relatives, 748 non-relatives
- In group quarters: 253
Size of family households: 1,352 2-persons, 851 3-persons, 864 4-persons, 562 5-persons, 308 6-persons, 251 7-or-more-persons.
Size of nonfamily households: 1,341 1-person, 150 2-persons, 31 3-persons, 42 5-persons.
2,355 married couples with children.
775 single-parent households (86 men, 689 women).
46.4% of residents of Santa Fe Springs speak English at home.
45.4% of residents speak Spanish at home (65% speak English very well, 16% speak English well, 14% speak English not well, 5% don't speak English at all).
0.8% of residents speak other Indo-European language at home (99% speak English very well, 1% speak English well).
7.0% of residents speak Asian or Pacific Island language at home (60% speak English very well, 25% speak English well, 9% speak English not well, 5% don't speak English at all).
0.9% of residents speak other language at home (100% speak English very well).
Foreign born population: 4,490 (24.4%)
(68.0% of them are naturalized citizens)
| Here: | 5.2 |
| State: | 6.0 |
| Here: | 3.8 |
| State: | 3.9 |

- Bedrooms in owner-occupied houses and condos in Santa Fe Springs, California
- 54no bedroom
- 271 bedroom
- 7012 bedrooms
- 2,2223 bedrooms
- 5384 bedrooms
- 685+ bedrooms

- Bedrooms in renter-occupied apartments in Santa Fe Springs, California
- 180no bedroom
- 7221 bedroom
- 6362 bedrooms
- 6213 bedrooms
- 204 bedrooms
- 05+ bedrooms

- Cars and other vehicles available in Santa Fe Springs in owner-occupied houses/condos
- 98no vehicle
- 6701 vehicle
- 1,6662 vehicles
- 5243 vehicles
- 4054 vehicles
- 2485+ vehicles

- Cars and other vehicles available in Santa Fe Springs in renter-occupied apartments
- 355no vehicle
- 9821 vehicle
- 5012 vehicles
- 2293 vehicles
- 864 vehicles
- 255+ vehicles

- Rooms in owner-occupied houses in Santa Fe Springs, California
- 541 room
- 92 rooms
- 1413 rooms
- 4984 rooms
- 1,4375 rooms
- 8356 rooms
- 3007 rooms
- 1748 rooms
- 1649+ rooms

- Rooms in renter-occupied apartments in Santa Fe Springs, California
- 1801 room
- 1222 rooms
- 6213 rooms
- 6064 rooms
- 3675 rooms
- 1666 rooms
- 987 rooms
- 138 rooms
- 79+ rooms


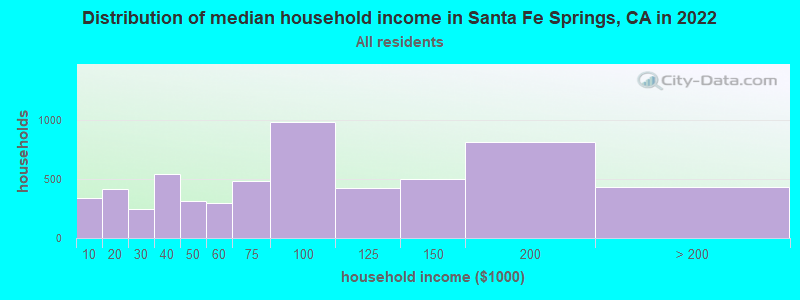
Santa Fe Springs, CA household income distribution

- 338Less than $10,000
- 414$10,000 to $19,999
- 249$20,000 to $29,999
- 541$30,000 to $39,999
- 313$40,000 to $49,999
- 298$50,000 to $59,999
- 482$60,000 to $74,999
- 986$75,000 to $99,999
- 429$100,000 to $124,999
- 498$125,000 to $149,999
- 813$150,000 to $199,999
- 433$200,000 or more
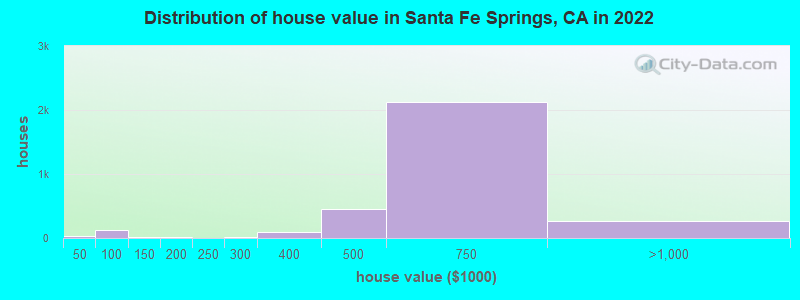
Home value of owner - occupied houses in 2022 in Santa Fe Springs, CA
-
- 13Less than $10,000
- 5$20,000 to $24,999
- 6$25,000 to $29,999
- 10$40,000 to $49,999
- 15$50,000 to $59,999
- 54$60,000 to $69,999
- 12$70,000 to $79,999
- 26$80,000 to $89,999
- 6$100,000 to $124,999
- 4$125,000 to $149,999
- 22$175,000 to $199,999
- 15$250,000 to $299,999
- 89$300,000 to $399,999
- 449$400,000 to $499,999
- 2,119$500,000 to $749,999
- 226$750,000 to $999,999
- 17$1,000,000 to $1,499,999
- 14$2,000,000 or more
Rent paid by renters in 2022 in Santa Fe Springs, CA
-
- 39$250 to $299
- 94$300 to $349
- 52$400 to $449
- 10$450 to $499
- 12$500 to $549
- 20$550 to $599
- 37$650 to $699
- 78$700 to $749
- 4$750 to $799
- 32$800 to $899
- 36$900 to $999
- 145$1,000 to $1,249
- 150$1,250 to $1,499
- 840$1,500 to $1,999
- 443$2,000 to $2,499
- 100$2,500 to $2,999
- 21$3,000 to $3,499
- 6$3,500 or more
- 68No cash rent


Percentage of workers working in this county: 80.6%
Number of people working at home: 1,295 (15.5% of all workers)
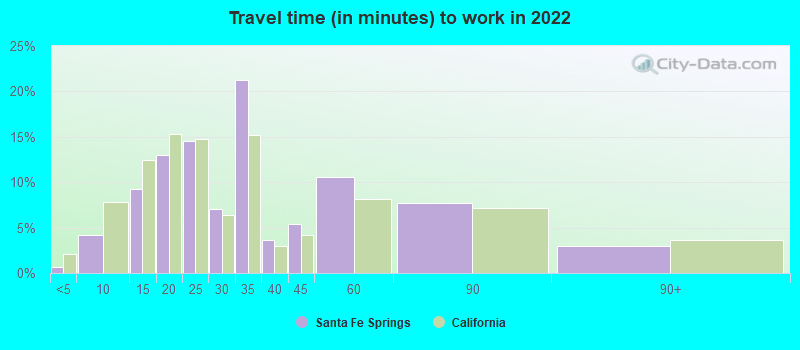
Travel time to work (commute)
- Less than 5 minutes: 33
- 5 to 9 minutes: 494
- 10 to 14 minutes: 665
- 15 to 19 minutes: 780
- 20 to 24 minutes: 1,025
- 25 to 29 minutes: 649
- 30 to 34 minutes: 1,380
- 35 to 39 minutes: 141
- 40 to 44 minutes: 399
- 45 to 59 minutes: 683
- 60 to 89 minutes: 623
- 90 or more minutes: 175
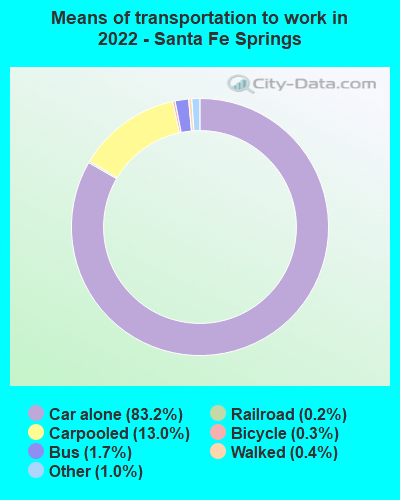
Means of transportation to work:
- Drove a car alone: 38,474 (77.3%)
- Carpooled: 6,643 (13.3%)
- Bus: 717 (1.4%)
- Subway or elevated rail: 33 (0.1%)
- Long-distance train or commuter rail: 23 (0.0%)
- Light rail, streetcar or trolley: 61 (0.1%)
- Taxi: 499 (1.0%)
- Bicycle: 157 (0.3%)
- Walked: 223 (0.4%)
- Worked at home: 1,295 (2.6%)

- Unemployment by race in 2022
- Unemployment rate for White non-Hispanic residents
- 6.4%Males
- 1.6%Females
- Unemployment rate for Black residents
- 30.3%Males
- Unemployment rate for Asian residents
- 8.2%Males
- Unemployment rate for other race residents
- 2.5%Males
- 1.3%Females
- Unemployment rate for two or more race residents
- 3.9%Males
- 2.1%Females
- Unemployment rate for Hispanic or Latino residents
- 4.5%Males
- 1.3%Females

- Year of entry for the foreign-born population in Santa Fe Springs, California
- 5322010 or later
- 6882000 to 2009
- 6261990 to 1999
- 1,4001980 to 1989
- 1,2581970 to 1979
- 991Before 1970

First ancestries reported:
- American: 1,407 (11.3%)
- German: 181 (1.5%)
- South African: 55 (0.4%)
- Irish: 46 (0.4%)
- African: 42 (0.3%)
- English: 39 (0.3%)
- European: 28 (0.2%)
- Norwegian: 23 (0.2%)
- Portuguese: 20 (0.2%)
- Italian: 17 (0.1%)
- Jamaican: 10 (0.08%)
- Ukrainian: 9 (0.07%)
- Dutch: 8 (0.06%)
- Iranian: 8 (0.06%)
- Welsh: 6 (0.05%)
- Israeli: 5 (0.04%)
Most common places of birth for foreign-born residents (%):
| Santa Fe Springs: | 50.3% (2,257) |
| California: | 37.2% (3,881,193) |
| Santa Fe Springs: | 7.7% (345) |
| California: | 3.0% (315,248) |
| Santa Fe Springs: | 7.1% (320) |
| California: | 4.2% (440,287) |
| Santa Fe Springs: | 6.6% (295) |
| California: | 7.8% (818,297) |
| Santa Fe Springs: | 4.9% (219) |
| California: | 0.3% (30,441) |
| Santa Fe Springs: | 3.1% (137) |
| California: | 0.6% (58,161) |
| Santa Fe Springs: | 3.0% (136) |
| California: | 2.8% (290,436) |
| Santa Fe Springs: | 1.8% (80) |
| California: | 0.7% (73,304) |
| Santa Fe Springs: | 1.7% (77) |
| California: | 0.2% (21,276) |
| Santa Fe Springs: | 1.7% (75) |
| California: | 6.6% (684,672) |
| Santa Fe Springs: | 1.6% (72) |
| California: | 0.5% (51,974) |
Place of birth for U.S.-born residents:
- This state: 12,723
- Other state: 1,079
- Northeast: 187
- Midwest: 156
- South: 409
- West: 314
94.0% of Santa Fe Springs residents lived in the same house 1 years ago.
Out of people who lived in different houses, 44.2% lived in this county.
Out of people who lived in different counties, 86.7% lived in California.
| Santa Fe Springs: | 94.0% |
| State average: | 88.9% |
Education attainment for males 25 years and older:
- No schooling: 239
- Nursery to 4th grade: 24
- 5th and 6th grade: 195
- 7th and 8th grade: 28
- 9th grade: 48
- 10th grade: 24
- 11th grade: 147
- 12th grade, no diploma: 463
- High school graduate (or equivalency): 1,766
- Less than 1 year of college: 379
- Some college more than 1 year, no degree: 954
- Associate degree: 610
- Bachelor's degree: 953
- Master's degree: 255
- Professional school degree: 54
- Doctorate degree: 0

Education attainment for females 25 years and older:
- No schooling: 476
- Nursery to 4th grade: 142
- 5th and 6th grade: 155
- 7th and 8th grade: 78
- 9th grade: 50
- 10th grade: 53
- 11th grade: 127
- 12th grade, no diploma: 220
- High school graduate (or equivalency): 1,566
- Less than 1 year of college: 308
- Some college more than 1 year, no degree: 1,091
- Associate degree: 716
- Bachelor's degree: 1,169
- Master's degree: 384
- Professional school degree: 42
- Doctorate degree: 44

Housing units in structures:
- One, detached: 3,707
- One, attached: 441
- Two: 19
- 3 or 4: 130
- 5 to 9: 250
- 10 to 19: 238
- 20 to 49: 154
- 50 or more: 906
- Mobile homes: 124
Median worth of mobile homes: $56,635
House/condo owner moved in on average 16 years ago
Renter moved in on average 4 years ago

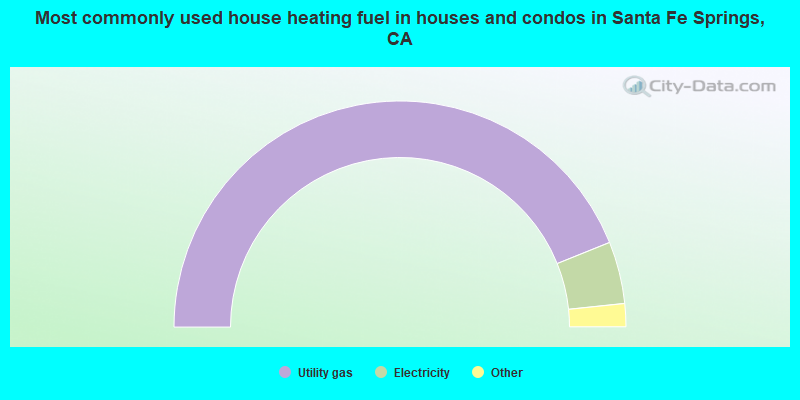
- 87.8%Utility gas
- 8.9%Electricity
- 1.6%No fuel used
- 1.1%Solar energy
- 0.3%Wood
- 0.2%Bottled, tank, or LP gas
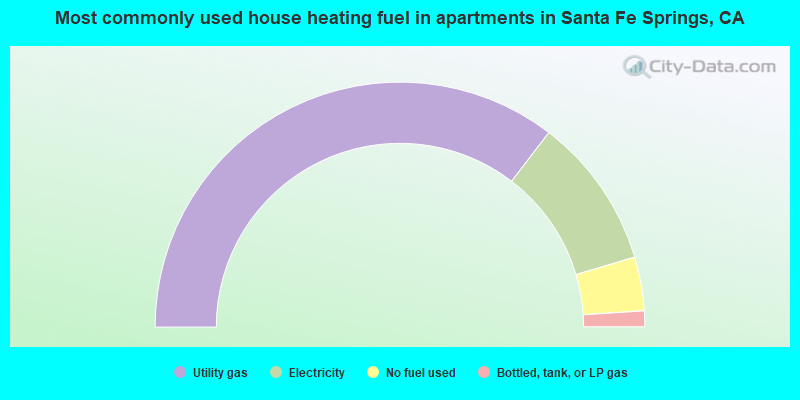
- 70.8%Utility gas
- 20.0%Electricity
- 7.1%No fuel used
- 2.1%Bottled, tank, or LP gas
Private vs. public school enrollment:
| Here: | 9.2% |
| California: | 10.5% |
| Here: | 5.9% |
| California: | 8.5% |
| Here: | 4.5% |
| California: | 15.9% |


