Savannah, GA (Georgia) Houses and Residents
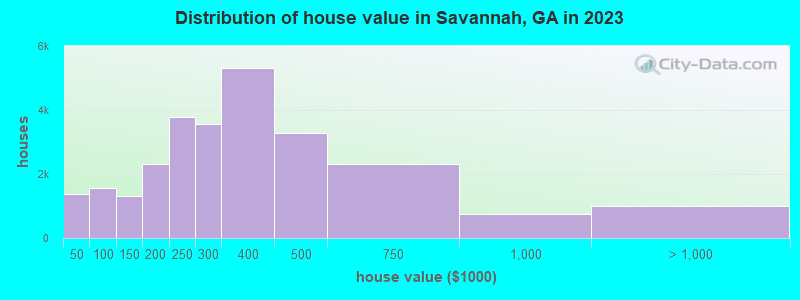
Estimated median house or condo value in 2022: $249,100 (it was $78,300 in 2000 )
Savannah:
$249,100Georgia:
$297,400
Lower value quartile - upper value quartile: $174,100 - $362,600Mean price in 2022: Detached houses: $283,633 Here:
$283,633State:
$376,364
Townhouses or other attached units: $525,104 Here:
$525,104State:
$341,709
In 2-unit structures: $353,176 Here:
$353,176State:
$269,631
In 3-to-4-unit structures: $309,317 Here:
$309,317State:
$250,092
In 5-or-more-unit structures: $327,616 Here:
$327,616State:
$370,730
Mobile homes: $172,652 Here:
$172,652State:
$102,413
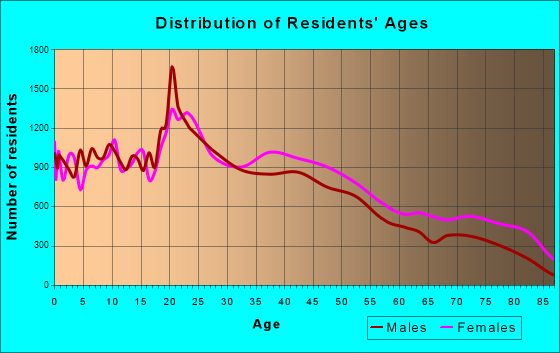
Total population: 144,352 (Urban population: 131,024, Rural population: 579 (all nonfarm) )
Houses: 70,632 (60,764 occupied: 27,830 owner occupied, 32,934 renter occupied )
% of renters here:
54%State:
34%
Housing density: 945 houses/condos per square mile
Median price asked for vacant for-sale houses and condos in 2022: $158,385.
Median contract rent in 2022: $1,005 (lower quartile is $786, upper quartile is $1,404)
Median rent asked for vacant for-rent units in 2022: $1,226
Median gross rent in Savannah, GA in 2022: $1,231
Housing units in Savannah with a mortgage: 17,914 (795 second mortgage, 0 home equity loan, 725 both second mortgage and home equity loan )Houses without a mortgage: 557
Median household income for houses/condos with a mortgage: $79,336
Median household income for apartments without a mortgage: $58,512
Median monthly housing costs: $1,177
Data:
Median house or condo value ($)
Median house or condo value ($ change since 2000)
Median house or condo value ($) - White
Median house or condo value ($) - Black or African American
Median house or condo value ($) - Asian
Median house or condo value ($) - Hispanic or Latino
Median house or condo value ($) - American Indian and Alaska Native
Median house or condo value ($) - Multirace
Median house or condo value ($) - Other Race
Median price asked for mobile homes ($)
Household density (households per square mile)
Mean house or condo value by units in structure - 1, detached ($)
Mean house or condo value by units in structure - 1, attached ($)
Mean house or condo value by units in structure - 2 ($)
Mean house or condo value by units in structure by units in structure - 3 or 4 ($)
Mean house or condo value by units in structure - 5 or more ($)
Mean house or condo value by units in structure - Boat, RV, van, etc. ($)
Mean house or condo value by units in structure - Mobile home ($)
Median contract rent ($)
Median contract rent - Lower quartile ($)
Median contract rent - Upper quartile ($)
Median gross rent ($)
Urban houses (%)
Rural houses (%)
Houses occupied (%)
Houses occupied (% change since 2000)
Houses owner occupied (%)
Houses owner occupied (% change since 2000)
Houses renter occupied (%)
Houses renter occupied (% change since 2000)
Vacant housing units - For rent (%)
Vacant housing units - For rent (% change since 2000)
Vacant housing units - For sale only (%)
Vacant housing units - For sale only (% change since 2000)
Vacant housing units - Rented or sold, not occupied (%)
Vacant housing units - Rented or sold, not occupied (% change since 2000)
Vacant housing units - For seasonal, recreational, or occasional use (%)
Vacant housing units - For seasonal, recreational, or occasional use (% change since 2000)
Vacant housing units - For migrant workers (%)
Vacant housing units - For migrant workers (% change since 2000)
Vacant housing units - Other vacant (%)
Vacant housing units - Other vacant (% change since 2000)
Median monthly housing costs ($)
Median household income for houses/condos with a mortgage ($)
Median household income for houses/condos without a mortgage ($)
Median household income ($)
Median household income ($) - White
Median household income ($) - Black or African American
Median household income ($) - Asian
Median household income ($) - Hispanic or Latino
Median household income ($) - American Indian and Alaska Native
Median household income ($) - Multirace
Median household income ($) - Other Race
Mortgage status - with mortgage (%)
Mortgage status - with second mortgage (%)
Mortgage status - with home equity loan (%)
Mortgage status - with both second mortgage and home equity loan (%)
Mortgage status - without a mortgage (%)
Median year house/condo built
Median year apartment built
Household type by relationship - Male householder living alone (%)
Household type by relationship - Male householder not living alone (%)
Household type by relationship - Female householder living alone (%)
Household type by relationship - Female householder not living alone (%)
Household type by relationship - Opposite-Sex spouse (%)
Household type by relationship - Same-Sex spouse (%)
Household type by relationship - Opposite-Sex unmarried partner (%)
Household type by relationship - Same-Sex unmarried partner (%)
Household type by relationship - In group quarters (%)
Size of family households - 2-person household (%)
Size of family households - 3-person household (%)
Size of family households - 4-person household (%)
Size of family households - 5-person household (%)
Size of family households - 6-person household (%)
Size of family households - 7-or-more-person household (%)
Size of nonfamily households - 1-person household (%)
Size of nonfamily households - 2-person household (%)
Size of nonfamily households - 3-person household (%)
Size of nonfamily households - 4-person household (%)
Size of nonfamily households - 5-person household (%)
Size of nonfamily households - 6-person household (%)
Size of nonfamily households - 7-or-moreperson household (%)
Year house built - Built 2010 or later (%)
Year house built - Built 2000 to 2009 (%)
Year house built - Built 1990 to 1999 (%)
Year house built - Built 1980 to 1989 (%)
Year house built - Built 1970 to 1979 (%)
Year house built - Built 1960 to 1969 (%)
Year house built - Built 1950 to 1959 (%)
Year house built - Built 1940 to 1949 (%)
Year house built - Built 1939 or earlier (%)
Median number of rooms in houses and condos
Median number of rooms in apartments
Median number of bedrooms in owner occupied houses
Mean number of bedrooms in owner occupied houses
Median number of bedrooms in renter occupied houses
Mean number of bedrooms in renter occupied houses
Median number of vehichles in owner occupied houses
Mean number of vehichles in owner occupied houses
Median number of vehichles in renter occupied houses
Mean number of vehichles in renter occupied houses
Rooms in owner-occupied houses - 1 room (%)
Rooms in owner-occupied houses - 2 rooms (%)
Rooms in owner-occupied houses - 3 rooms (%)
Rooms in owner-occupied houses - 4 rooms (%)
Rooms in owner-occupied houses - 5 rooms (%)
Rooms in owner-occupied houses - 6 rooms (%)
Rooms in owner-occupied houses - 7 rooms (%)
Rooms in owner-occupied houses - 8 rooms (%)
Rooms in owner-occupied houses - 9+ rooms (%)
Rooms in renter-occupied houses - 1 room (%)
Rooms in renter-occupied houses - 2 rooms (%)
Rooms in renter-occupied houses - 3 rooms (%)
Rooms in renter-occupied houses - 4 rooms (%)
Rooms in renter-occupied houses - 5 rooms (%)
Rooms in renter-occupied houses - 6 rooms (%)
Rooms in renter-occupied houses - 7 rooms (%)
Rooms in renter-occupied houses - 8 rooms (%)
Rooms in renter-occupied houses - 9+ rooms (%)
Bedrooms in owner-occupied houses - no bedrooms (%)
Bedrooms in owner-occupied houses - 1 bedroom (%)
Bedrooms in owner-occupied houses - 2 bedrooms (%)
Bedrooms in owner-occupied houses - 3 bedrooms (%)
Bedrooms in owner-occupied houses - 4 bedrooms (%)
Bedrooms in owner-occupied houses - 5+ bedrooms (%)
Bedrooms in renter-occupied houses - no bedrooms (%)
Bedrooms in renter-occupied houses - 1 bedroom (%)
Bedrooms in renter-occupied houses - 2 bedrooms (%)
Bedrooms in renter-occupied houses - 3 bedrooms (%)
Bedrooms in renter-occupied houses - 4 bedrooms (%)
Bedrooms in renter-occupied houses - 5+ bedrooms (%)
Vehicles available in owner-occupied houses - no vehicle available (%)
Vehicles available in owner-occupied houses - 1 vehicle available(%)
Vehicles available in owner-occupied houses - 2 Vehicles available (%)
Vehicles available in owner-occupied houses - 3 Vehicles available (%)
Vehicles available in owner-occupied houses - 4 Vehicles available (%)
Vehicles available in owner-occupied houses - 5+ Vehicles available (%)
Vehicles available in renter-occupied houses - no vehicle available (%)
Vehicles available in renter-occupied houses - 1 vehicle available (%)
Vehicles available in renter-occupied houses - 2 Vehicles available (%)
Vehicles available in renter-occupied houses - 3 Vehicles available (%)
Vehicles available in renter-occupied houses - 4 Vehicles available (%)
Vehicles available in renter-occupied houses - 5+ Vehicles available (%)
Housing units in structures - 1, detached (%)
Housing units in structures - 1, attached (%)
Housing units in structures - 2 (%)
Housing units in structures - 3 or 4 (%)
Housing units in structures - 5 to 9 (%)
Housing units in structures - 10 to 19 (%)
Housing units in structures - 20 to 49 (%)
Housing units in structures - 50 or more (%)
Housing units in structures - Mobile home (%)
Housing units in structures - Boat, RV, van, etc. (%)
Housing units in structures - Owners - 1, detached (%)
Housing units in structures - Owners - 1, attached (%)
Housing units in structures - Owners - 2 (%)
Housing units in structures - Owners - 3 or 4 (%)
Housing units in structures - Owners - 5 to 9 (%)
Housing units in structures - Owners - 10 to 19 (%)
Housing units in structures - Owners - 20 to 49 (%)
Housing units in structures - Owners - 50 or more (%)
Housing units in structures - Owners - Mobile home (%)
Housing units in structures - Owners - Boat, RV, van, etc. (%)
Housing units in structures - Renters - 1, detached (%)
Housing units in structures - Renters - 1, attached (%)
Housing units in structures - Renters - 2 (%)
Housing units in structures - Renters - 3 or 4 (%)
Housing units in structures - Renters - 5 to 9 (%)
Housing units in structures - Renters - 10 to 19 (%)
Housing units in structures - Renters - 20 to 49 (%)
Housing units in structures - Renters - 50 or more (%)
Housing units in structures - Renters - Mobile home (%)
Housing units in structures - Renters - Boat, RV, van, etc. (%)
House/condo owner moved in on average (years ago)
Renter moved in on average (years ago)
Year householder moved into unit - Moved in 1999 to March 2000 (%)
Year householder moved into unit - Moved in 1999 to March 2000 (%) - White
Year householder moved into unit - Moved in 1999 to March 2000 (%) - Black or African American
Year householder moved into unit - Moved in 1999 to March 2000 (%) - Asian
Year householder moved into unit - Moved in 1999 to March 2000 (%) - Hispanic or Latino
Year householder moved into unit - Moved in 1999 to March 2000 (%) - American Indian and Alaska Native
Year householder moved into unit - Moved in 1999 to March 2000 (%) - Multirace
Year householder moved into unit - Moved in 1999 to March 2000 (%) - Other Race
Year householder moved into unit - Moved in 1995 to 1998 (%)
Year householder moved into unit - Moved in 1995 to 1998 (%) - White
Year householder moved into unit - Moved in 1995 to 1998 (%) - Black or African American
Year householder moved into unit - Moved in 1995 to 1998 (%) - Asian
Year householder moved into unit - Moved in 1995 to 1998 (%) - Hispanic or Latino
Year householder moved into unit - Moved in 1995 to 1998 (%) - American Indian and Alaska Native
Year householder moved into unit - Moved in 1995 to 1998 (%) - Multirace
Year householder moved into unit - Moved in 1995 to 1998 (%) - Other Race
Year householder moved into unit - Moved in 1990 to 1994 (%)
Year householder moved into unit - Moved in 1990 to 1994 (%) - White
Year householder moved into unit - Moved in 1990 to 1994 (%) - Black or African American
Year householder moved into unit - Moved in 1990 to 1994 (%) - Asian
Year householder moved into unit - Moved in 1990 to 1994 (%) - Hispanic or Latino
Year householder moved into unit - Moved in 1990 to 1994 (%) - American Indian and Alaska Native
Year householder moved into unit - Moved in 1990 to 1994 (%) - Multirace
Year householder moved into unit - Moved in 1990 to 1994 (%) - Other Race
Year householder moved into unit - Moved in 1980 to 1989 (%)
Year householder moved into unit - Moved in 1980 to 1989 (%) - White
Year householder moved into unit - Moved in 1980 to 1989 (%) - Black or African American
Year householder moved into unit - Moved in 1980 to 1989 (%) - Asian
Year householder moved into unit - Moved in 1980 to 1989 (%) - Hispanic or Latino
Year householder moved into unit - Moved in 1980 to 1989 (%) - American Indian and Alaska Native
Year householder moved into unit - Moved in 1980 to 1989 (%) - Multirace
Year householder moved into unit - Moved in 1980 to 1989 (%) - Other Race
Year householder moved into unit - Moved in 1970 to 1979 (%)
Year householder moved into unit - Moved in 1970 to 1979 (%) - White
Year householder moved into unit - Moved in 1970 to 1979 (%) - Black or African American
Year householder moved into unit - Moved in 1970 to 1979 (%) - Asian
Year householder moved into unit - Moved in 1970 to 1979 (%) - Hispanic or Latino
Year householder moved into unit - Moved in 1970 to 1979 (%) - American Indian and Alaska Native
Year householder moved into unit - Moved in 1970 to 1979 (%) - Multirace
Year householder moved into unit - Moved in 1970 to 1979 (%) - Other Race
Year householder moved into unit - Moved in 1969 or earlier (%)
Year householder moved into unit - Moved in 1969 or earlier (%) - White
Year householder moved into unit - Moved in 1969 or earlier (%) - Black or African American
Year householder moved into unit - Moved in 1969 or earlier (%) - Asian
Year householder moved into unit - Moved in 1969 or earlier (%) - Hispanic or Latino
Year householder moved into unit - Moved in 1969 or earlier (%) - American Indian and Alaska Native
Year householder moved into unit - Moved in 1969 or earlier (%) - Multirace
Year householder moved into unit - Moved in 1969 or earlier (%) - Other Race
Housing units lacking complete plumbing facilities (%)
Housing units lacking complete kitchen facilities (%)
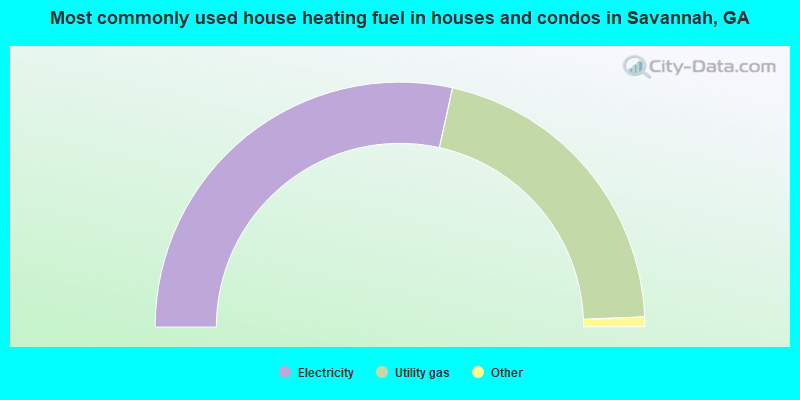
House heating fuel used in houses and condos - Utility gas (%)
House heating fuel used in houses and condos - Bottled, tank, or LP gas (%)
House heating fuel used in houses and condos - Electricity (%)
House heating fuel used in houses and condos - Fuel oil, kerosene, etc. (%)
House heating fuel used in houses and condos - Coal or coke (%)
House heating fuel used in houses and condos - Wood (%)
House heating fuel used in houses and condos - Solar energy (%)
House heating fuel used in houses and condos - Other fuel (%)
House heating fuel used in houses and condos - No fuel used (%)
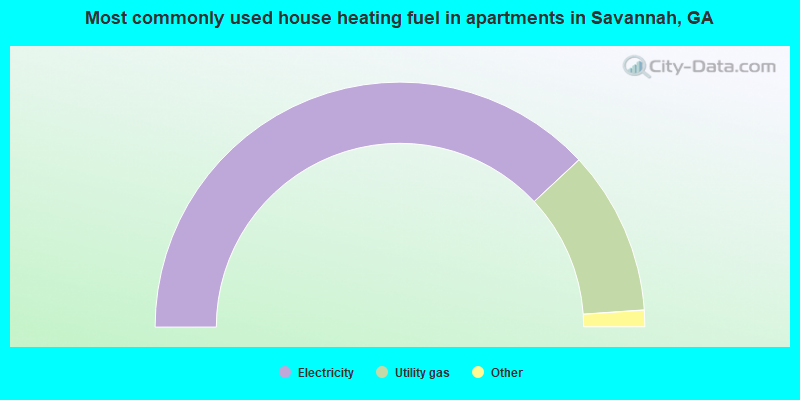
House heating fuel used in apartments - Utility gas (%)
House heating fuel used in apartments - Bottled, tank, or LP gas (%)
House heating fuel used in apartments - Electricity (%)
House heating fuel used in apartments - Fuel oil, kerosene, etc. (%)
House heating fuel used in apartments - Coal or coke (%)
House heating fuel used in apartments - Wood (%)
House heating fuel used in apartments - Solar energy (%)
House heating fuel used in apartments - Other fuel (%)
House heating fuel used in apartments - No fuel used (%)
Latest news about housing in Savannah, GA collected exclusively by city-data.com from local newspapers, TV, and radio stations
Median year house/condo built: 1969Median year apartment built: 1977Household type by relationship:
Households: 147,987
Male householders: 24,018 (9,186 living alone ), Female householders: 36,746 (14,786 living alone )17,333 spouses (17,151 opposite-sex spouses ), 5,406 unmarried partners , (4,880 opposite-sex unmarried partners ), 33,258 children (31,405 natural , 608 adopted , 1,245 stepchildren ), 6,779 grandchildren , 2,643 brothers or sisters , 1,056 parents , 0 foster children , 2,446 other relatives , 6,847 non-relatives In group quarters: 11,455
Size of family households: 16,222 2-persons , 7,067 3-persons , 4,654 4-persons , 1,186 5-persons , 520 6-persons , 572 7-or-more-persons .
Size of nonfamily households: 23,972 1-person , 5,477 2-persons , 580 3-persons , 304 4-persons , 210 6-persons .
7,394 married couples with children. single-parent households (536 men , 11,269 women ).
89.6% of residents of Savannah speak English at home. of residents speak Spanish at home (78% speak English very well , 12% speak English well , 8% speak English not well , 2% don't speak English at all ).of residents speak other Indo-European language at home (80% speak English very well , 8% speak English well , 12% speak English not well ).of residents speak Asian or Pacific Island language at home (53% speak English very well , 32% speak English well , 14% speak English not well , 1% don't speak English at all ).of residents speak other language at home (87% speak English very well , 10% speak English well , 3% don't speak English at all ).
Foreign born population: 8,665 (5.9%)of them are naturalized citizens )
Median number of rooms in houses and condos:
Median number of rooms in apartments
Owner-occupied Renter-occupied
Rooms in owner-occupied houses in Savannah, Georgia
0 1 room 29 2 rooms 488 3 rooms 2,010 4 rooms 5,136 5 rooms 7,169 6 rooms 6,314 7 rooms 2,714 8 rooms 3,970 9+ rooms
Rooms in renter-occupied apartments in Savannah, Georgia
1,293 1 room 2,351 2 rooms 5,172 3 rooms 9,120 4 rooms 4,788 5 rooms 6,345 6 rooms 2,031 7 rooms 1,234 8 rooms 600 9+ rooms
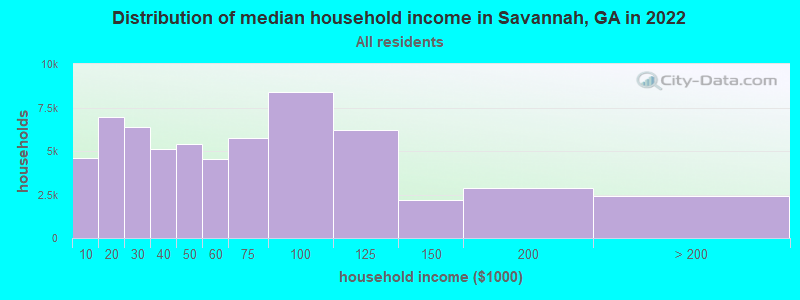
Savannah, GA household income distribution 4,579 Less than $10,0006,954 $10,000 to $19,9996,391 $20,000 to $29,9995,130 $30,000 to $39,9995,417 $40,000 to $49,9994,518 $50,000 to $59,9995,719 $60,000 to $74,9998,409 $75,000 to $99,9996,189 $100,000 to $124,9992,168 $125,000 to $149,9992,882 $150,000 to $199,9992,408 $200,000 or more
Home value of owner - occupied houses in 2022 in Savannah, GA 240 Less than $10,000148 $10,000 to $14,999232 $15,000 to $19,999130 $25,000 to $29,99977 $30,000 to $34,99937 $35,000 to $39,999494 $40,000 to $49,999620 $50,000 to $59,999378 $60,000 to $69,999216 $70,000 to $79,999167 $80,000 to $89,999330 $90,000 to $99,999801 $100,000 to $124,9991,290 $125,000 to $149,9991,865 $150,000 to $174,9991,837 $175,000 to $199,9995,141 $200,000 to $249,9994,218 $250,000 to $299,9994,234 $300,000 to $399,9992,090 $400,000 to $499,9991,648 $500,000 to $749,999571 $750,000 to $999,999891 $1,000,000 to $1,499,999122 $1,500,000 to $1,999,99953 $2,000,000 or moreRent paid by renters in 2022 in Savannah, GA 56 $100 to $149155 $150 to $199457 $200 to $249287 $250 to $299635 $300 to $349507 $350 to $399649 $400 to $449503 $450 to $499501 $500 to $549195 $550 to $5991,248 $600 to $649667 $650 to $6991,047 $700 to $7491,461 $750 to $7994,346 $800 to $8993,091 $900 to $9994,544 $1,000 to $1,2495,660 $1,250 to $1,4994,163 $1,500 to $1,9991,057 $2,000 to $2,499366 $2,500 to $2,999149 $3,000 to $3,49935 $3,500 or more1,155 No cash rent
Percentage of workers working in this county: 94.8%Number of people working at home: 8,606 (12.2% of all workers )
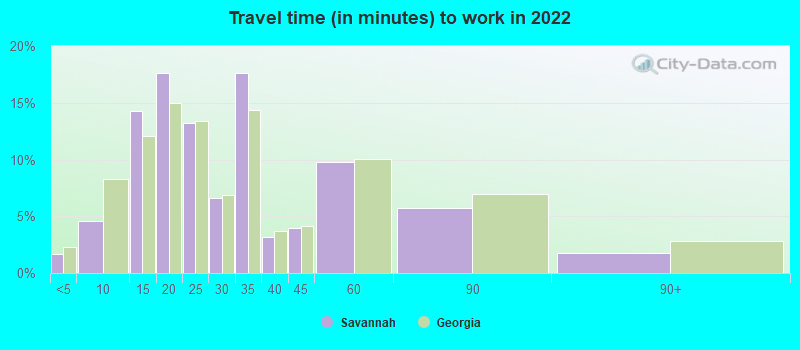
Travel time to work (commute)
Less than 5 minutes: 1,9005 to 9 minutes: 4,77710 to 14 minutes: 11,05715 to 19 minutes: 13,32920 to 24 minutes: 9,38825 to 29 minutes: 4,83330 to 34 minutes: 9,33035 to 39 minutes: 1,89840 to 44 minutes: 1,42045 to 59 minutes: 2,45860 to 89 minutes: 1,00090 or more minutes: 511
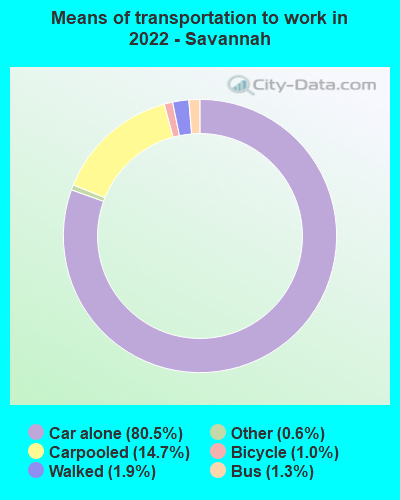
Means of transportation to work:
Drove a car alone: 88,804 (74.6%)Carpooled: 16,277 (13.7%)Bus : 1,390 (1.2%)Taxi: 685 (0.6%)Bicycle: 1,069 (0.9%)Walked: 2,130 (1.8%)Worked at home: 8,606 (7.2%)
Unemployment by race in 2022
Unemployment rate for White non-Hispanic residents 2.5% Males3.1% FemalesUnemployment rate for Black residents 11.5% Males6.3% FemalesUnemployment rate for American Indian and Alaska Native residents 14.2% MalesUnemployment rate for Asian residents 4.1% Males5.1% FemalesUnemployment rate for other race residents 0.6% Males2.3% FemalesUnemployment rate for two or more race residents 31.3% Males3.2% FemalesUnemployment rate for Hispanic or Latino residents 8.0% Males7.2% Females
Year of entry for the foreign-born population in Savannah, Georgia
4,450 2010 or later 2,481 2000 to 2009 1,369 1990 to 1999 1,020 1980 to 1989 505 1970 to 1979 796 Before 1970
First ancestries reported:
English: 4,280 (4.8%)
Irish: 3,651 (4.1%)
American: 3,529 (4.0%)
German: 2,063 (2.3%)
Italian: 1,462 (1.7%)
African: 1,396 (1.6%)
Scottish: 1,030 (1.2%)
European: 920 (1.0%)
Jamaican: 814 (0.9%)
Polish: 565 (0.6%)
Scotch-Irish: 463 (0.5%)
French: 411 (0.5%)
Haitian: 259 (0.3%)
Eastern European: 183 (0.2%)
British: 168 (0.2%)
Greek: 152 (0.2%)
French Canadian: 145 (0.2%)
Swedish: 141 (0.2%)
Welsh: 136 (0.2%)
Dutch: 129 (0.1%)
Russian: 114 (0.1%)
Lebanese: 110 (0.1%)
Iranian: 106 (0.1%)
West Indian: 103 (0.1%)
Norwegian: 101 (0.1%)
Arab: 98 (0.1%)
Austrian: 91 (0.1%)
Ghanaian: 86 (0.10%)
Barbadian: 84 (0.09%)
Ukrainian: 84 (0.09%)
Northern European: 82 (0.09%)
Scandinavian: 82 (0.09%)
Trinidadian and Tobagonian: 66 (0.07%)
Finnish: 62 (0.07%)
Portuguese: 60 (0.07%)
Serbian: 53 (0.06%)
Turkish: 41 (0.05%)
Canadian: 40 (0.05%)
Swiss: 39 (0.04%)
Hungarian: 37 (0.04%)
Lithuanian: 32 (0.04%)
Pennsylvania German: 31 (0.04%)
South African: 29 (0.03%)
Guyanese: 29 (0.03%)
Czech: 20 (0.02%)
Bahamian: 20 (0.02%)
Romanian: 20 (0.02%)
Cajun: 19 (0.02%)
Nigerian: 18 (0.02%)
Palestinian: 17 (0.02%)
Israeli: 17 (0.02%)
Ethiopian: 16 (0.02%)
Moroccan: 16 (0.02%)
Danish: 15 (0.02%)
Australian: 14 (0.02%)
Belgian: 14 (0.02%)
Kenyan: 11 (0.01%)
Zimbabwean: 10 (0.01%)
Cypriot: 10 (0.01%)
Latvian: 9 (0.01%)
Syrian: 8 (0.01%)
Estonian: 8 (0.01%)
Slovak: 7 (0.01%)
Croatian: 6 (0.01%)
Brazilian: 5 (0.01%)
Most common places of birth for foreign-born residents (%): Mexico Savannah:
10.8% (1,032)Georgia:
20.0% (223,400)
Vietnam Savannah:
9.3% (885)Georgia:
4.1% (45,797)
Jamaica Savannah:
7.9% (751)Georgia:
4.6% (51,270)
Philippines Savannah:
6.2% (589)Georgia:
1.8% (20,700)
China, excluding Hong Kong and Taiwan Savannah:
6.0% (570)Georgia:
3.5% (39,227)
India Savannah:
4.9% (472)Georgia:
9.2% (103,325)
Honduras Savannah:
3.6% (344)Georgia:
2.1% (23,500)
Korea Savannah:
3.3% (317)Georgia:
3.9% (43,756)
Canada Savannah:
2.3% (219)Georgia:
1.6% (17,851)
Cuba Savannah:
2.2% (212)Georgia:
1.2% (12,946)
Scotland Savannah:
2.1% (201)Georgia:
0.1% (1,124)
Thailand Savannah:
2.1% (197)Georgia:
0.4% (4,387)
Colombia Savannah:
1.8% (173)Georgia:
2.1% (23,813)
Ireland Savannah:
1.7% (161)Georgia:
0.1% (1,321)
United Kingdom, excluding England and Scotland Savannah:
1.6% (157)Georgia:
0.8% (9,101)
Germany Savannah:
1.6% (155)Georgia:
1.7% (18,651)
England Savannah:
1.5% (144)Georgia:
0.8% (8,849)
Place of birth for U.S.-born residents:
This state: 78,320Other state: 57,987Northeast: 11,508Midwest: 10,447South: 29,774West: 6,258 75.7% of Savannah residents lived in the same house 1 years ago.
Out of people who lived in different houses, 27.0% lived in this county.
Out of people who lived in different counties, 44.3% lived in Georgia.
Savannah:
75.7%State average:
86.6%
Education attainment for males 25 years and older:
No schooling: 433Nursery to 4th grade: 1185th and 6th grade: 1317th and 8th grade: 4039th grade: 1,19310th grade: 1,73211th grade: 58512th grade, no diploma: 300High school graduate (or equivalency): 15,756Less than 1 year of college: 2,829Some college more than 1 year, no degree: 6,587Associate degree: 4,558Bachelor's degree: 6,122Master's degree: 2,949Professional school degree: 1,553Doctorate degree: 725
Education attainment for females 25 years and older:
No schooling: 422Nursery to 4th grade: 05th and 6th grade: 2177th and 8th grade: 4779th grade: 93210th grade: 47511th grade: 1,12012th grade, no diploma: 651High school graduate (or equivalency): 13,331Less than 1 year of college: 4,710Some college more than 1 year, no degree: 9,153Associate degree: 4,255Bachelor's degree: 9,812Master's degree: 6,581Professional school degree: 690Doctorate degree: 517
Housing units in structures:
One, detached: 37,654One, attached: 5,024Two: 5,5633 or 4: 6,2015 to 9: 5,33010 to 19: 3,73620 to 49: 1,80750 or more: 4,261Mobile homes: 1,056Housing units lacking complete plumbing facilities in 2022: 3.5%Housing units lacking complete kitchen facilities in 2022: 4.3%House/condo owner moved in on average 10 years ago
Renter moved in on average 2 years ago
Private vs. public school enrollment:
Students in private schools in grades 1 to 8 (elementary and middle school): 1,406 Students in private schools in grades 9 to 12 (high school): 903 Students in private undergraduate colleges: 7,673