Shipshewana, IN (Indiana) Houses and Residents
| Shipshewana: | $252,463 |
| Indiana: | $208,700 |
Total population: 677 (Urban population: 0, Rural population: 539 (all nonfarm))
Houses: 407 (383 occupied: 234 owner occupied, 154 renter occupied)
| % of renters here: | 40% |
| State: | 29% |
Housing density: 442 houses/condos per square mile
Median price asked for vacant for-sale houses and condos in 2022 in this county: $173,791.
Median contract rent in 2022: $614 (lower quartile is $437, upper quartile is $755)
Median rent asked for vacant for-rent units in 2022: $586
Median gross rent in Shipshewana, IN in 2022: $721
Housing units in Shipshewana with a mortgage: 162 (9 second mortgage, 0 home equity loan, 9 both second mortgage and home equity loan)
Houses without a mortgage: 62
Median household income for houses/condos with a mortgage: $88,406
Median household income for apartments without a mortgage: $71,087
Median monthly housing costs: $933
Compare current foreclosures near Shipshewana, IN:
| Photo | Address | Area | Beds / Baths | Price | Details |
|---|---|---|---|---|---|

|
#1
Grove St
Constantine, MI 49042
|
1,064 sq. feet
|
1 baths 2 beds |
show details | |

|
#2
Monterey Dr
Bristol, IN 46507
|
2,425 sq. feet
|
2 baths 4 beds |
show details | |

|
#3
Stonebridge Dr
Elkhart, IN 46514
|
2,389 sq. feet
|
2 baths 4 beds |
show details | |

|
#4
Quaker St
Constantine, MI 49042
|
1,196 sq. feet
|
2 baths 3 beds |
show details | |

|
#5
S Nottawa Rd
Sturgis, MI 49091
|
- sq. feet
|
1 baths 2 beds |
show details | |

|
#6
Tippecanoe Dr
Goshen, IN 46526
|
1,728 sq. feet
|
1 baths 5 beds |
show details | |

|
#7
Westwood Dr
Goshen, IN 46526
|
1,292 sq. feet
|
1 baths 3 beds |
show details | |

|
#8
Hillside Dr
Lagrange, IN 46761
|
1,296 sq. feet
|
1 baths 3 beds |
show details | |

|
#9
W River Dr
Wawaka, IN 46794
|
2,128 sq. feet
|
1 baths 4 beds |
show details | |

|
#10
Blackhawk Dr
Goshen, IN 46528
|
1,725 sq. feet
|
1 baths 3 beds |
show details |
| Photo | Address | Area | Beds / Baths | Price | Details |
|---|---|---|---|---|---|

|
#11
County Road 33
Middlebury, IN 46540
|
1,524 sq. feet
|
1 baths 3 beds |
show details | |

|
#12
W 2nd St
Ligonier, IN 46767
|
2,486 sq. feet
|
2 baths 4 beds |
show details | |

|
#13
W Pike St
Goshen, IN 46526
|
1,470 sq. feet
|
1 baths 3 beds |
show details | |

|
#14
Bowery St
Ligonier, IN 46767
|
1,902 sq. feet
|
1 baths 2 beds |
show details | |

|
#15
Spring Beach Dr
Rome City, IN 46784
|
720 sq. feet
|
1 baths 1 beds |
show details | |

|
#16
S Main St
Ligonier, IN 46767
|
4,128 sq. feet
|
3 baths 5 beds |
show details | |

|
#17
S Main St
Goshen, IN 46526
|
2,072 sq. feet
|
1 baths 3 beds |
show details | |

|
#18
Water St
Sturgis, MI 49091
|
- sq. feet
|
1 baths 3 beds |
show details | |

|
#19
Mandi Ln
Goshen, IN 46528
|
1,236 sq. feet
|
2 baths 3 beds |
show details | |

|
#20
Cripe Dr
Millersburg, IN 46543
|
1,188 sq. feet
|
1 baths 3 beds |
show details |
| Photo | Address | Area | Beds / Baths | Price | Details |
|---|---|---|---|---|---|

|
#21
W County Line Rd
Wolcottville, IN 46795
|
1,611 sq. feet
|
1 baths 3 beds |
show details | |

|
#22
White Pigeon St
Constantine, MI 49042
|
1 sq. feet
|
1 baths 4 beds |
show details | |

|
#23
Bayberry Dr
Goshen, IN 46526
|
1,400 sq. feet
|
1 baths 3 beds |
show details | |

|
#24
Lexington Dr
Goshen, IN 46526
|
1,680 sq. feet
|
1 baths 3 beds |
show details | |

|
#25
N 100 E
Lagrange, IN 46761
|
1,664 sq. feet
|
1 baths 3 beds |
show details | |

|
#26
Stanford Dr
Bristol, IN 46507
|
1,488 sq. feet
|
1 baths 4 beds |
show details | |

|
#27
Hollister St
Ligonier, IN 46767
|
1,188 sq. feet
|
2 baths 3 beds |
show details | |

|
#28
Caprice Dr
Middlebury, IN 46540
|
1,188 sq. feet
|
1 baths 3 beds |
show details | |

|
#29
S 200 E
Wolcottville, IN 46795
|
720 sq. feet
|
1 baths 2 beds |
show details | |

|
#30
Sequoia Dr
Goshen, IN 46528
|
1,625 sq. feet
|
1 baths 3 beds |
show details |
| Photo | Address | Area | Beds / Baths | Price | Details |
|---|---|---|---|---|---|

|
#31
Kelly Street Ext
Rome City, IN 46784
|
1,424 sq. feet
|
1 baths 2 beds |
show details | |

|
#32
W Us Highway 6
Wawaka, IN 46794
|
1,680 sq. feet
|
2 baths 4 beds |
show details | |

|
#33
Blue Heron Dr
Goshen, IN 46528
|
3,624 sq. feet
|
2 baths 4 beds |
show details | |

|
#34
Hidden Meadow Ln
Middlebury, IN 46540
|
1,334 sq. feet
|
1 baths 3 beds |
show details | |

|
#35
S 400 E
Wolcottville, IN 46795
|
1,973 sq. feet
|
1 baths 4 beds |
show details | |

|
#36
Fieldstone Ln
Middlebury, IN 46540
|
1,238 sq. feet
|
1 baths 3 beds |
show details | |

|
#37
County Road 35
Middlebury, IN 46540
|
2,154 sq. feet
|
1 baths 3 beds |
show details | |

|
#38
Swan St
Bristol, IN 46507
|
1,120 sq. feet
|
1 baths 3 beds |
show details | |

|
#39
Union St
Lagrange, IN 46761
|
1,890 sq. feet
|
2 baths 4 beds |
show details | |

|
#40
N 23rd St
Goshen, IN 46528
|
2,234 sq. feet
|
2 baths 3 beds |
show details |
| Photo | Address | Area | Beds / Baths | Price | Details |
|---|---|---|---|---|---|

|
#41
Turnberry Ave
Bristol, IN 46507
|
1,272 sq. feet
|
1 baths 4 beds |
show details | |

|
#42
Union St
Lagrange, IN 46761
|
1,403 sq. feet
|
1 baths 3 beds |
show details | |

|
#43
S Main St
Goshen, IN 46526
|
1,656 sq. feet
|
- baths 3 beds |
show details | |

|
#44
Franklin St
Goshen, IN 46526
|
2,084 sq. feet
|
- baths 4 beds |
show details | |

|
#45
E Jefferson St
Goshen, IN 46528
|
1,566 sq. feet
|
- baths 2 beds |
show details | |

|
#46
W Oakridge Ave
Goshen, IN 46528
|
1,288 sq. feet
|
- baths 3 beds |
show details | |

|
#47
County Road 19
Goshen, IN 46528
|
1,092 sq. feet
|
- baths 3 beds |
show details | |

|
#48
N 9th St
Goshen, IN 46528
|
1,256 sq. feet
|
- baths 3 beds |
show details | |

|
#49
State Road 15
Goshen, IN 46528
|
1,501 sq. feet
|
- baths 3 beds |
show details | |

|
Check over 1 million property listings on Foreclosure.com!
|
browse all offers | |||

Latest news about housing in Shipshewana, IN collected exclusively by city-data.com from local newspapers, TV, and radio stations

 | Moving to: Marion/Gas City/Huntington? Help! (19 replies) |
| Best Part Of Rural Indiana To Live? (28 replies) |
| Hammond, Elkhart, Indianapolis or Fort Wayne, best place to relocate (10 replies) |
| Information on Indiana requested... (20 replies) |
| From California to Indiana? (193 replies) |
| Antique Flea Market????????? (10 replies) |

Median year apartment built: 1982
Household type by relationship:
Households: 879- Male householders: 208 (25 living alone), Female householders: 172 (74 living alone)
176 spouses (176 opposite-sex spouses), 20 unmarried partners, (20 opposite-sex unmarried partners), 258 children (231 natural, 10 adopted, 17 stepchildren), 0 grandchildren, 0 brothers or sisters, 7 parents, 0 foster children, 6 other relatives, 30 non-relatives
Size of family households: 135 2-persons, 49 3-persons, 38 4-persons, 22 5-persons, 9 6-persons, 8 7-or-more-persons.
Size of nonfamily households: 102 1-person, 17 2-persons, 4 3-persons.
180 married couples with children.
39 single-parent households (4 men, 35 women).
74.7% of residents of Shipshewana speak English at home.
1.8% of residents speak Spanish at home (100% speak English very well).
25.9% of residents speak other Indo-European language at home (92% speak English very well, 7% speak English well, 1% speak English not well).
0.2% of residents speak other language at home (100% speak English well).
Foreign born population: 8 (0.9%)
(12.5% of them are naturalized citizens)
| Here: | 6.8 |
| State: | 6.6 |
| Here: | 4.2 |
| State: | 4.3 |

- Bedrooms in owner-occupied houses and condos in Shipshewana, Indiana
- 0no bedroom
- 21 bedroom
- 462 bedrooms
- 1443 bedrooms
- 284 bedrooms
- 145+ bedrooms

- Bedrooms in renter-occupied apartments in Shipshewana, Indiana
- 7no bedroom
- 661 bedroom
- 302 bedrooms
- 363 bedrooms
- 134 bedrooms
- 25+ bedrooms

- Cars and other vehicles available in Shipshewana in owner-occupied houses/condos
- 18no vehicle
- 811 vehicle
- 1012 vehicles
- 203 vehicles
- 94 vehicles
- 55+ vehicles

- Cars and other vehicles available in Shipshewana in renter-occupied apartments
- 18no vehicle
- 901 vehicle
- 362 vehicles
- 23 vehicles
- 24 vehicles
- 55+ vehicles

- Rooms in owner-occupied houses in Shipshewana, Indiana
- 01 room
- 02 rooms
- 53 rooms
- 234 rooms
- 645 rooms
- 166 rooms
- 337 rooms
- 638 rooms
- 319+ rooms

- Rooms in renter-occupied apartments in Shipshewana, Indiana
- 71 room
- 122 rooms
- 283 rooms
- 374 rooms
- 175 rooms
- 216 rooms
- 277 rooms
- 08 rooms
- 59+ rooms


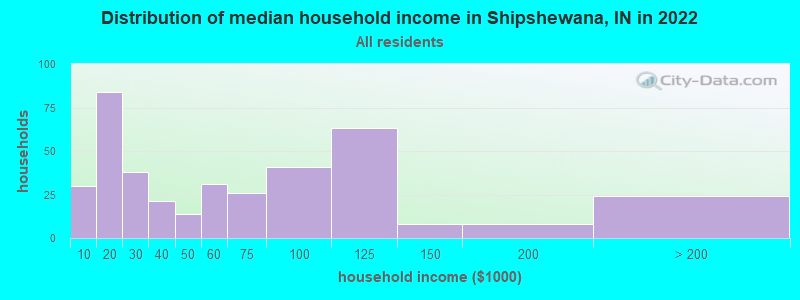
Shipshewana, IN household income distribution

- 30Less than $10,000
- 84$10,000 to $19,999
- 38$20,000 to $29,999
- 21$30,000 to $39,999
- 14$40,000 to $49,999
- 31$50,000 to $59,999
- 26$60,000 to $74,999
- 41$75,000 to $99,999
- 63$100,000 to $124,999
- 8$125,000 to $149,999
- 8$150,000 to $199,999
- 24$200,000 or more
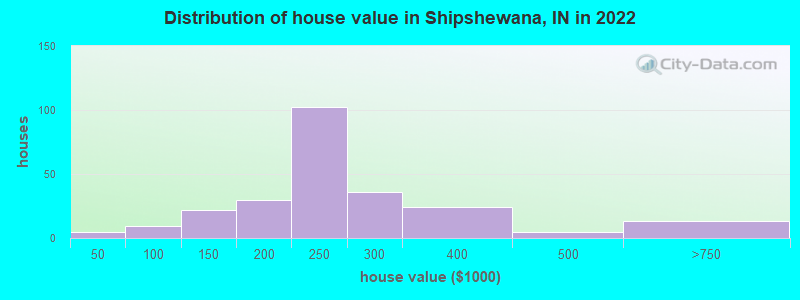
Home value of owner - occupied houses in 2022 in Shipshewana, IN
-
- 1$10,000 to $14,999
- 2$20,000 to $24,999
- 2$40,000 to $49,999
- 4$70,000 to $79,999
- 1$80,000 to $89,999
- 0$90,000 to $99,999
- 5$100,000 to $124,999
- 16$125,000 to $149,999
- 13$150,000 to $174,999
- 16$175,000 to $199,999
- 101$200,000 to $249,999
- 35$250,000 to $299,999
- 24$300,000 to $399,999
- 5$400,000 to $499,999
- 12$500,000 to $749,999
Rent paid by renters in 2022 in Shipshewana, IN
-
- 5$100 to $149
- 8$150 to $199
- 9$250 to $299
- 4$300 to $349
- 8$400 to $449
- 10$450 to $499
- 10$500 to $549
- 3$550 to $599
- 34$600 to $649
- 4$650 to $699
- 4$700 to $749
- 1$750 to $799
- 10$800 to $899
- 2$900 to $999
- 5$1,000 to $1,249
- 12$1,250 to $1,499
- 7No cash rent

Percentage of workers working in this county: 61.2%
Number of people working at home: 7 (1.6% of all workers)
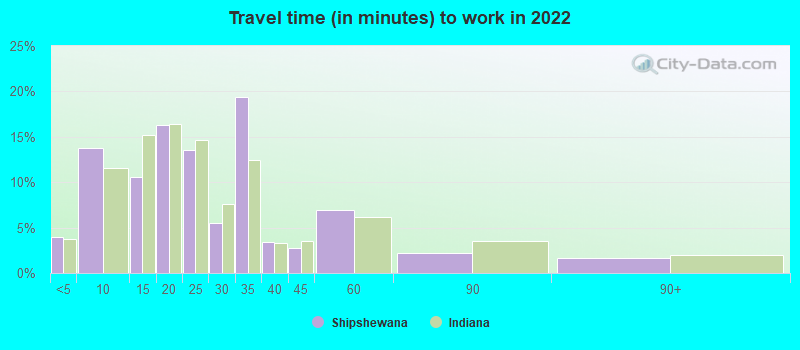
Travel time to work (commute)
- Less than 5 minutes: 39
- 5 to 9 minutes: 84
- 10 to 14 minutes: 54
- 15 to 19 minutes: 72
- 20 to 24 minutes: 54
- 25 to 29 minutes: 31
- 30 to 34 minutes: 46
- 35 to 39 minutes: 17
- 40 to 44 minutes: 5
- 45 to 59 minutes: 6
- 60 to 89 minutes: 0
- 90 or more minutes: 2
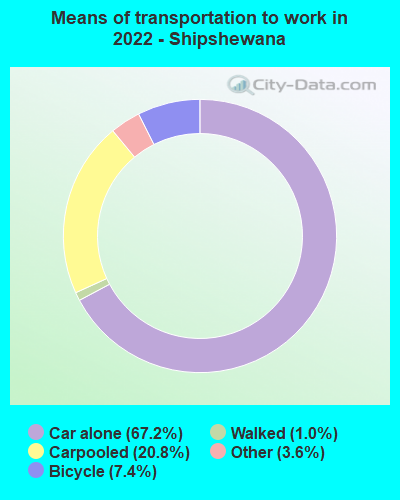
Means of transportation to work:
- Drove a car alone: 1,379 (64.5%)
- Carpooled: 470 (22.0%)
- Taxi: 87 (4.1%)
- Bicycle: 177 (8.3%)
- Walked: 20 (0.9%)
- Worked at home: 7 (0.3%)
- Unemployment by race in 2022
- Unemployment rate for White non-Hispanic residents
- 6.9%Males
- 3.0%Females
- Unemployment rate for two or more race residents
- 100.0%Females

- Year of entry for the foreign-born population in Shipshewana, Indiana
- 62010 or later
- 22000 to 2009
- 11990 to 1999
- 01980 to 1989
- 01970 to 1979
- 0Before 1970

First ancestries reported:
- German: 148 (28.1%)
- European: 112 (21.2%)
- English: 108 (20.5%)
- American: 41 (7.8%)
- Pennsylvania German: 27 (5.1%)
- Swiss: 10 (1.9%)
- Dutch: 6 (1.1%)
- Swedish: 3 (0.6%)
- Danish: 2 (0.4%)
- Polish: 2 (0.4%)
- British: 1 (0.2%)
- Finnish: 1 (0.2%)
- French: 1 (0.2%)
- Irish: 1 (0.2%)
Most common places of birth for foreign-born residents (%):
| Shipshewana: | 75.0% (6) |
| Indiana: | 0.4% (1,469) |
| Shipshewana: | 37.5% (3) |
| Indiana: | 27.0% (101,996) |
| Shipshewana: | 12.5% (1) |
| Indiana: | 0.0% (160) |
Place of birth for U.S.-born residents:
- This state: 586
- Other state: 279
- Northeast: 22
- Midwest: 198
- South: 37
- West: 23
82.6% of Shipshewana residents lived in the same house 1 years ago.
Out of people who lived in different houses, 21.0% lived in this county.
Out of people who lived in different counties, 85.6% lived in Indiana.
| Shipshewana: | 82.6% |
| State average: | 87.1% |
Education attainment for males 25 years and older:
- No schooling: 8
- Nursery to 4th grade: 0
- 5th and 6th grade: 0
- 7th and 8th grade: 40
- 9th grade: 0
- 10th grade: 8
- 11th grade: 0
- 12th grade, no diploma: 4
- High school graduate (or equivalency): 91
- Less than 1 year of college: 11
- Some college more than 1 year, no degree: 76
- Associate degree: 34
- Bachelor's degree: 26
- Master's degree: 6
- Professional school degree: 0
- Doctorate degree: 0

Education attainment for females 25 years and older:
- No schooling: 2
- Nursery to 4th grade: 0
- 5th and 6th grade: 0
- 7th and 8th grade: 55
- 9th grade: 6
- 10th grade: 2
- 11th grade: 0
- 12th grade, no diploma: 1
- High school graduate (or equivalency): 126
- Less than 1 year of college: 16
- Some college more than 1 year, no degree: 13
- Associate degree: 43
- Bachelor's degree: 23
- Master's degree: 6
- Professional school degree: 2
- Doctorate degree: 0


Housing units in structures:
- One, detached: 252
- One, attached: 27
- Two: 34
- 3 or 4: 14
- 5 to 9: 44
- 10 to 19: 11
- 20 to 49: 11
- Mobile homes: 11
House/condo owner moved in on average 10 years ago
Renter moved in on average 3 years ago

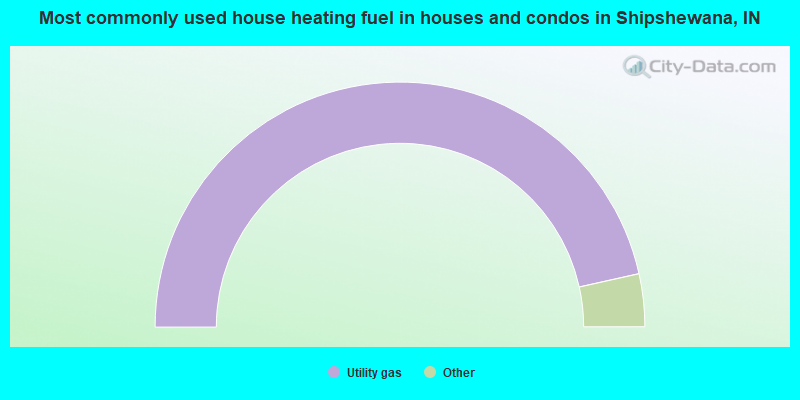
- 93.4%Utility gas
- 3.9%Electricity
- 1.8%Wood
- 0.9%Other fuel
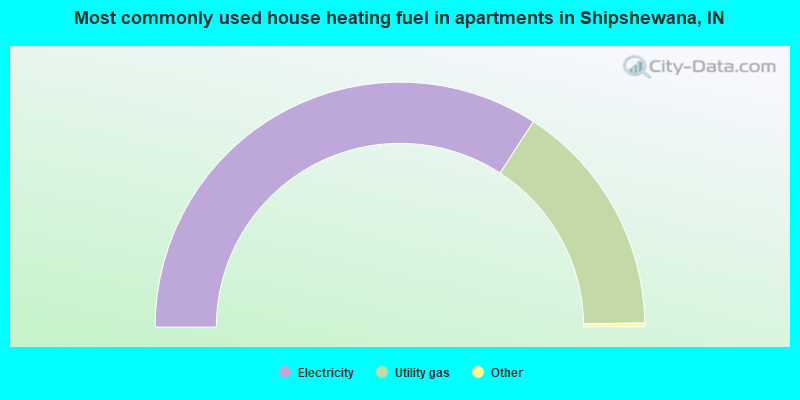
- 68.7%Electricity
- 31.3%Utility gas
Private vs. public school enrollment:
| Here: | 16.0% |
| Indiana: | 14.9% |
| Here: | 18.8% |
| Indiana: | 11.4% |
| Here: | 0.0% |
| Indiana: | 22.3% |


