Housing density: 1,883 houses/condos per square mile
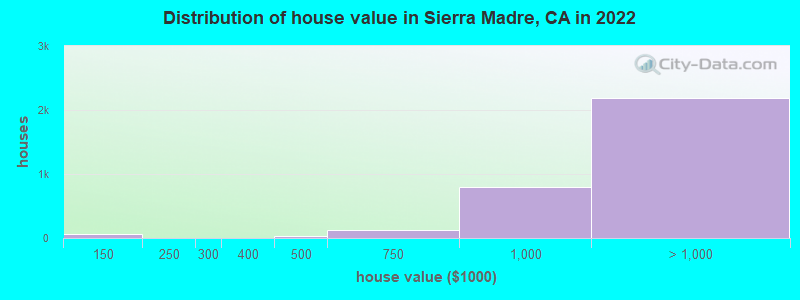
Median price asked for vacant for-sale houses and condos in 2022: $917,953.
Median contract rent in 2022: $1,885 (lower quartile is $1,544, upper quartile is over $2,000)
Median rent asked for vacant for-rent units in 2022: $5,608
Median gross rent in Sierra Madre, CA in 2022: $1,993
Housing units in Sierra Madre with a mortgage: 1,798 (246 second mortgage, 8 home equity loan, 211 both second mortgage and home equity loan) Houses without a mortgage: 16
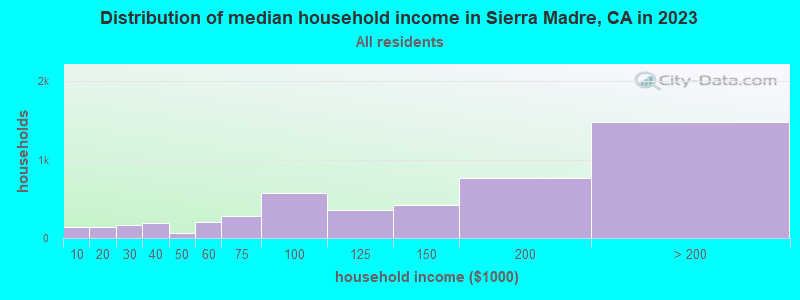
Median household income for houses/condos with a mortgage: $207,488
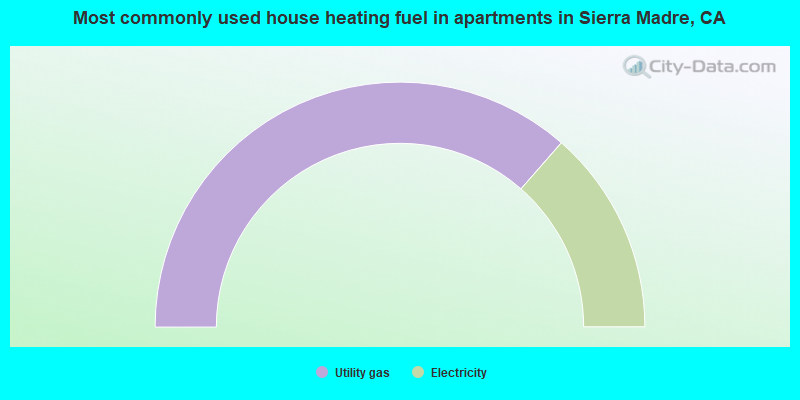
Median household income for apartments without a mortgage: $95,593
Median monthly housing costs: $2,205
Compare current foreclosures near Sierra Madre, CA:
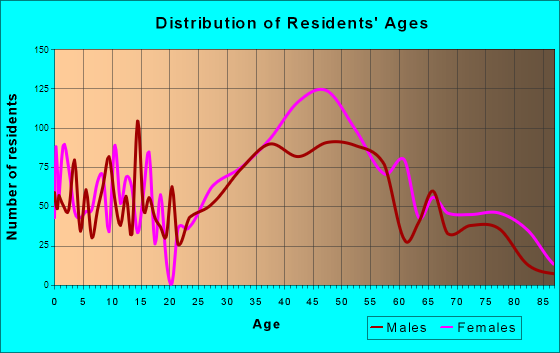
Size of family households: 1,480 2-persons, 731 3-persons, 539 4-persons, 129 5-persons, 13 6-persons, 21 7-or-more-persons.
Size of nonfamily households: 1,930 1-person, 287 2-persons, 17 3-persons.
1,516 married couples with children.
282 single-parent households (43 men, 239 women).
81.4% of residents of Sierra Madre speak English at home.
3.4% of residents speak Spanish at home (90% speak English very well, 5% speak English well, 5% speak English not well).
2.5% of residents speak other Indo-European language at home (93% speak English very well, 7% speak English well).
11.3% of residents speak Asian or Pacific Island language at home (64% speak English very well, 17% speak English well, 19% speak English not well).
2.4% of residents speak other language at home (79% speak English very well, 11% speak English well, 6% speak English not well, 5% don't speak English at all).
Foreign born population: 1,997 (18.3%)
(63.6% of them are naturalized citizens)
Percentage of workers working in this county: 94.6% Number of people working at home: 1,722 (28.6% of all workers)
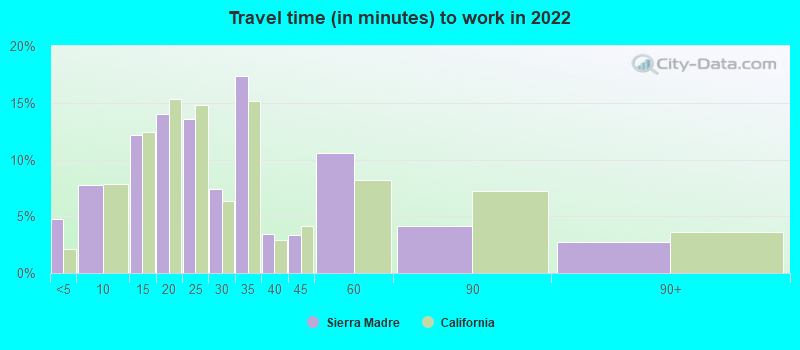
Travel time to work (commute)
Less than 5 minutes: 92
5 to 9 minutes: 254
10 to 14 minutes: 571
15 to 19 minutes: 815
20 to 24 minutes: 539
25 to 29 minutes: 455
30 to 34 minutes: 465
35 to 39 minutes: 303
40 to 44 minutes: 265
45 to 59 minutes: 351
60 to 89 minutes: 271
90 or more minutes: 140
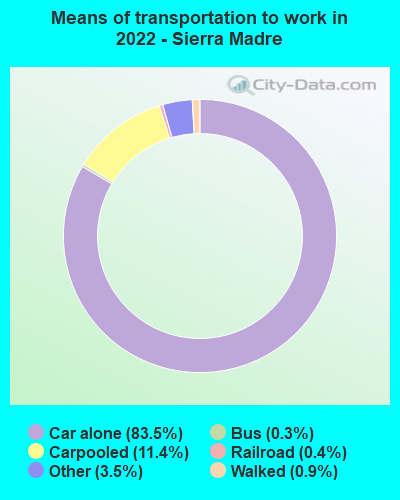
Means of transportation to work:
Drove a car alone: 1,660 (48.4%)
Carpooled: 250 (7.3%)
Bus: 6 (0.2%)
Light rail, streetcar or trolley: 4 (0.1%)
Taxi: 75 (2.2%)
Walked: 18 (0.5%)
Worked at home: 1,722 (50.2%)
Unemployment by race in 2022
Unemployment rate for White non-Hispanic residents
4.4%Males
1.7%Females
Unemployment rate for Asian residents
4.0%Males
3.0%Females
Unemployment rate for other race residents
23.1%Females
Unemployment rate for two or more race residents
3.8%Females
Unemployment rate for Hispanic or Latino residents
3.6%Females
Year of entry for the foreign-born population in Sierra Madre, California
7072010 or later
1262000 to 2009
6231990 to 1999
2241980 to 1989
3391970 to 1979
355Before 1970
First ancestries reported:
Irish: 304 (5.4%)
Italian: 288 (5.2%)
English: 243 (4.4%)
German: 215 (3.8%)
American: 159 (2.8%)
Armenian: 148 (2.6%)
Greek: 115 (2.1%)
Egyptian: 107 (1.9%)
European: 104 (1.9%)
Scottish: 71 (1.3%)
Polish: 69 (1.2%)
Welsh: 58 (1.0%)
Scotch-Irish: 57 (1.0%)
Russian: 54 (1.0%)
Romanian: 51 (0.9%)
Palestinian: 50 (0.9%)
Swedish: 49 (0.9%)
Hungarian: 37 (0.7%)
Norwegian: 36 (0.6%)
Portuguese: 36 (0.6%)
Iraqi: 35 (0.6%)
British: 34 (0.6%)
Belizean: 34 (0.6%)
Canadian: 32 (0.6%)
Northern European: 20 (0.4%)
Finnish: 16 (0.3%)
French Canadian: 13 (0.2%)
Lithuanian: 13 (0.2%)
Scandinavian: 13 (0.2%)
Croatian: 11 (0.2%)
Iranian: 7 (0.1%)
Slovak: 7 (0.1%)
Ukrainian: 7 (0.1%)
Swiss: 6 (0.1%)
Most common places of birth for foreign-born residents (%):
China, excluding Hong Kong and Taiwan
Sierra Madre:
18.9% (377)
California:
6.6% (684,672)
Taiwan
Sierra Madre:
15.3% (305)
California:
1.7% (176,274)
Hong Kong
Sierra Madre:
10.3% (206)
California:
1.0% (105,215)
Jordan
Sierra Madre:
6.7% (134)
California:
0.2% (16,384)
Egypt
Sierra Madre:
5.5% (109)
California:
0.4% (42,718)
Japan
Sierra Madre:
5.3% (106)
California:
1.0% (103,575)
Canada
Sierra Madre:
4.4% (87)
California:
1.2% (127,477)
Philippines
Sierra Madre:
3.6% (71)
California:
7.8% (818,297)
India
Sierra Madre:
3.4% (67)
California:
5.2% (539,184)
Romania
Sierra Madre:
2.4% (48)
California:
0.2% (23,058)
Ecuador
Sierra Madre:
2.3% (46)
California:
0.2% (21,276)
Mexico
Sierra Madre:
1.9% (37)
California:
37.2% (3,881,193)
Other Northern Africa
Sierra Madre:
1.8% (35)
California:
0.0% (3,349)
Israel
Sierra Madre:
1.8% (35)
California:
0.3% (33,029)
Belize
Sierra Madre:
1.6% (32)
California:
0.2% (15,693)
Lebanon
Sierra Madre:
1.6% (31)
California:
0.3% (31,757)
Place of birth for U.S.-born residents:
This state: 6,231
Other state: 2,525
Northeast: 721
Midwest: 959
South: 398
West: 426
89.9% of Sierra Madre residents lived in the same house 1 years ago. Out of people who lived in different houses, 43.9% lived in this county. Out of people who lived in different counties, 51.8% lived in California.
Sierra Madre:
89.9%
State average:
88.9%
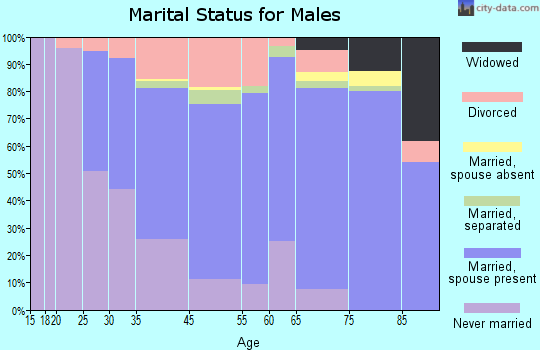
Education attainment for males 25 years and older:
No schooling: 34
Nursery to 4th grade: 0
5th and 6th grade: 0
7th and 8th grade: 0
9th grade: 0
10th grade: 0
11th grade: 11
12th grade, no diploma: 14
High school graduate (or equivalency): 212
Less than 1 year of college: 114
Some college more than 1 year, no degree: 485
Associate degree: 515
Bachelor's degree: 1,215
Master's degree: 742
Professional school degree: 380
Doctorate degree: 284
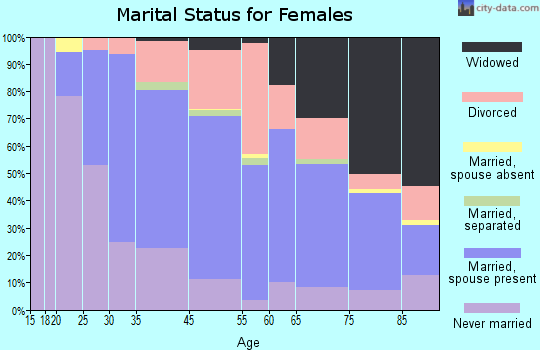
Education attainment for females 25 years and older:
No schooling: 65
Nursery to 4th grade: 0
5th and 6th grade: 0
7th and 8th grade: 0
9th grade: 0
10th grade: 39
11th grade: 7
12th grade, no diploma: 0
High school graduate (or equivalency): 570
Less than 1 year of college: 113
Some college more than 1 year, no degree: 364
Associate degree: 449
Bachelor's degree: 1,590
Master's degree: 1,011
Professional school degree: 344
Doctorate degree: 230
Housing units in structures:
One, detached: 3,803
One, attached: 544
Two: 70
3 or 4: 304
5 to 9: 422
10 to 19: 331
20 to 49: 177
Housing units lacking complete plumbing facilities in 2022: 1.4%
Housing units lacking complete kitchen facilities in 2022: 2.4%
House/condo owner moved in on average 14 years ago