Somonauk, IL (Illinois) Houses and Residents
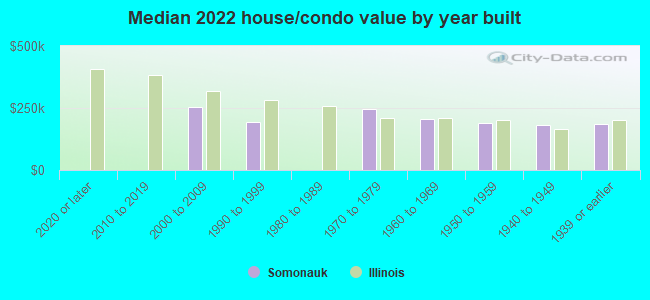
| Somonauk: | $216,061 |
| Illinois: | $251,600 |
Mean price in 2022:
Detached houses: $251,145
Here: $251,145 State: $310,164 Townhouses or other attached units: $442,979
Here: $442,979 State: $286,230 In 3-to-4-unit structures: $172,783
Here: $172,783 State: $330,907
Total population: 1,884 (Urban population: 1,297 (all inside urban clusters), Rural population: 7 (all nonfarm))
Houses: 733 (679 occupied: 483 owner occupied, 191 renter occupied)
| % of renters here: | 28% |
| State: | 33% |
Housing density: 1,196 houses/condos per square mile
Median price asked for vacant for-sale houses and condos in 2022 in this county: $178,377.
Median contract rent in 2022: $703 (lower quartile is $595, upper quartile is $837)
Median rent asked for vacant for-rent units in 2022: $600
Median gross rent in Somonauk, IL in 2022: $789
Housing units in Somonauk with a mortgage: 283 (25 second mortgage, 0 home equity loan, 20 both second mortgage and home equity loan)
Houses without a mortgage: 14
Median household income for houses/condos with a mortgage: $87,813
Median household income for apartments without a mortgage: $99,138
Median monthly housing costs: $1,013
Compare current foreclosures near Somonauk, IL:
| Photo | Address | Area | Beds / Baths | Price | Details |
|---|---|---|---|---|---|

|
#1
N 4645th Rd # B
Somonauk, IL 60552
|
- sq. feet
|
- baths - beds |
show details | |

|
#2
S Cherry St
Somonauk, IL 60552
|
- sq. feet
|
- baths - beds |
show details | |

|
#3
N Gage St
Somonauk, IL 60552
|
- sq. feet
|
- baths - beds |
show details | |

|
#4
N 46th Rd
Somonauk, IL 60552
|
- sq. feet
|
- baths - beds |
show details | |

|
#5
E Ann St
Somonauk, IL 60552
|
- sq. feet
|
- baths - beds |
show details | |

|
#6
Kathleen Cir
Montgomery, IL 60538
|
920 sq. feet
|
1 baths 2 beds |
$285,000
|
show details |

|
#7
Lakewood Dr
Somonauk, IL 60552
|
- sq. feet
|
- baths - beds |
show details | |

|
#8
Holiday Dr
Somonauk, IL 60552
|
- sq. feet
|
- baths - beds |
show details | |

|
#9
Fawn Dr
Somonauk, IL 60552
|
- sq. feet
|
- baths - beds |
show details | |

|
#10
Lasalle Dr
Somonauk, IL 60552
|
- sq. feet
|
- baths - beds |
show details |
| Photo | Address | Area | Beds / Baths | Price | Details |
|---|---|---|---|---|---|

|
#11
E Lasalle St
Somonauk, IL 60552
|
- sq. feet
|
- baths - beds |
show details | |

|
#12
N 45th Rd
Sandwich, IL 60548
|
- sq. feet
|
1 baths 3 beds |
$273,000
|
show details |

|
#13
E Ridge St
Yorkville, IL 60560
|
2,000 sq. feet
|
2 baths 3 beds |
show details | |

|
#14
Big Rock Ave
Plano, IL 60545
|
2,021 sq. feet
|
2 baths 3 beds |
show details | |

|
#15
Kristen Ct
Plano, IL 60545
|
2,500 sq. feet
|
3 baths 4 beds |
show details | |

|
#16
Garritano St Unit B
Yorkville, IL 60560
|
1,551 sq. feet
|
2 baths 2 beds |
show details | |

|
#17
Phelps Ct
Yorkville, IL 60560
|
1,865 sq. feet
|
2 baths 3 beds |
show details | |

|
#18
Tamaira St
Plano, IL 60545
|
2,072 sq. feet
|
2 baths 4 beds |
show details | |

|
#19
N 3739th Rd
Sheridan, IL 60551
|
- sq. feet
|
2 baths 4 beds |
show details | |

|
#20
Sandwich Dr
Sandwich, IL 60548
|
2,000 sq. feet
|
2 baths 3 beds |
show details |
| Photo | Address | Area | Beds / Baths | Price | Details |
|---|---|---|---|---|---|

|
#21
Stoneridge Ct
Yorkville, IL 60560
|
- sq. feet
|
2 baths 3 beds |
show details | |

|
#22
Irene Rd
Sandwich, IL 60548
|
1,792 sq. feet
|
2 baths 3 beds |
show details | |

|
#23
W Barberry Cir
Yorkville, IL 60560
|
- sq. feet
|
2 baths 3 beds |
show details | |

|
#24
Candlelight Cir
Montgomery, IL 60538
|
- sq. feet
|
2 baths 2 beds |
show details | |

|
#25
Market Place Dr Unit 4212
Yorkville, IL 60560
|
- sq. feet
|
- baths - beds |
show details | |

|
#26
W Railroad St
Earlville, IL 60518
|
- sq. feet
|
- baths - beds |
show details | |

|
#27
Sutton St
Yorkville, IL 60560
|
- sq. feet
|
- baths - beds |
show details | |

|
#28
Mchugh Rd
Yorkville, IL 60560
|
- sq. feet
|
- baths - beds |
show details | |

|
#29
Mulhern Ct Apt 6
Yorkville, IL 60560
|
- sq. feet
|
- baths - beds |
show details | |

|
#30
N 35th Rd
Seneca, IL 61360
|
- sq. feet
|
- baths - beds |
show details |
| Photo | Address | Area | Beds / Baths | Price | Details |
|---|---|---|---|---|---|

|
#31
E Main St
Yorkville, IL 60560
|
- sq. feet
|
- baths - beds |
show details | |

|
#32
Lauren Dr
Yorkville, IL 60560
|
- sq. feet
|
- baths - beds |
show details | |

|
#33
W Countryside Pkwy Apt D
Yorkville, IL 60560
|
- sq. feet
|
- baths - beds |
show details | |

|
#34
Appletree Ct Apt B
Yorkville, IL 60560
|
- sq. feet
|
- baths - beds |
show details | |

|
#35
Fontana Dr
Yorkville, IL 60560
|
- sq. feet
|
- baths - beds |
show details | |

|
#36
Tower Ln Apt A
Yorkville, IL 60560
|
- sq. feet
|
- baths - beds |
show details | |

|
#37
Church St
Yorkville, IL 60560
|
- sq. feet
|
- baths - beds |
show details | |

|
#38
Colonial Pkwy Unit C
Yorkville, IL 60560
|
- sq. feet
|
- baths - beds |
show details | |

|
#39
Hydraulic St
Yorkville, IL 60560
|
- sq. feet
|
- baths - beds |
show details | |

|
#40
Katie Dr
Big Rock, IL 60511
|
- sq. feet
|
- baths - beds |
show details |
| Photo | Address | Area | Beds / Baths | Price | Details |
|---|---|---|---|---|---|

|
#41
Purcell St
Yorkville, IL 60560
|
- sq. feet
|
- baths - beds |
show details | |

|
#42
River Rd
Plano, IL 60545
|
- sq. feet
|
- baths - beds |
show details | |

|
#43
N Birch St
Waterman, IL 60556
|
- sq. feet
|
- baths - beds |
show details | |

|
#44
Rena Ln
Yorkville, IL 60560
|
- sq. feet
|
- baths - beds |
show details | |

|
#45
Bluebird Ln
Yorkville, IL 60560
|
- sq. feet
|
- baths - beds |
show details | |

|
#46
Hawk Hollow Dr
Yorkville, IL 60560
|
- sq. feet
|
- baths - beds |
show details | |

|
#47
Olive Ln
Yorkville, IL 60560
|
- sq. feet
|
- baths - beds |
show details | |

|
#48
Caddlelight Cir
Montgomery, IL 60538
|
- sq. feet
|
- baths - beds |
show details | |

|
#49
Barnes Rd
Aurora, IL 60506
|
- sq. feet
|
- baths - beds |
show details | |

|
Check over 1 million property listings on Foreclosure.com!
|
browse all offers | |||

Latest news about housing in Somonauk, IL collected exclusively by city-data.com from local newspapers, TV, and radio stations

 | Lake Holiday, IL (Sandwich/Somonauk) (6 replies) |
| Do you think the EL will ever be expanded or new lines added? (421 replies) |
| Naperville, Sugar Grove, or Elburn? (11 replies) |
| Oswego a good choice? (15 replies) |
| Hate snow...family in IL...what to do? (53 replies) |
Median year apartment built: 1964
Household type by relationship:
Households: 1,788- Male householders: 306 (56 living alone), Female householders: 366 (125 living alone)
403 spouses (398 opposite-sex spouses), 21 unmarried partners, (15 opposite-sex unmarried partners), 575 children (530 natural, 1 adopted, 42 stepchildren), 40 grandchildren, 2 brothers or sisters, 5 parents, 0 foster children, 21 other relatives, 43 non-relatives
Size of family households: 266 2-persons, 60 3-persons, 120 4-persons, 63 5-persons, 7 6-persons, 7 7-or-more-persons.
Size of nonfamily households: 166 1-person, 15 2-persons.
246 married couples with children.
92 single-parent households (8 men, 84 women).
98.3% of residents of Somonauk speak English at home.
1.3% of residents speak Spanish at home (55% speak English very well, 45% speak English well).
Foreign born population: 18 (1.0%)
(83.3% of them are naturalized citizens)
| Here: | 6.7 |
| State: | 6.4 |
| Here: | 4.7 |
| State: | 4.1 |
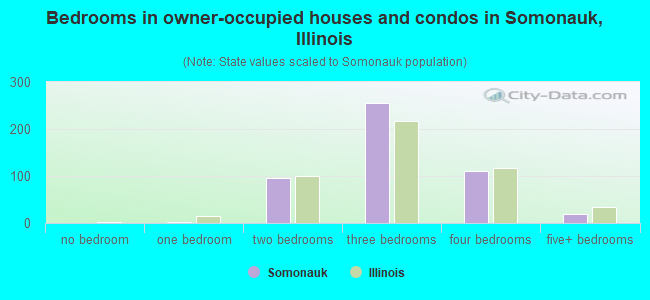
- Bedrooms in owner-occupied houses and condos in Somonauk, Illinois
- 0no bedroom
- 31 bedroom
- 962 bedrooms
- 2563 bedrooms
- 1104 bedrooms
- 195+ bedrooms
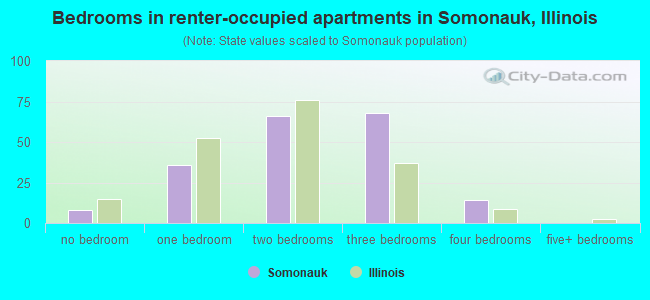
- Bedrooms in renter-occupied apartments in Somonauk, Illinois
- 8no bedroom
- 361 bedroom
- 662 bedrooms
- 683 bedrooms
- 144 bedrooms
- 05+ bedrooms
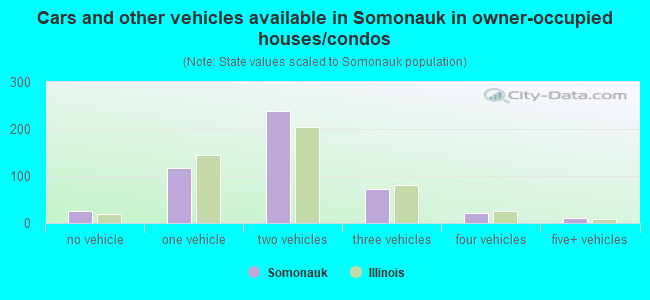
- Cars and other vehicles available in Somonauk in owner-occupied houses/condos
- 25no vehicle
- 1171 vehicle
- 2382 vehicles
- 723 vehicles
- 214 vehicles
- 115+ vehicles
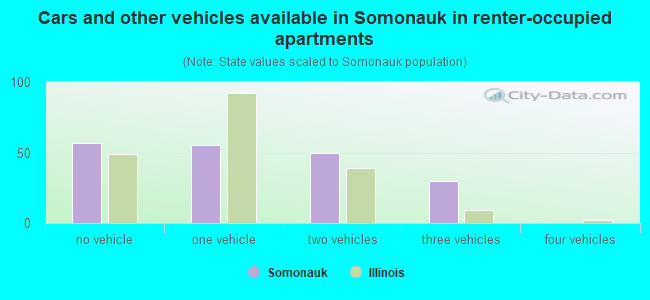
- Cars and other vehicles available in Somonauk in renter-occupied apartments
- 57no vehicle
- 551 vehicle
- 502 vehicles
- 303 vehicles
- 04 vehicles
- 05+ vehicles
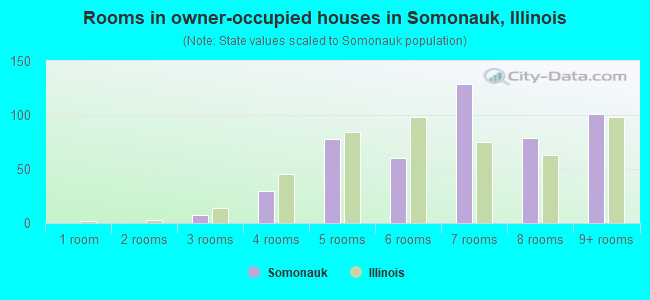
- Rooms in owner-occupied houses in Somonauk, Illinois
- 01 room
- 02 rooms
- 73 rooms
- 304 rooms
- 785 rooms
- 606 rooms
- 1297 rooms
- 798 rooms
- 1019+ rooms
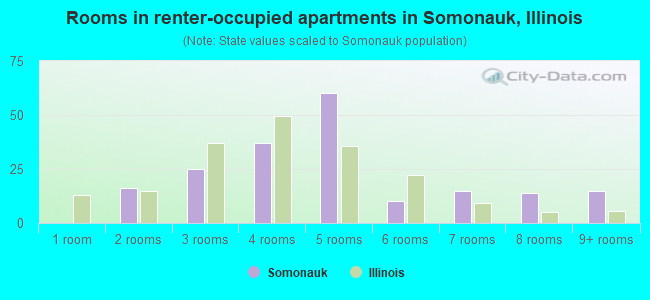
- Rooms in renter-occupied apartments in Somonauk, Illinois
- 01 room
- 162 rooms
- 253 rooms
- 374 rooms
- 605 rooms
- 106 rooms
- 157 rooms
- 148 rooms
- 159+ rooms
Somonauk, IL household income distribution

- 42Less than $10,000
- 33$10,000 to $19,999
- 43$20,000 to $29,999
- 37$30,000 to $39,999
- 44$40,000 to $49,999
- 46$50,000 to $59,999
- 75$60,000 to $74,999
- 111$75,000 to $99,999
- 67$100,000 to $124,999
- 74$125,000 to $149,999
- 38$150,000 to $199,999
- 60$200,000 or more
Home value of owner - occupied houses in 2022 in Somonauk, IL
-
- 4$15,000 to $19,999
- 3$25,000 to $29,999
- 5$80,000 to $89,999
- 3$90,000 to $99,999
- 13$100,000 to $124,999
- 24$125,000 to $149,999
- 90$150,000 to $174,999
- 68$175,000 to $199,999
- 118$200,000 to $249,999
- 68$250,000 to $299,999
- 57$300,000 to $399,999
- 24$400,000 to $499,999
Rent paid by renters in 2022 in Somonauk, IL
-
- 10Less than $100
- 7$150 to $199
- 6$200 to $249
- 8$350 to $399
- 4$400 to $449
- 4$500 to $549
- 30$600 to $649
- 33$650 to $699
- 3$700 to $749
- 12$750 to $799
- 17$800 to $899
- 19$900 to $999
- 10$1,000 to $1,249
- 9$1,250 to $1,499
- 12$1,500 to $1,999
- 13No cash rent
Percentage of workers working in this county: 39.2%
Number of people working at home: 65 (7.9% of all workers)
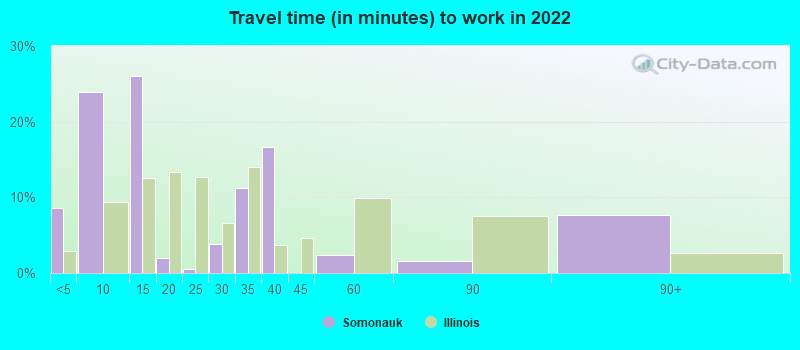
Travel time to work (commute)
- Less than 5 minutes: 75
- 5 to 9 minutes: 58
- 10 to 14 minutes: 91
- 15 to 19 minutes: 30
- 20 to 24 minutes: 57
- 25 to 29 minutes: 44
- 30 to 34 minutes: 113
- 35 to 39 minutes: 41
- 40 to 44 minutes: 13
- 45 to 59 minutes: 95
- 60 to 89 minutes: 92
- 90 or more minutes: 18
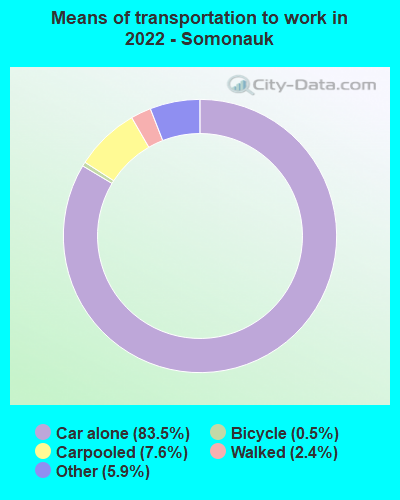
Means of transportation to work:
- Drove a car alone: 597 (75.3%)
- Carpooled: 57 (7.2%)
- Taxi: 47 (5.9%)
- Bicycle: 4 (0.5%)
- Walked: 17 (2.1%)
- Worked at home: 65 (8.2%)
- Unemployment by race in 2022
- Unemployment rate for White non-Hispanic residents
- 2.7%Males
- 1.8%Females
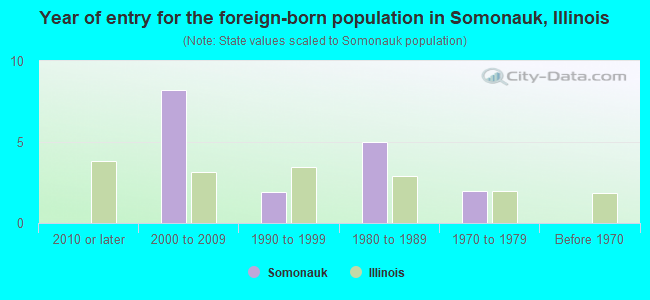
- Year of entry for the foreign-born population in Somonauk, Illinois
- 02010 or later
- 82000 to 2009
- 21990 to 1999
- 51980 to 1989
- 21970 to 1979
- 0Before 1970
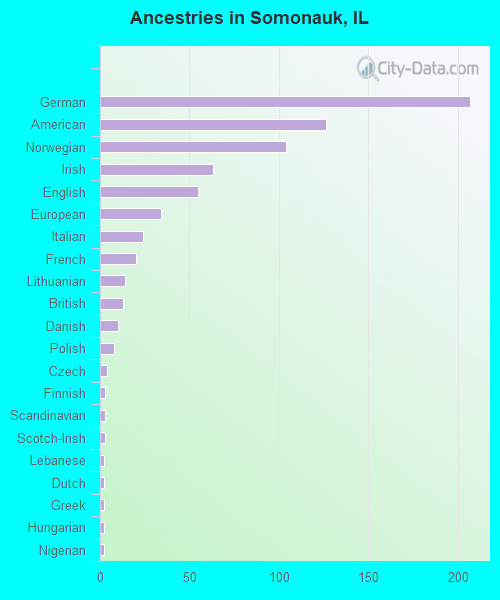
First ancestries reported:
- German: 207 (27.4%)
- American: 126 (16.7%)
- Norwegian: 104 (13.8%)
- Irish: 63 (8.4%)
- English: 55 (7.3%)
- European: 34 (4.5%)
- Italian: 24 (3.2%)
- French: 20 (2.7%)
- Lithuanian: 14 (1.9%)
- British: 13 (1.7%)
- Danish: 10 (1.3%)
- Polish: 8 (1.1%)
- Czech: 4 (0.5%)
- Finnish: 3 (0.4%)
- Scandinavian: 3 (0.4%)
- Scotch-Irish: 3 (0.4%)
- Lebanese: 2 (0.3%)
- Dutch: 2 (0.3%)
- Greek: 2 (0.3%)
- Hungarian: 2 (0.3%)
- Nigerian: 2 (0.3%)
Most common places of birth for foreign-born residents (%):
| Somonauk: | 52.4% (11) |
| Illinois: | 34.7% (626,958) |
| Somonauk: | 38.1% (8) |
| Illinois: | 0.1% (1,224) |
| Somonauk: | 9.5% (2) |
| Illinois: | 1.0% (18,753) |
Place of birth for U.S.-born residents:
- This state: 1,546
- Other state: 242
- Northeast: 7
- Midwest: 143
- South: 81
- West: 12
93.8% of Somonauk residents lived in the same house 1 years ago.
Out of people who lived in different houses, 2.7% lived in this county.
Out of people who lived in different counties, 87.9% lived in Illinois.
| Somonauk: | 93.8% |
| State average: | 88.3% |
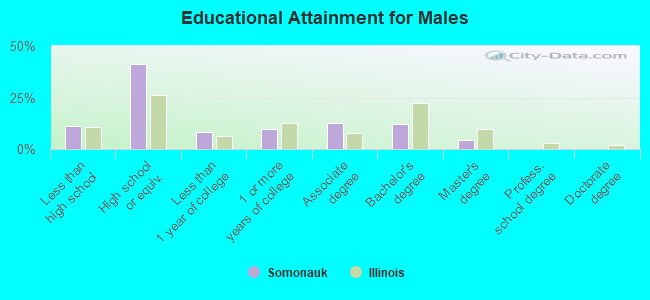
Education attainment for males 25 years and older:
- No schooling: 0
- Nursery to 4th grade: 0
- 5th and 6th grade: 0
- 7th and 8th grade: 0
- 9th grade: 2
- 10th grade: 0
- 11th grade: 2
- 12th grade, no diploma: 59
- High school graduate (or equivalency): 233
- Less than 1 year of college: 47
- Some college more than 1 year, no degree: 56
- Associate degree: 71
- Bachelor's degree: 69
- Master's degree: 26
- Professional school degree: 0
- Doctorate degree: 0
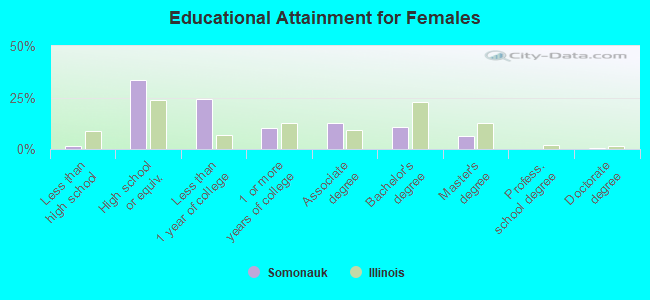
Education attainment for females 25 years and older:
- No schooling: 0
- Nursery to 4th grade: 0
- 5th and 6th grade: 0
- 7th and 8th grade: 4
- 9th grade: 1
- 10th grade: 0
- 11th grade: 2
- 12th grade, no diploma: 3
- High school graduate (or equivalency): 240
- Less than 1 year of college: 173
- Some college more than 1 year, no degree: 74
- Associate degree: 91
- Bachelor's degree: 76
- Master's degree: 46
- Professional school degree: 0
- Doctorate degree: 3
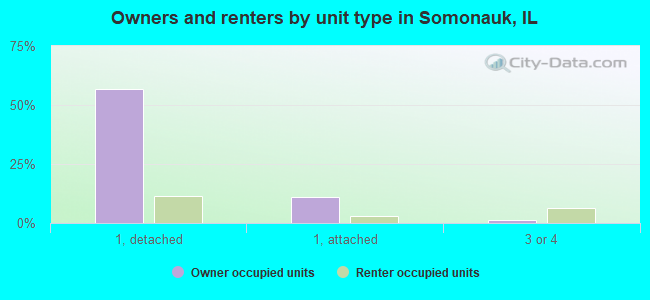
Housing units in structures:
- One, detached: 472
- One, attached: 122
- Two: 52
- 3 or 4: 49
- 10 to 19: 19
- 20 to 49: 17
Housing units lacking complete kitchen facilities in 2022: 1.2%
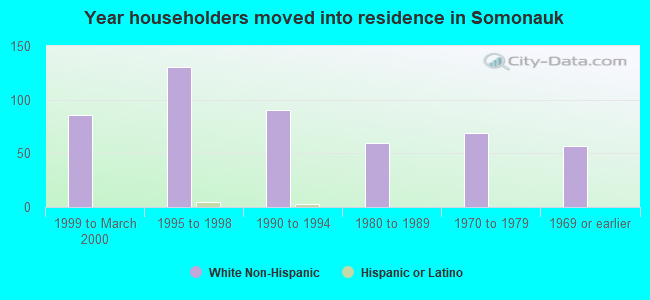
House/condo owner moved in on average 14 years ago
Renter moved in on average 5 years ago
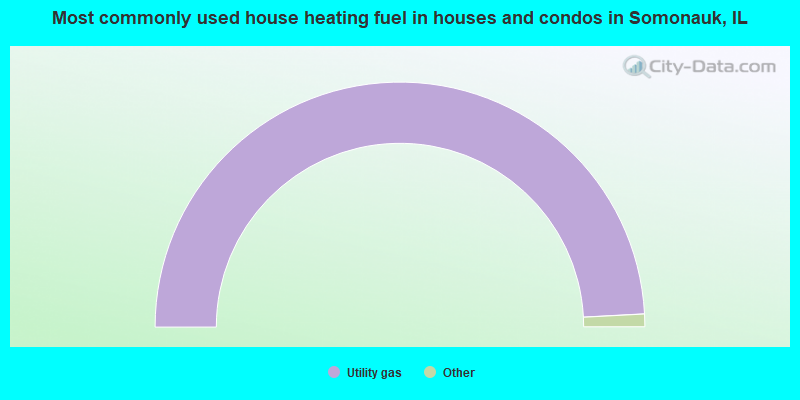
- 98.3%Utility gas
- 1.0%Electricity
- 0.6%No fuel used
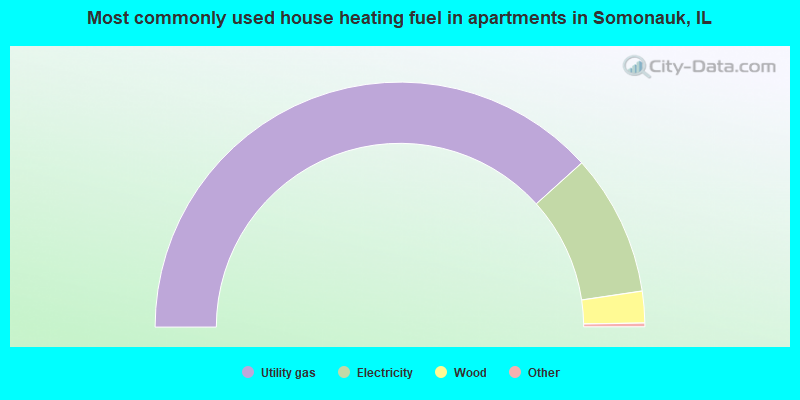
- 77.1%Utility gas
- 18.8%Electricity
- 4.2%Wood
Private vs. public school enrollment:
| Here: | 9.6% |
| Illinois: | 13.3% |
| Here: | 3.2% |
| Illinois: | 9.9% |
| Here: | 0.0% |
| Illinois: | 27.4% |