South River, NJ (New Jersey) Houses and Residents
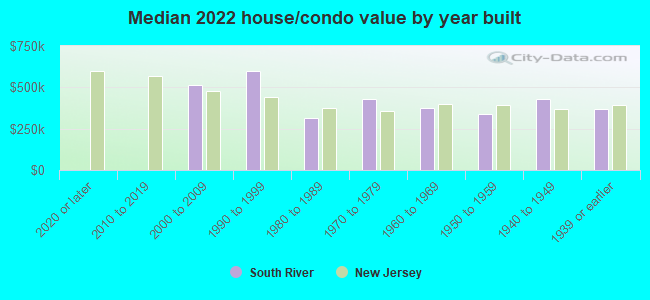
Estimated median house or condo value in 2022: $385,414 (it was $150,000 in 2000 )
South River:
$385,414New Jersey:
$428,900
Lower value quartile - upper value quartile: $301,310 - $507,739Total population: 16,334 (Urban population: 15,322, Rural population: 0)
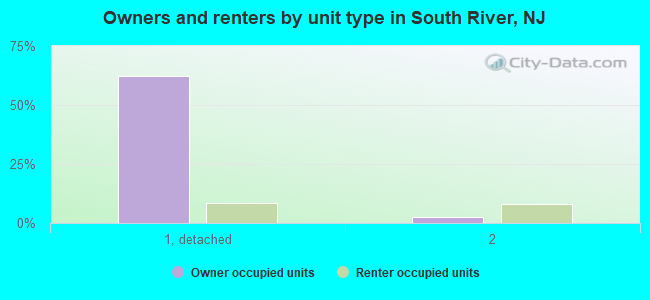
Houses: 5,815 (5,599 occupied: 3,683 owner occupied, 1,962 renter occupied )
% of renters here:
35%State:
35%
Housing density: 2,066 houses/condos per square mile
Median price asked for vacant for-sale houses and condos in 2022: $1,617,834.
Median contract rent in 2022: $1,388 (lower quartile is $1,069, upper quartile is $1,696)
Median rent asked for vacant for-rent units in 2022: $1,686
Median gross rent in South River, NJ in 2022: $1,549
Housing units in South River with a mortgage: 2,197 (253 second mortgage, 24 home equity loan, 197 both second mortgage and home equity loan )Houses without a mortgage: 86
Median household income for houses/condos with a mortgage: $124,258
Median household income for apartments without a mortgage: $87,838
Median monthly housing costs: $1,668
Data:
Median house or condo value ($)
Median house or condo value ($ change since 2000)
Median house or condo value ($) - White
Median house or condo value ($) - Black or African American
Median house or condo value ($) - Asian
Median house or condo value ($) - Hispanic or Latino
Median house or condo value ($) - American Indian and Alaska Native
Median house or condo value ($) - Multirace
Median house or condo value ($) - Other Race
Median price asked for mobile homes ($)
Household density (households per square mile)
Mean house or condo value by units in structure - 1, detached ($)
Mean house or condo value by units in structure - 1, attached ($)
Mean house or condo value by units in structure - 2 ($)
Mean house or condo value by units in structure by units in structure - 3 or 4 ($)
Mean house or condo value by units in structure - 5 or more ($)
Mean house or condo value by units in structure - Boat, RV, van, etc. ($)
Mean house or condo value by units in structure - Mobile home ($)
Median contract rent ($)
Median contract rent - Lower quartile ($)
Median contract rent - Upper quartile ($)
Median gross rent ($)
Urban houses (%)
Rural houses (%)
Houses occupied (%)
Houses occupied (% change since 2000)
Houses owner occupied (%)
Houses owner occupied (% change since 2000)
Houses renter occupied (%)
Houses renter occupied (% change since 2000)
Vacant housing units - For rent (%)
Vacant housing units - For rent (% change since 2000)
Vacant housing units - For sale only (%)
Vacant housing units - For sale only (% change since 2000)
Vacant housing units - Rented or sold, not occupied (%)
Vacant housing units - Rented or sold, not occupied (% change since 2000)
Vacant housing units - For seasonal, recreational, or occasional use (%)
Vacant housing units - For seasonal, recreational, or occasional use (% change since 2000)
Vacant housing units - For migrant workers (%)
Vacant housing units - For migrant workers (% change since 2000)
Vacant housing units - Other vacant (%)
Vacant housing units - Other vacant (% change since 2000)
Median monthly housing costs ($)
Median household income for houses/condos with a mortgage ($)
Median household income for houses/condos without a mortgage ($)
Median household income ($)
Median household income ($) - White
Median household income ($) - Black or African American
Median household income ($) - Asian
Median household income ($) - Hispanic or Latino
Median household income ($) - American Indian and Alaska Native
Median household income ($) - Multirace
Median household income ($) - Other Race
Mortgage status - with mortgage (%)
Mortgage status - with second mortgage (%)
Mortgage status - with home equity loan (%)
Mortgage status - with both second mortgage and home equity loan (%)
Mortgage status - without a mortgage (%)
Median year house/condo built
Median year apartment built
Household type by relationship - Male householder living alone (%)
Household type by relationship - Male householder not living alone (%)
Household type by relationship - Female householder living alone (%)
Household type by relationship - Female householder not living alone (%)
Household type by relationship - Opposite-Sex spouse (%)
Household type by relationship - Same-Sex spouse (%)
Household type by relationship - Opposite-Sex unmarried partner (%)
Household type by relationship - Same-Sex unmarried partner (%)
Household type by relationship - In group quarters (%)
Size of family households - 2-person household (%)
Size of family households - 3-person household (%)
Size of family households - 4-person household (%)
Size of family households - 5-person household (%)
Size of family households - 6-person household (%)
Size of family households - 7-or-more-person household (%)
Size of nonfamily households - 1-person household (%)
Size of nonfamily households - 2-person household (%)
Size of nonfamily households - 3-person household (%)
Size of nonfamily households - 4-person household (%)
Size of nonfamily households - 5-person household (%)
Size of nonfamily households - 6-person household (%)
Size of nonfamily households - 7-or-moreperson household (%)
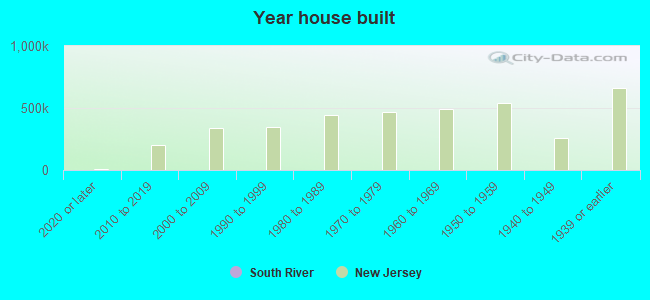
Year house built - Built 2010 or later (%)
Year house built - Built 2000 to 2009 (%)
Year house built - Built 1990 to 1999 (%)
Year house built - Built 1980 to 1989 (%)
Year house built - Built 1970 to 1979 (%)
Year house built - Built 1960 to 1969 (%)
Year house built - Built 1950 to 1959 (%)
Year house built - Built 1940 to 1949 (%)
Year house built - Built 1939 or earlier (%)
Median number of rooms in houses and condos
Median number of rooms in apartments
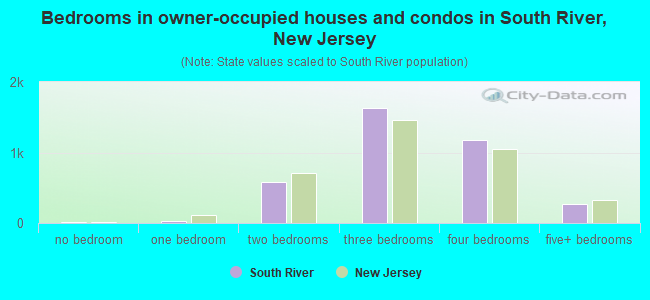
Median number of bedrooms in owner occupied houses
Mean number of bedrooms in owner occupied houses
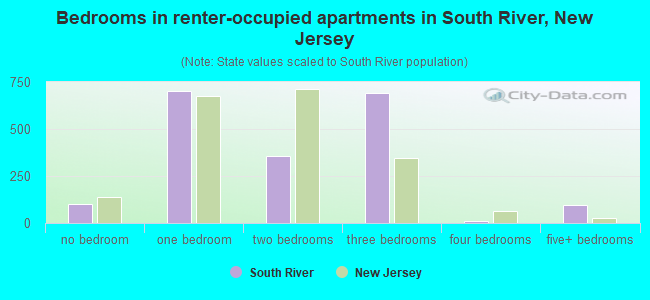
Median number of bedrooms in renter occupied houses
Mean number of bedrooms in renter occupied houses
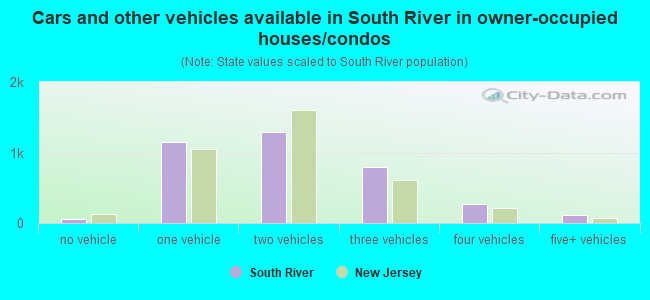
Median number of vehichles in owner occupied houses
Mean number of vehichles in owner occupied houses
Median number of vehichles in renter occupied houses
Mean number of vehichles in renter occupied houses
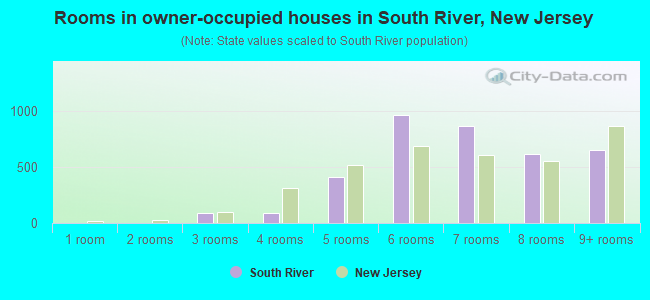
Rooms in owner-occupied houses - 1 room (%)
Rooms in owner-occupied houses - 2 rooms (%)
Rooms in owner-occupied houses - 3 rooms (%)
Rooms in owner-occupied houses - 4 rooms (%)
Rooms in owner-occupied houses - 5 rooms (%)
Rooms in owner-occupied houses - 6 rooms (%)
Rooms in owner-occupied houses - 7 rooms (%)
Rooms in owner-occupied houses - 8 rooms (%)
Rooms in owner-occupied houses - 9+ rooms (%)
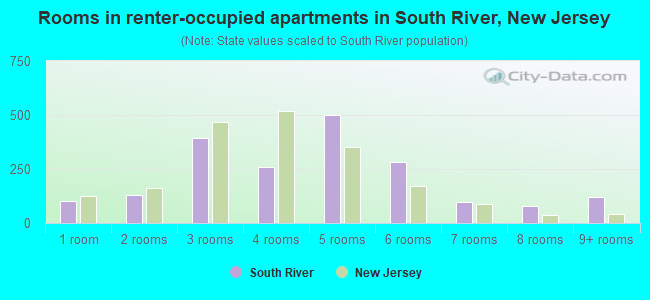
Rooms in renter-occupied houses - 1 room (%)
Rooms in renter-occupied houses - 2 rooms (%)
Rooms in renter-occupied houses - 3 rooms (%)
Rooms in renter-occupied houses - 4 rooms (%)
Rooms in renter-occupied houses - 5 rooms (%)
Rooms in renter-occupied houses - 6 rooms (%)
Rooms in renter-occupied houses - 7 rooms (%)
Rooms in renter-occupied houses - 8 rooms (%)
Rooms in renter-occupied houses - 9+ rooms (%)
Bedrooms in owner-occupied houses - no bedrooms (%)
Bedrooms in owner-occupied houses - 1 bedroom (%)
Bedrooms in owner-occupied houses - 2 bedrooms (%)
Bedrooms in owner-occupied houses - 3 bedrooms (%)
Bedrooms in owner-occupied houses - 4 bedrooms (%)
Bedrooms in owner-occupied houses - 5+ bedrooms (%)
Bedrooms in renter-occupied houses - no bedrooms (%)
Bedrooms in renter-occupied houses - 1 bedroom (%)
Bedrooms in renter-occupied houses - 2 bedrooms (%)
Bedrooms in renter-occupied houses - 3 bedrooms (%)
Bedrooms in renter-occupied houses - 4 bedrooms (%)
Bedrooms in renter-occupied houses - 5+ bedrooms (%)
Vehicles available in owner-occupied houses - no vehicle available (%)
Vehicles available in owner-occupied houses - 1 vehicle available(%)
Vehicles available in owner-occupied houses - 2 Vehicles available (%)
Vehicles available in owner-occupied houses - 3 Vehicles available (%)
Vehicles available in owner-occupied houses - 4 Vehicles available (%)
Vehicles available in owner-occupied houses - 5+ Vehicles available (%)
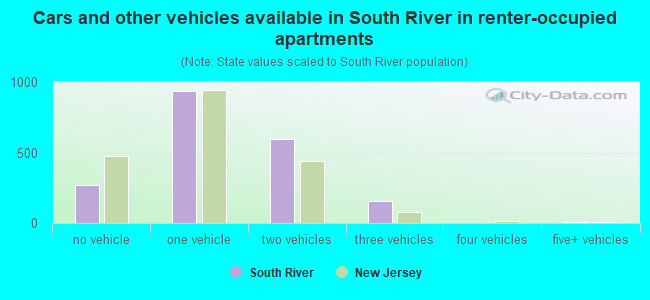
Vehicles available in renter-occupied houses - no vehicle available (%)
Vehicles available in renter-occupied houses - 1 vehicle available (%)
Vehicles available in renter-occupied houses - 2 Vehicles available (%)
Vehicles available in renter-occupied houses - 3 Vehicles available (%)
Vehicles available in renter-occupied houses - 4 Vehicles available (%)
Vehicles available in renter-occupied houses - 5+ Vehicles available (%)
Housing units in structures - 1, detached (%)
Housing units in structures - 1, attached (%)
Housing units in structures - 2 (%)
Housing units in structures - 3 or 4 (%)
Housing units in structures - 5 to 9 (%)
Housing units in structures - 10 to 19 (%)
Housing units in structures - 20 to 49 (%)
Housing units in structures - 50 or more (%)
Housing units in structures - Mobile home (%)
Housing units in structures - Boat, RV, van, etc. (%)
Housing units in structures - Owners - 1, detached (%)
Housing units in structures - Owners - 1, attached (%)
Housing units in structures - Owners - 2 (%)
Housing units in structures - Owners - 3 or 4 (%)
Housing units in structures - Owners - 5 to 9 (%)
Housing units in structures - Owners - 10 to 19 (%)
Housing units in structures - Owners - 20 to 49 (%)
Housing units in structures - Owners - 50 or more (%)
Housing units in structures - Owners - Mobile home (%)
Housing units in structures - Owners - Boat, RV, van, etc. (%)
Housing units in structures - Renters - 1, detached (%)
Housing units in structures - Renters - 1, attached (%)
Housing units in structures - Renters - 2 (%)
Housing units in structures - Renters - 3 or 4 (%)
Housing units in structures - Renters - 5 to 9 (%)
Housing units in structures - Renters - 10 to 19 (%)
Housing units in structures - Renters - 20 to 49 (%)
Housing units in structures - Renters - 50 or more (%)
Housing units in structures - Renters - Mobile home (%)
Housing units in structures - Renters - Boat, RV, van, etc. (%)
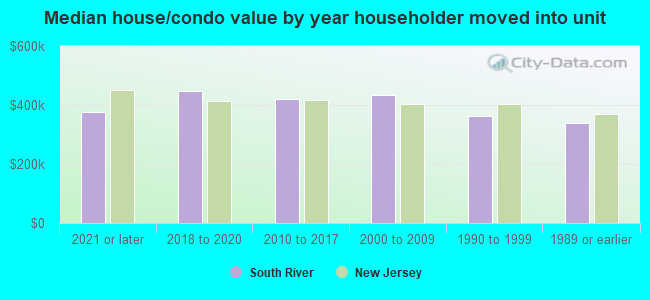
House/condo owner moved in on average (years ago)
Renter moved in on average (years ago)
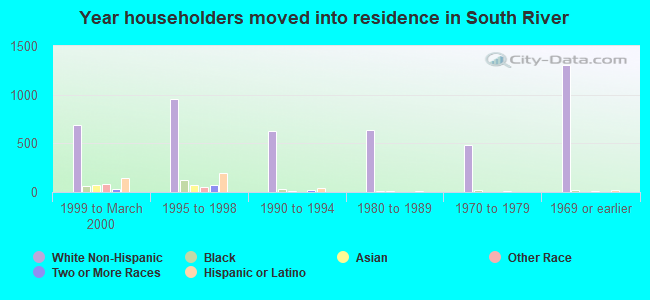
Year householder moved into unit - Moved in 1999 to March 2000 (%)
Year householder moved into unit - Moved in 1999 to March 2000 (%) - White
Year householder moved into unit - Moved in 1999 to March 2000 (%) - Black or African American
Year householder moved into unit - Moved in 1999 to March 2000 (%) - Asian
Year householder moved into unit - Moved in 1999 to March 2000 (%) - Hispanic or Latino
Year householder moved into unit - Moved in 1999 to March 2000 (%) - American Indian and Alaska Native
Year householder moved into unit - Moved in 1999 to March 2000 (%) - Multirace
Year householder moved into unit - Moved in 1999 to March 2000 (%) - Other Race
Year householder moved into unit - Moved in 1995 to 1998 (%)
Year householder moved into unit - Moved in 1995 to 1998 (%) - White
Year householder moved into unit - Moved in 1995 to 1998 (%) - Black or African American
Year householder moved into unit - Moved in 1995 to 1998 (%) - Asian
Year householder moved into unit - Moved in 1995 to 1998 (%) - Hispanic or Latino
Year householder moved into unit - Moved in 1995 to 1998 (%) - American Indian and Alaska Native
Year householder moved into unit - Moved in 1995 to 1998 (%) - Multirace
Year householder moved into unit - Moved in 1995 to 1998 (%) - Other Race
Year householder moved into unit - Moved in 1990 to 1994 (%)
Year householder moved into unit - Moved in 1990 to 1994 (%) - White
Year householder moved into unit - Moved in 1990 to 1994 (%) - Black or African American
Year householder moved into unit - Moved in 1990 to 1994 (%) - Asian
Year householder moved into unit - Moved in 1990 to 1994 (%) - Hispanic or Latino
Year householder moved into unit - Moved in 1990 to 1994 (%) - American Indian and Alaska Native
Year householder moved into unit - Moved in 1990 to 1994 (%) - Multirace
Year householder moved into unit - Moved in 1990 to 1994 (%) - Other Race
Year householder moved into unit - Moved in 1980 to 1989 (%)
Year householder moved into unit - Moved in 1980 to 1989 (%) - White
Year householder moved into unit - Moved in 1980 to 1989 (%) - Black or African American
Year householder moved into unit - Moved in 1980 to 1989 (%) - Asian
Year householder moved into unit - Moved in 1980 to 1989 (%) - Hispanic or Latino
Year householder moved into unit - Moved in 1980 to 1989 (%) - American Indian and Alaska Native
Year householder moved into unit - Moved in 1980 to 1989 (%) - Multirace
Year householder moved into unit - Moved in 1980 to 1989 (%) - Other Race
Year householder moved into unit - Moved in 1970 to 1979 (%)
Year householder moved into unit - Moved in 1970 to 1979 (%) - White
Year householder moved into unit - Moved in 1970 to 1979 (%) - Black or African American
Year householder moved into unit - Moved in 1970 to 1979 (%) - Asian
Year householder moved into unit - Moved in 1970 to 1979 (%) - Hispanic or Latino
Year householder moved into unit - Moved in 1970 to 1979 (%) - American Indian and Alaska Native
Year householder moved into unit - Moved in 1970 to 1979 (%) - Multirace
Year householder moved into unit - Moved in 1970 to 1979 (%) - Other Race
Year householder moved into unit - Moved in 1969 or earlier (%)
Year householder moved into unit - Moved in 1969 or earlier (%) - White
Year householder moved into unit - Moved in 1969 or earlier (%) - Black or African American
Year householder moved into unit - Moved in 1969 or earlier (%) - Asian
Year householder moved into unit - Moved in 1969 or earlier (%) - Hispanic or Latino
Year householder moved into unit - Moved in 1969 or earlier (%) - American Indian and Alaska Native
Year householder moved into unit - Moved in 1969 or earlier (%) - Multirace
Year householder moved into unit - Moved in 1969 or earlier (%) - Other Race
Housing units lacking complete plumbing facilities (%)
Housing units lacking complete kitchen facilities (%)
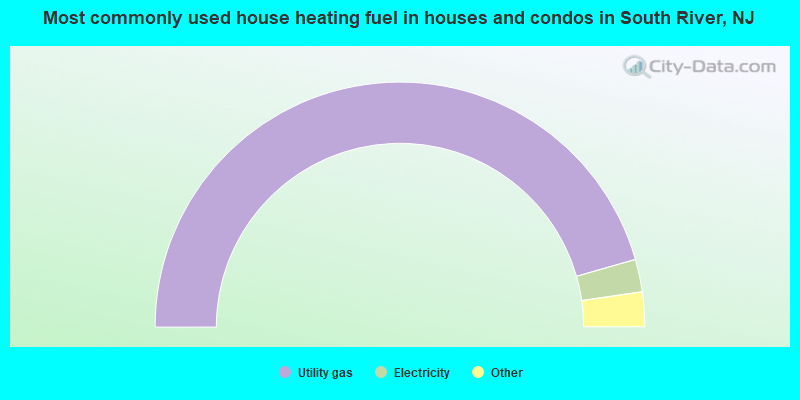
House heating fuel used in houses and condos - Utility gas (%)
House heating fuel used in houses and condos - Bottled, tank, or LP gas (%)
House heating fuel used in houses and condos - Electricity (%)
House heating fuel used in houses and condos - Fuel oil, kerosene, etc. (%)
House heating fuel used in houses and condos - Coal or coke (%)
House heating fuel used in houses and condos - Wood (%)
House heating fuel used in houses and condos - Solar energy (%)
House heating fuel used in houses and condos - Other fuel (%)
House heating fuel used in houses and condos - No fuel used (%)
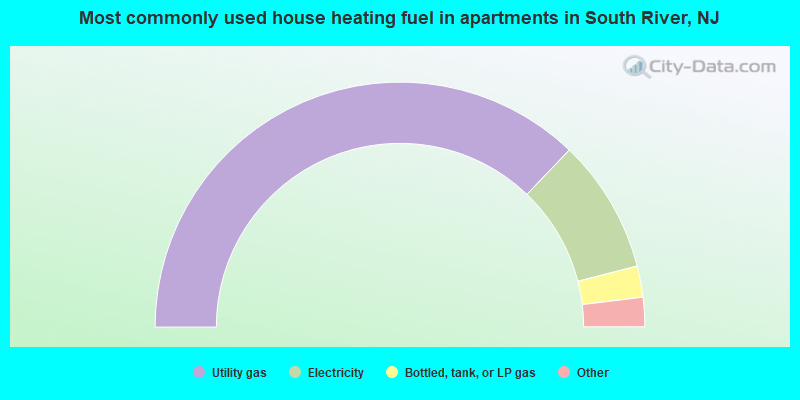
House heating fuel used in apartments - Utility gas (%)
House heating fuel used in apartments - Bottled, tank, or LP gas (%)
House heating fuel used in apartments - Electricity (%)
House heating fuel used in apartments - Fuel oil, kerosene, etc. (%)
House heating fuel used in apartments - Coal or coke (%)
House heating fuel used in apartments - Wood (%)
House heating fuel used in apartments - Solar energy (%)
House heating fuel used in apartments - Other fuel (%)
House heating fuel used in apartments - No fuel used (%)
Median year house/condo built: 1958Median year apartment built: 1960Household type by relationship:
Households: 16,104
Male householders: 2,925 (609 living alone ), Female householders: 2,637 (579 living alone )2,812 spouses (2,794 opposite-sex spouses ), 371 unmarried partners , (357 opposite-sex unmarried partners ), 5,253 children (4,844 natural , 83 adopted , 326 stepchildren ), 423 grandchildren , 303 brothers or sisters , 87 parents , 0 foster children , 370 other relatives , 898 non-relatives In group quarters: 21
Size of family households: 1,395 2-persons , 1,043 3-persons , 769 4-persons , 495 5-persons , 192 6-persons , 138 7-or-more-persons .
Size of nonfamily households: 1,209 1-person , 220 2-persons , 15 3-persons , 43 4-persons , 56 5-persons .
1,897 married couples with children. single-parent households (360 men , 1,128 women ).
51.4% of residents of South River speak English at home. of residents speak Spanish at home (40% speak English very well , 17% speak English well , 35% speak English not well , 8% don't speak English at all ).of residents speak other Indo-European language at home (59% speak English very well , 26% speak English well , 15% speak English not well , 1% don't speak English at all ).of residents speak Asian or Pacific Island language at home (78% speak English very well , 22% speak English well ).of residents speak other language at home (36% speak English very well , 20% speak English well , 18% speak English not well , 26% don't speak English at all ).
Foreign born population: 4,765 (29.6%)of them are naturalized citizens )
Median number of rooms in houses and condos:
Median number of rooms in apartments
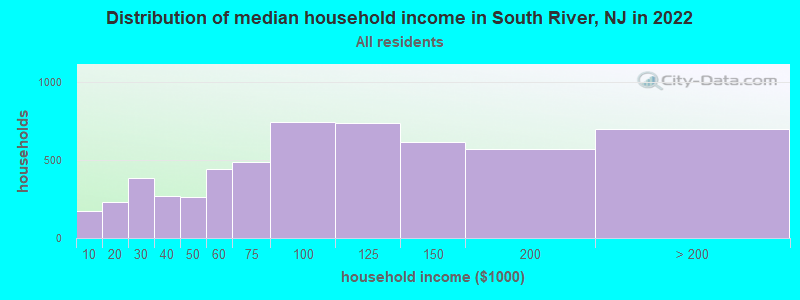
South River, NJ household income distribution 170 Less than $10,000230 $10,000 to $19,999385 $20,000 to $29,999267 $30,000 to $39,999261 $40,000 to $49,999443 $50,000 to $59,999487 $60,000 to $74,999743 $75,000 to $99,999735 $100,000 to $124,999612 $125,000 to $149,999570 $150,000 to $199,999701 $200,000 or more
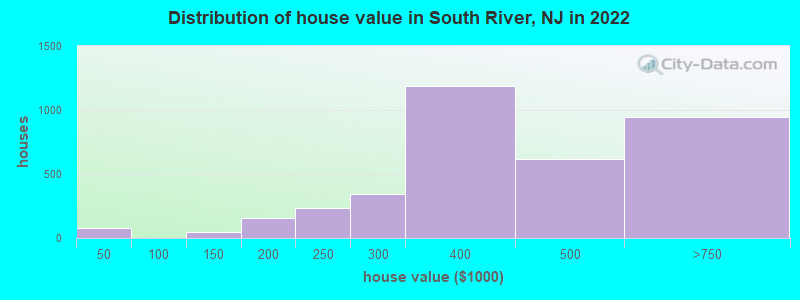
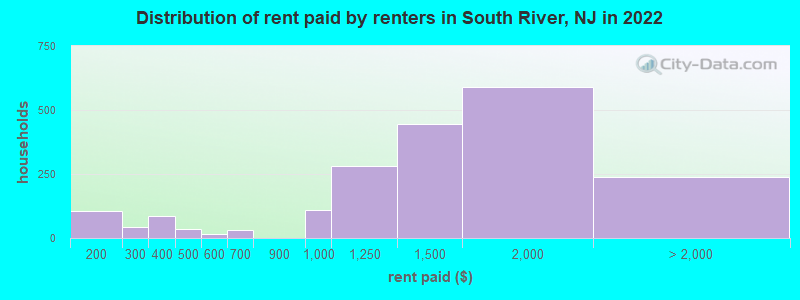
Home value of owner - occupied houses in 2022 in South River, NJ 25 Less than $10,0009 $20,000 to $24,99917 $25,000 to $29,99923 $35,000 to $39,9999 $100,000 to $124,99935 $125,000 to $149,999135 $150,000 to $174,99923 $175,000 to $199,999235 $200,000 to $249,999339 $250,000 to $299,9991,186 $300,000 to $399,999614 $400,000 to $499,999923 $500,000 to $749,99919 $750,000 to $999,999Rent paid by renters in 2022 in South River, NJ 106 $100 to $14926 $200 to $24915 $250 to $29967 $300 to $34918 $350 to $3995 $400 to $44929 $450 to $49914 $550 to $59929 $650 to $699110 $900 to $999280 $1,000 to $1,249444 $1,250 to $1,499588 $1,500 to $1,99998 $2,000 to $2,49911 $3,000 to $3,499128 No cash rent
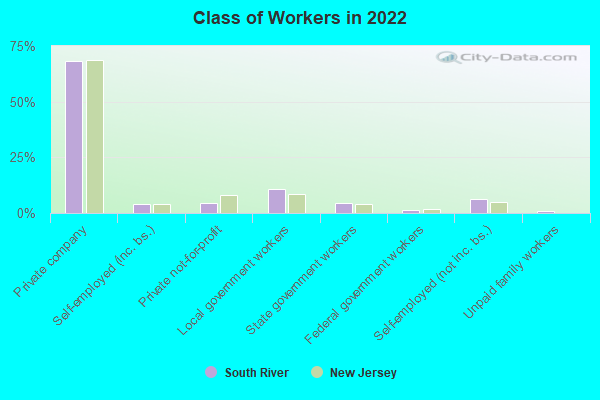
Percentage of workers working in this county: 69.4%Number of people working at home: 503 (6.3% of all workers )
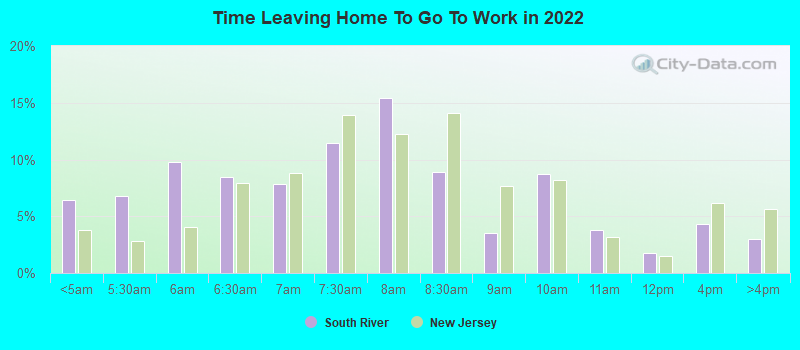
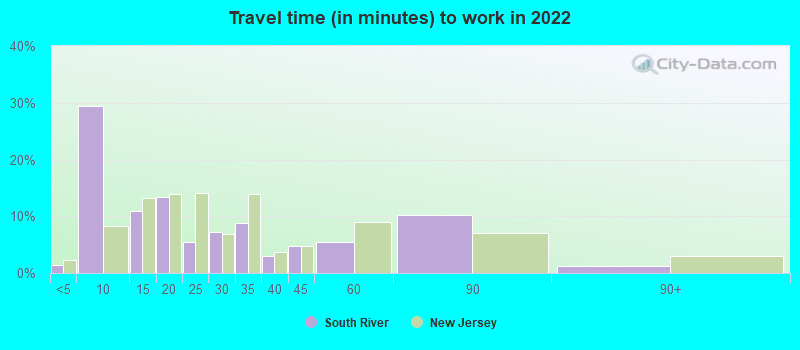
Travel time to work (commute)
Less than 5 minutes: 365 to 9 minutes: 1,06710 to 14 minutes: 42015 to 19 minutes: 1,07220 to 24 minutes: 72125 to 29 minutes: 45230 to 34 minutes: 1,24835 to 39 minutes: 24340 to 44 minutes: 39545 to 59 minutes: 43160 to 89 minutes: 70590 or more minutes: 440
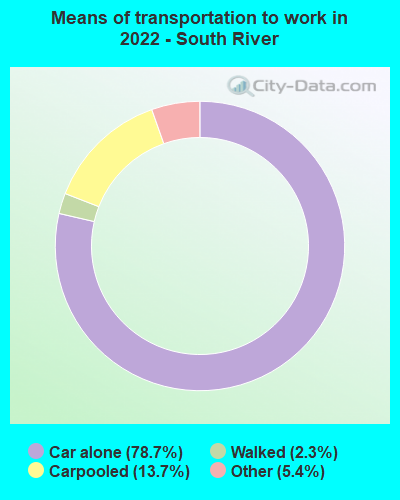
Means of transportation to work:
Drove a car alone: 1,905 (63.1%)Carpooled: 391 (12.9%)Taxi: 176 (5.8%)Walked: 81 (2.7%)Worked at home: 503 (16.7%)
Unemployment by race in 2022
Unemployment rate for White non-Hispanic residents 7.9% Males11.3% FemalesUnemployment rate for Black residents 0.3% MalesUnemployment rate for other race residents 10.8% FemalesUnemployment rate for two or more race residents 0.2% Males6.8% FemalesUnemployment rate for Hispanic or Latino residents 7.3% Males5.3% Females
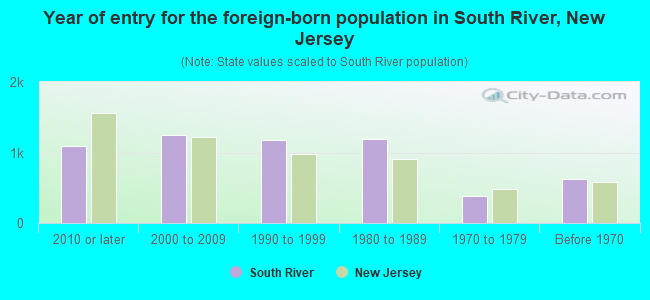
Year of entry for the foreign-born population in South River, New Jersey
1,099 2010 or later 1,247 2000 to 2009 1,171 1990 to 1999 1,189 1980 to 1989 383 1970 to 1979 630 Before 1970
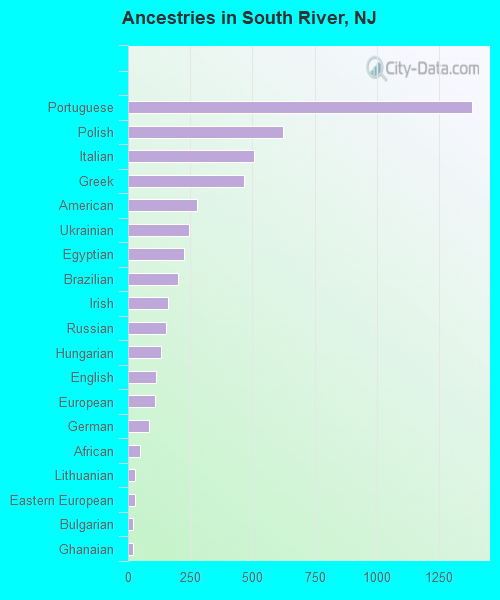
First ancestries reported:
Portuguese: 1,382 (15.7%)
Polish: 622 (7.1%)
Italian: 507 (5.8%)
Greek: 465 (5.3%)
American: 279 (3.2%)
Ukrainian: 246 (2.8%)
Egyptian: 224 (2.6%)
Brazilian: 199 (2.3%)
Irish: 159 (1.8%)
Russian: 153 (1.7%)
Hungarian: 132 (1.5%)
English: 113 (1.3%)
European: 110 (1.3%)
German: 84 (1.0%)
African: 49 (0.6%)
Lithuanian: 30 (0.3%)
Eastern European: 29 (0.3%)
Bulgarian: 21 (0.2%)
Ghanaian: 19 (0.2%)
Palestinian: 12 (0.1%)
Czech: 10 (0.1%)
Syrian: 9 (0.1%) Most common places of birth for foreign-born residents (%): Mexico South River:
16.9% (785)New Jersey:
4.8% (102,527)
Portugal South River:
14.3% (661)New Jersey:
1.3% (28,871)
Honduras South River:
9.4% (435)New Jersey:
1.7% (37,335)
Brazil South River:
8.3% (384)New Jersey:
2.1% (46,020)
Guatemala South River:
8.2% (379)New Jersey:
2.2% (46,813)
Poland South River:
5.5% (257)New Jersey:
2.3% (48,811)
China, excluding Hong Kong and Taiwan South River:
4.8% (222)New Jersey:
3.7% (78,969)
Philippines South River:
4.4% (205)New Jersey:
4.0% (85,934)
Ecuador South River:
4.4% (205)New Jersey:
4.4% (95,275)
Egypt South River:
4.4% (204)New Jersey:
1.6% (33,678)
Dominican Republic South River:
3.3% (152)New Jersey:
9.7% (209,055)
Greece South River:
2.6% (119)New Jersey:
0.3% (7,501)
Ukraine South River:
2.5% (118)New Jersey:
1.1% (22,760)
Place of birth for U.S.-born residents:
This state: 9,347Other state: 1,681Northeast: 1,142Midwest: 116South: 359West: 21 91.2% of South River residents lived in the same house 1 years ago.
Out of people who lived in different houses, 40.4% lived in this county.
Out of people who lived in different counties, 52.3% lived in New Jersey.
South River:
91.2%State average:
90.4%
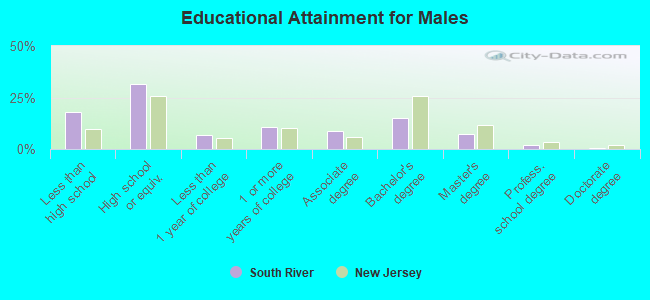
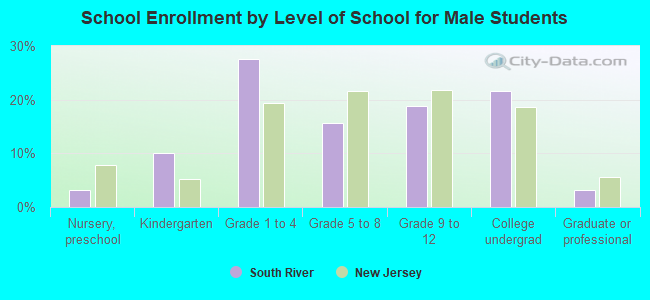
Education attainment for males 25 years and older:
No schooling: 341Nursery to 4th grade: 3225th and 6th grade: 777th and 8th grade: 209th grade: 010th grade: 011th grade: 612th grade, no diploma: 249High school graduate (or equivalency): 1,796Less than 1 year of college: 385Some college more than 1 year, no degree: 617Associate degree: 488Bachelor's degree: 861Master's degree: 416Professional school degree: 106Doctorate degree: 18
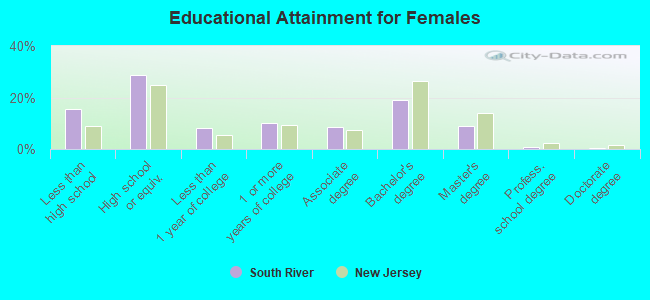
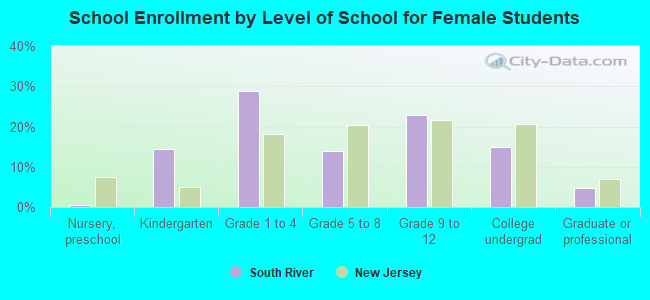
Education attainment for females 25 years and older:
No schooling: 251Nursery to 4th grade: 925th and 6th grade: 1487th and 8th grade: 819th grade: 14310th grade: 7211th grade: 2212th grade, no diploma: 70High school graduate (or equivalency): 1,616Less than 1 year of college: 456Some college more than 1 year, no degree: 566Associate degree: 490Bachelor's degree: 1,062Master's degree: 507Professional school degree: 45Doctorate degree: 15
Housing units in structures:
One, detached: 4,115One, attached: 74Two: 6863 or 4: 2145 to 9: 20310 to 19: 24620 to 49: 9950 or more: 162Mobile homes: 11Housing units lacking complete kitchen facilities in 2022: 0.1%House/condo owner moved in on average 19 years ago
Renter moved in on average 6 years ago
Private vs. public school enrollment:
Students in private schools in grades 1 to 8 (elementary and middle school): 179 Here:
12.1%New Jersey:
12.3%
Students in private schools in grades 9 to 12 (high school): 129 Here:
18.1%New Jersey:
13.1%
Students in private undergraduate colleges: 224 Here:
36.1%New Jersey:
33.2%