Housing density: 2,587 houses/condos per square mile
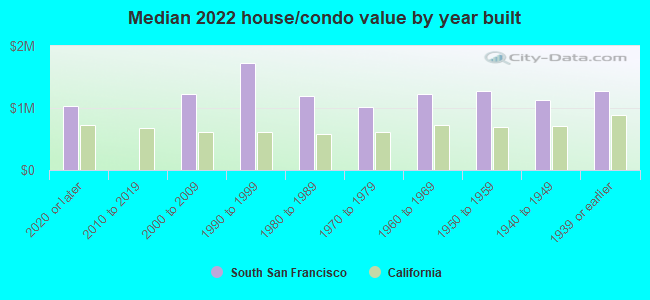
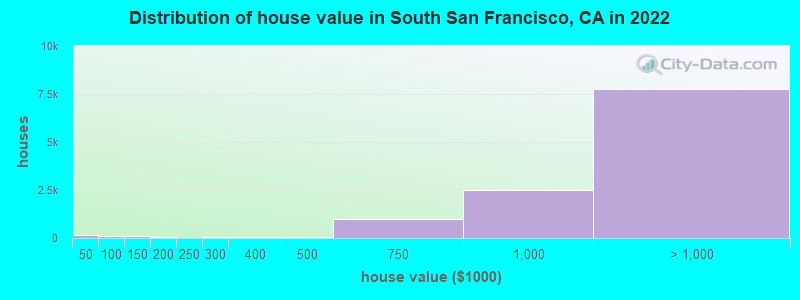
Median price asked for vacant for-sale houses and condos in 2022: $7,089,974.
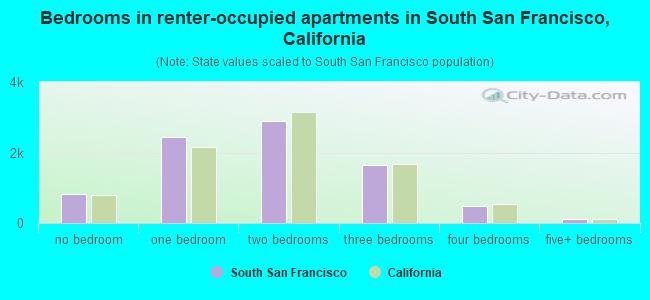
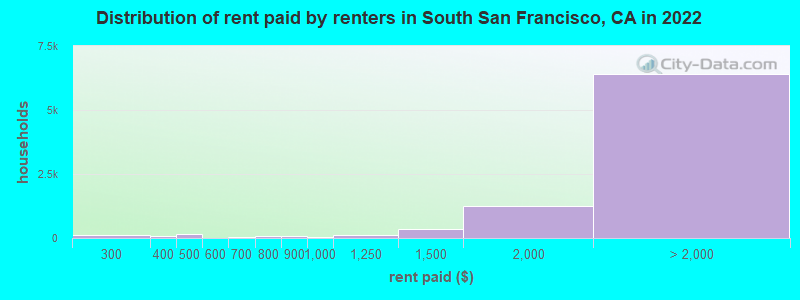
Median contract rent in 2022: over $2,000 (lower quartile is $1,890, upper quartile is over $2,000)
Median rent asked for vacant for-rent units in 2022: $4,095
Median gross rent in South San Francisco, CA in 2022: over $2,000
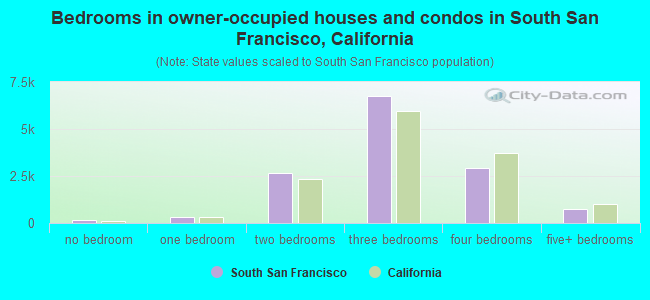
Housing units in South San Francisco with a mortgage: 8,465 (802 second mortgage, 5 home equity loan, 746 both second mortgage and home equity loan) Houses without a mortgage: 298
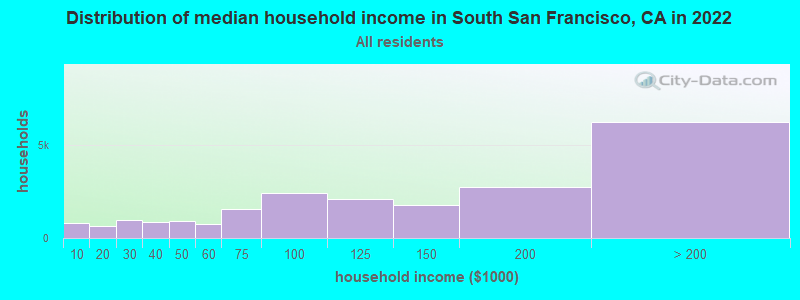
Median household income for houses/condos with a mortgage: $175,114
Median household income for apartments without a mortgage: $101,570
Median monthly housing costs: $2,520
Compare current foreclosures near South San Francisco, CA:
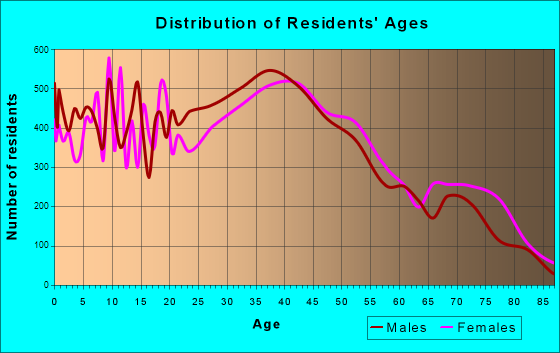
7,013 married couples with children.
2,034 single-parent households (759 men, 1,275 women).
48.5% of residents of South San Francisco speak English at home.
17.2% of residents speak Spanish at home (57% speak English very well, 19% speak English well, 15% speak English not well, 8% don't speak English at all).
5.6% of residents speak other Indo-European language at home (74% speak English very well, 17% speak English well, 7% speak English not well, 2% don't speak English at all).
27.1% of residents speak Asian or Pacific Island language at home (61% speak English very well, 26% speak English well, 10% speak English not well, 3% don't speak English at all).
1.4% of residents speak other language at home (63% speak English very well, 30% speak English well, 2% speak English not well, 5% don't speak English at all).
Foreign born population: 25,160 (39.7%)
(69.7% of them are naturalized citizens)
Percentage of workers working in this county: 69.0% Number of people working at home: 5,838 (17.3% of all workers)
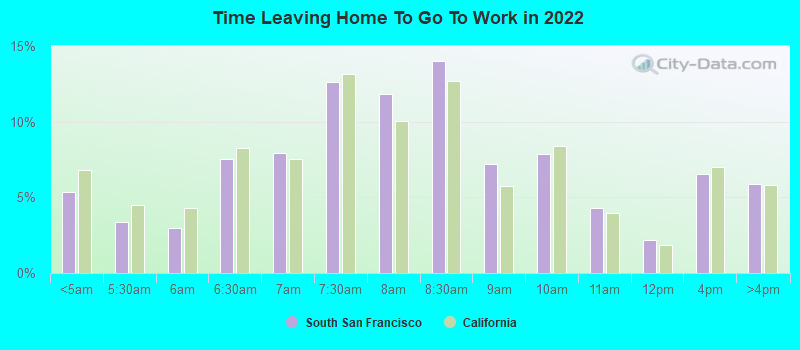
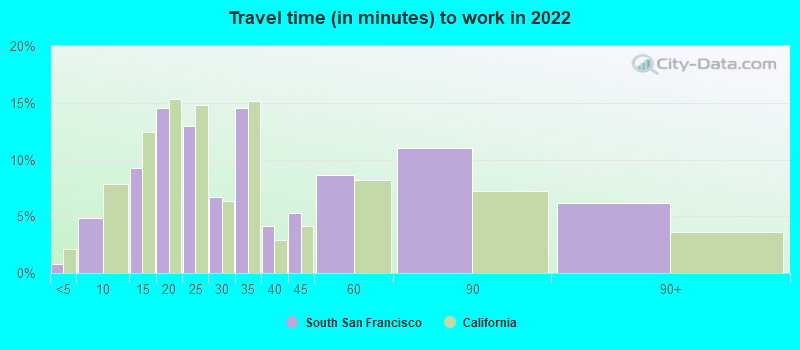
Travel time to work (commute)
Less than 5 minutes: 183
5 to 9 minutes: 1,753
10 to 14 minutes: 4,215
15 to 19 minutes: 4,585
20 to 24 minutes: 4,389
25 to 29 minutes: 1,422
30 to 34 minutes: 4,524
35 to 39 minutes: 1,160
40 to 44 minutes: 1,146
45 to 59 minutes: 1,843
60 to 89 minutes: 1,353
90 or more minutes: 458
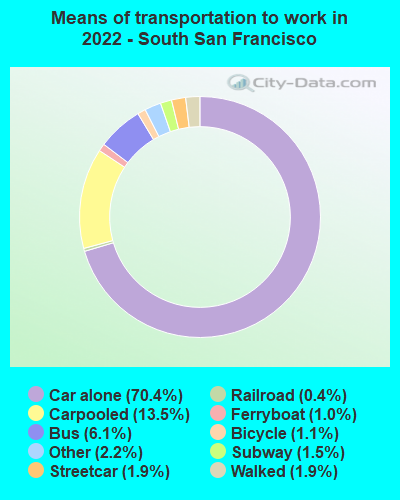
Means of transportation to work:
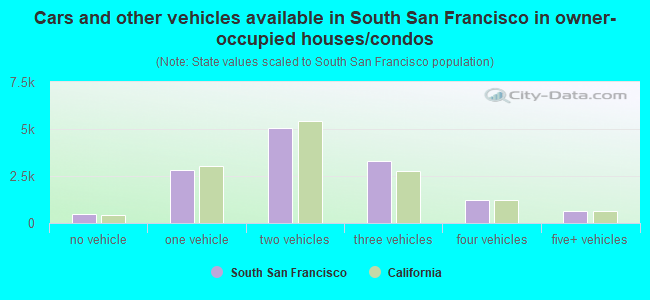
Drove a car alone: 32,260 (60.1%)
Carpooled: 6,781 (12.6%)
Bus: 2,495 (4.6%)
Subway or elevated rail: 701 (1.3%)
Long-distance train or commuter rail: 676 (1.3%)
Light rail, streetcar or trolley: 182 (0.3%)
Ferryboat: 807 (1.5%)
Taxi: 829 (1.5%)
Bicycle: 595 (1.1%)
Walked: 978 (1.8%)
Worked at home: 5,838 (10.9%)
Unemployment by race in 2022
Unemployment rate for White non-Hispanic residents
2.3%Males
1.3%Females
Unemployment rate for Black residents
0.9%Males
Unemployment rate for American Indian and Alaska Native residents
9.4%Females
Unemployment rate for Asian residents
1.4%Males
1.4%Females
Unemployment rate for other race residents
0.5%Males
2.8%Females
Unemployment rate for two or more race residents
1.6%Males
2.4%Females
Unemployment rate for Hispanic or Latino residents
1.0%Males
2.6%Females
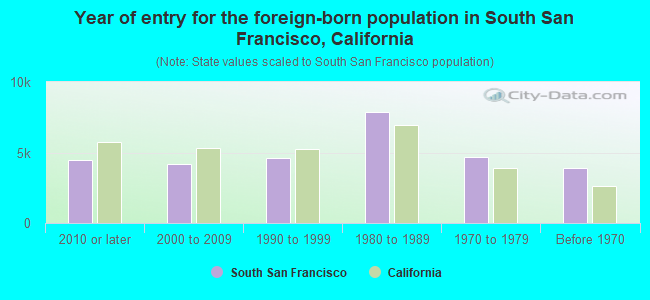
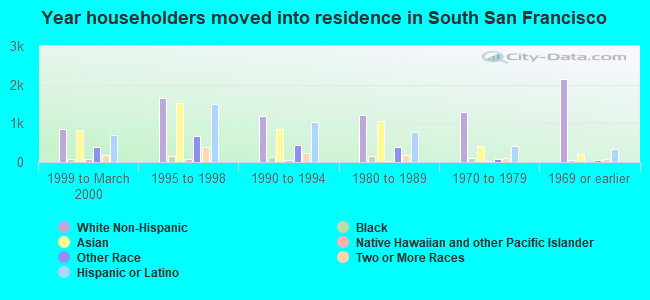
Year of entry for the foreign-born population in South San Francisco, California
4,4482010 or later
4,2122000 to 2009
4,6241990 to 1999
7,8511980 to 1989
4,6981970 to 1979
3,922Before 1970
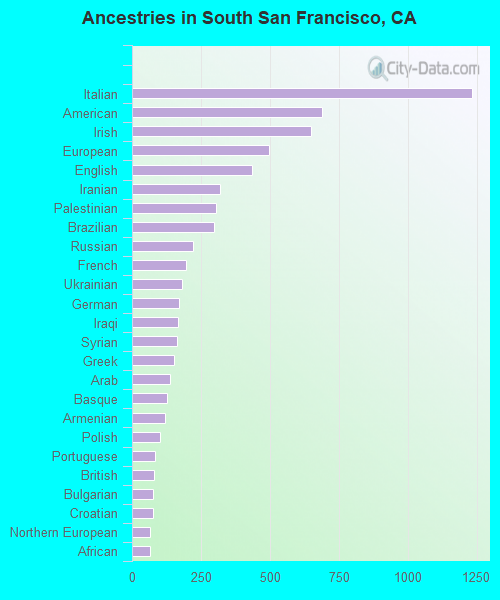
First ancestries reported:
Italian: 1,233 (3.0%)
American: 689 (1.7%)
Irish: 649 (1.6%)
European: 498 (1.2%)
English: 434 (1.0%)
Iranian: 319 (0.8%)
Palestinian: 306 (0.7%)
Brazilian: 298 (0.7%)
Russian: 220 (0.5%)
French: 196 (0.5%)
Ukrainian: 181 (0.4%)
German: 171 (0.4%)
Iraqi: 167 (0.4%)
Syrian: 163 (0.4%)
Greek: 151 (0.4%)
Arab: 139 (0.3%)
Basque: 127 (0.3%)
Armenian: 119 (0.3%)
Polish: 100 (0.2%)
Portuguese: 82 (0.2%)
British: 78 (0.2%)
Bulgarian: 76 (0.2%)
Croatian: 75 (0.2%)
Northern European: 67 (0.2%)
African: 66 (0.2%)
Jamaican: 63 (0.2%)
Eastern European: 37 (0.09%)
Swedish: 35 (0.08%)
Welsh: 32 (0.08%)
Jordanian: 30 (0.07%)
Scotch-Irish: 28 (0.07%)
Nigerian: 27 (0.06%)
Maltese: 22 (0.05%)
Icelander: 21 (0.05%)
Swiss: 20 (0.05%)
Turkish: 19 (0.05%)
Scottish: 17 (0.04%)
Finnish: 15 (0.04%)
Hungarian: 14 (0.03%)
Egyptian: 13 (0.03%)
Scandinavian: 11 (0.03%)
Israeli: 9 (0.02%)
Czech: 8 (0.02%)
Assyrian: 6 (0.01%)
Austrian: 6 (0.01%)
Most common places of birth for foreign-born residents (%):
Philippines
South San Francisco:
31.2% (7,955)
California:
7.8% (818,297)
Mexico
South San Francisco:
15.8% (4,026)
California:
37.2% (3,881,193)
China, excluding Hong Kong and Taiwan
South San Francisco:
10.7% (2,734)
California:
6.6% (684,672)
Hong Kong
South San Francisco:
5.5% (1,404)
California:
1.0% (105,215)
El Salvador
South San Francisco:
4.9% (1,258)
California:
4.2% (440,287)
Nicaragua
South San Francisco:
2.9% (731)
California:
0.6% (58,161)
India
South San Francisco:
2.6% (669)
California:
5.2% (539,184)
Vietnam
South San Francisco:
2.4% (611)
California:
4.9% (512,335)
Burma (Myanmar)
South San Francisco:
1.8% (464)
California:
0.3% (28,176)
Fiji
South San Francisco:
1.8% (452)
California:
0.3% (33,937)
Place of birth for U.S.-born residents:
This state: 31,590
Other state: 5,458
Northeast: 1,045
Midwest: 1,523
South: 1,718
West: 1,194
89.7% of South San Francisco residents lived in the same house 1 years ago. Out of people who lived in different houses, 38.7% lived in this county. Out of people who lived in different counties, 69.0% lived in California.
South San Francisco:
89.7%
State average:
88.9%
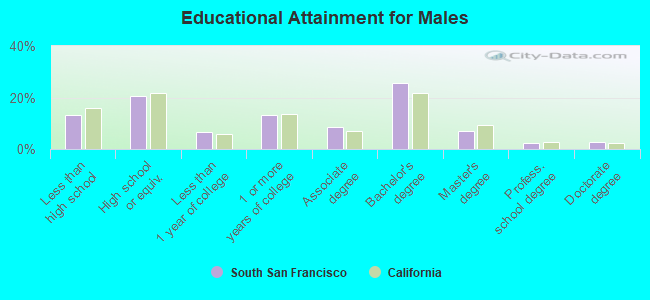
Education attainment for males 25 years and older:
No schooling: 747
Nursery to 4th grade: 122
5th and 6th grade: 1,072
7th and 8th grade: 234
9th grade: 292
10th grade: 161
11th grade: 93
12th grade, no diploma: 364
High school graduate (or equivalency): 4,838
Less than 1 year of college: 1,541
Some college more than 1 year, no degree: 3,096
Associate degree: 2,003
Bachelor's degree: 5,974
Master's degree: 1,646
Professional school degree: 505
Doctorate degree: 613
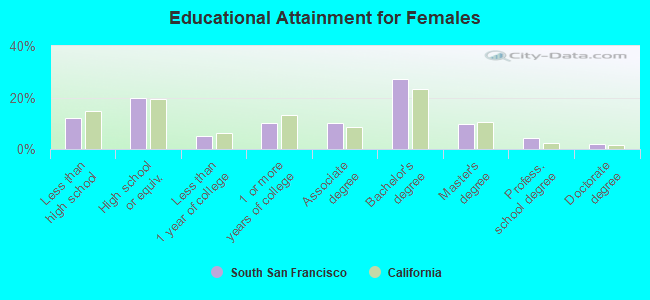
Education attainment for females 25 years and older:
No schooling: 909
Nursery to 4th grade: 256
5th and 6th grade: 574
7th and 8th grade: 206
9th grade: 274
10th grade: 101
11th grade: 145
12th grade, no diploma: 426
High school graduate (or equivalency): 4,790
Less than 1 year of college: 1,198
Some college more than 1 year, no degree: 2,470
Associate degree: 2,397
Bachelor's degree: 6,552
Master's degree: 2,352
Professional school degree: 1,008
Doctorate degree: 422
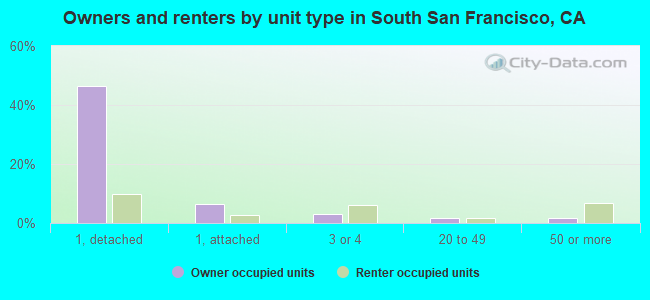
Housing units in structures:
One, detached: 13,942
One, attached: 2,403
Two: 458
3 or 4: 1,193
5 to 9: 1,071
10 to 19: 795
20 to 49: 945
50 or more: 2,184
Mobile homes: 314
Boats, RVs, vans, etc.: 28
Housing units lacking complete plumbing facilities in 2022: 0.1%
Housing units lacking complete kitchen facilities in 2022: 1.6%
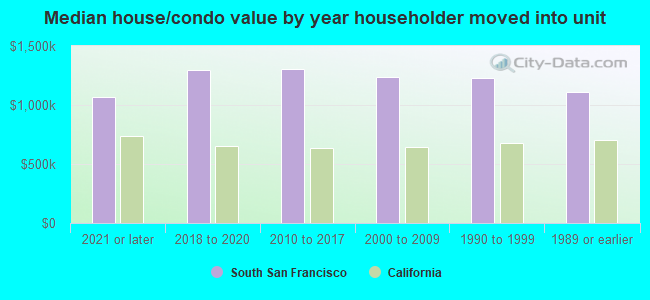
House/condo owner moved in on average 19 years ago