Housing density: 1,256 houses/condos per square mile
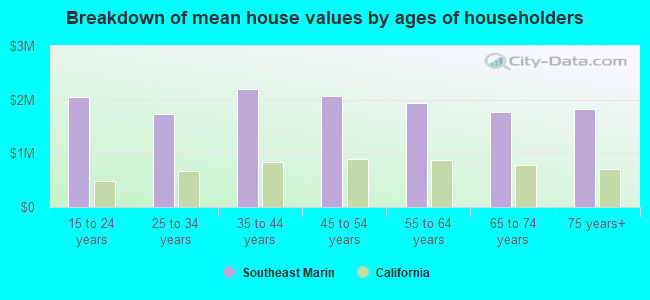
Median price asked for vacant for-sale houses and condos in 2022 in this county: $3,364,178.
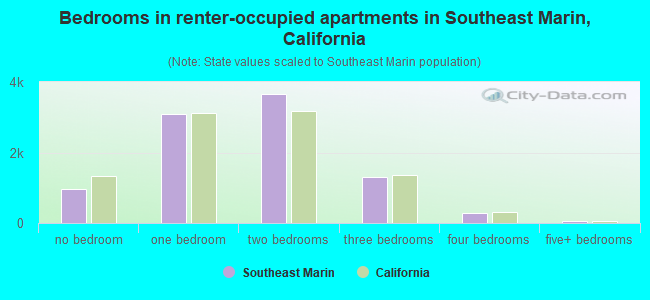
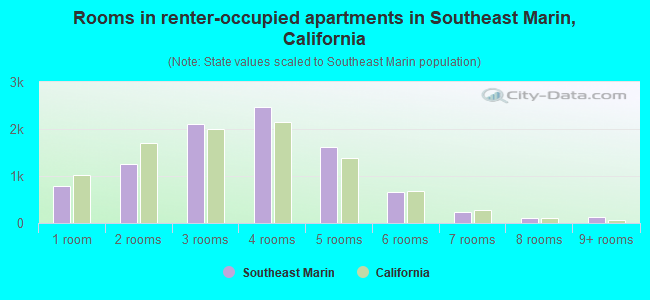
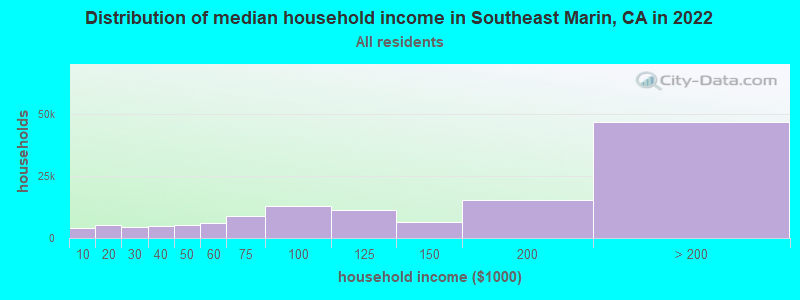
Median contract rent in 2022: over $2,000 (lower quartile is $1,802, upper quartile is over $2,000)
Median rent asked for vacant for-rent units in 2022: $3,703
Median gross rent in Southeast Marin, CA in 2022: over $2,000
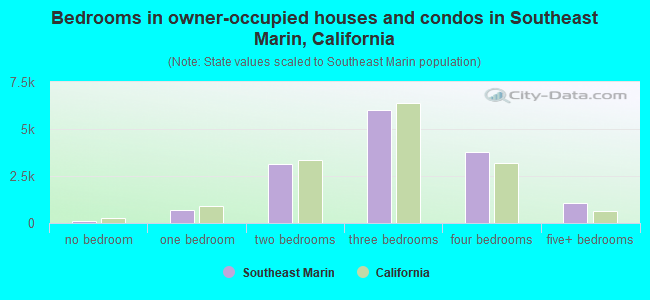
Housing units in Southeast Marin with a mortgage: 9,727 (963 second mortgage, 1,561 home equity loan, 64 both second mortgage and home equity loan) Houses without a mortgage: 2,847
Compare current foreclosures near Southeast Marin, CA:
In family households: 191,262 (43,203 male householders, 19,450 female householders)
49,659 spouses, 62,232 children (59,064 natural, 1,706 adopted, 1,462 stepchildren), 1,786 grandchildren, 2,214 brothers or sisters, 1,536 parents, foster children, 2,886 other relatives, 7,223 non-relatives
In nonfamily households: 52,103 (16,442 male householders (11,939 living alone)), 24,115 female householders (19,807 living alone)), 11,546 nonrelatives
In group quarters: 9,044 (6,299 institutionalized population)
36,987 married couples with children.
9,764 single-parent households (2,409 men, 7,355 women).
85.6% of residents of Southeast Marin speak English at home.
3.6% of residents speak Spanish at home (72% speak English very well, 19% speak English well, 9% speak English not well).
7.5% of residents speak other Indo-European language at home (80% speak English very well, 15% speak English well, 4% speak English not well, 1% don't speak English at all).
2.6% of residents speak Asian or Pacific Island language at home (61% speak English very well, 25% speak English well, 13% speak English not well, 1% don't speak English at all).
0.7% of residents speak other language at home (85% speak English very well, 11% speak English well, 2% speak English not well, 3% don't speak English at all).
Foreign born population: 8,246 (15.3%)
(71.0% of them are naturalized citizens)
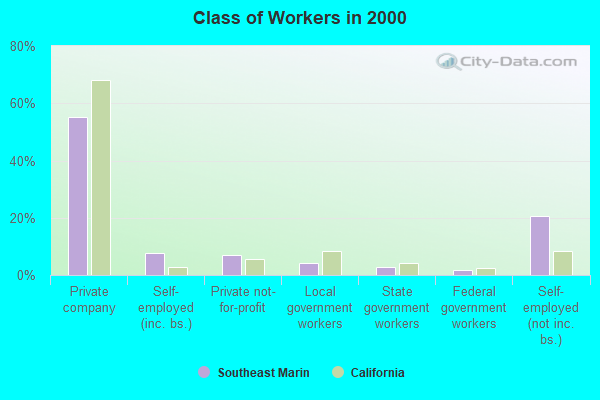
Percentage of workers working in this county: 62.2% Number of people working at home: 9,098 (32.7% of all workers)
Travel time to work (commute)
Less than 5 minutes: 709
5 to 9 minutes: 1,924
10 to 14 minutes: 2,619
15 to 19 minutes: 2,709
20 to 24 minutes: 2,438
25 to 29 minutes: 1,504
30 to 34 minutes: 3,697
35 to 39 minutes: 1,181
40 to 44 minutes: 1,795
45 to 59 minutes: 3,692
60 to 89 minutes: 2,459
90 or more minutes: 646
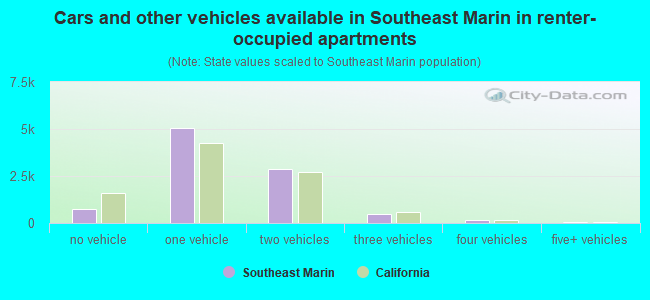
Means of transportation to work:
Drove a car alone: 17,629 (61.4%)
Carpooled: 2,718 (9.5%)
Bus or trolley bus: 2,374 (8.3%)
Streetcar or trolley car: 5 (0.0%)
Subway or elevated: 37 (0.1%)
Railroad: 75 (0.3%)
Ferryboat: 1,020 (3.6%)
Taxi: 28 (0.1%)
Motorcycle: 130 (0.5%)
Bicycle: 257 (0.9%)
Walked: 967 (3.4%)
Other means: 133 (0.5%)
Worked at home: 3,344 (11.6%)
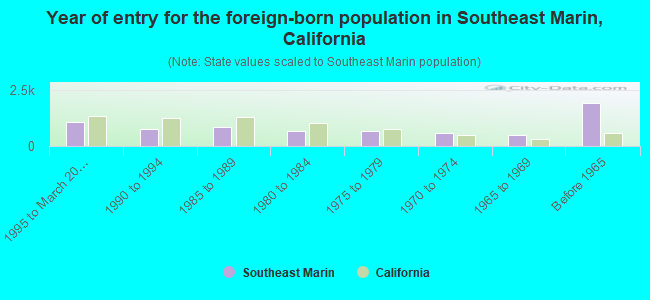
Year of entry for the foreign-born population in Southeast Marin, California
1,0721995 to March 2000
7571990 to 1994
8581985 to 1989
6941980 to 1984
6941975 to 1979
6031970 to 1974
4741965 to 1969
1,920Before 1965
Most common places of birth for foreign-born residents (%):
United Kingdom
Southeast Marin:
11.8% (833)
California:
1.5% (133,090)
Canada
Southeast Marin:
9.5% (672)
California:
1.6% (141,181)
Germany
Southeast Marin:
8.1% (574)
California:
1.1% (98,160)
Iran
Southeast Marin:
5.1% (360)
California:
1.8% (158,613)
India
Southeast Marin:
4.0% (280)
California:
2.2% (198,201)
Other Northern Europe
Southeast Marin:
3.2% (227)
California:
0.2% (18,478)
Japan
Southeast Marin:
3.2% (224)
California:
1.3% (112,212)
Korea
Southeast Marin:
3.1% (222)
California:
3.0% (268,452)
Vietnam
Southeast Marin:
2.8% (195)
California:
4.7% (418,249)
France
Southeast Marin:
2.7% (194)
California:
0.4% (32,279)
Mexico
Southeast Marin:
2.7% (191)
California:
44.3% (3,928,701)
Sweden
Southeast Marin:
2.5% (178)
California:
0.1% (11,383)
Brazil
Southeast Marin:
2.5% (177)
California:
0.3% (22,931)
China, excluding Hong Kong and Taiwan
Southeast Marin:
2.3% (163)
California:
3.7% (327,611)
South Africa
Southeast Marin:
2.1% (152)
California:
0.2% (14,359)
Ireland
Southeast Marin:
2.1% (151)
California:
0.2% (20,388)
El Salvador
Southeast Marin:
1.9% (135)
California:
4.1% (359,673)
Australia
Southeast Marin:
1.8% (124)
California:
0.2% (15,391)
Netherlands
Southeast Marin:
1.7% (122)
California:
0.3% (22,311)
Peru
Southeast Marin:
1.6% (111)
California:
0.6% (53,250)
Place of birth for U.S.-born residents:
This state: 21,496
Other state: 22,720
Northeast: 8,200
Midwest: 7,120
South: 3,952
West: 3,448
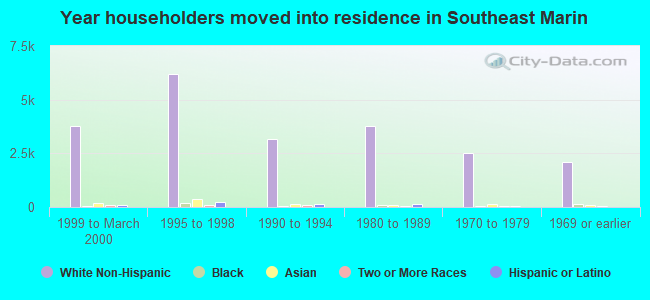
58% of Southeast Marin residents lived in the same house 5 years ago. Out of people who lived in different houses, 42% lived in this county. Out of people who lived in different counties, 59% lived in California.
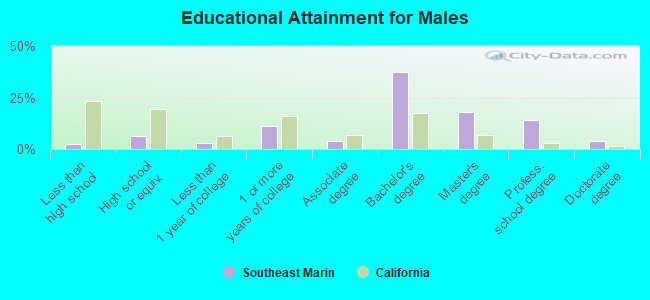
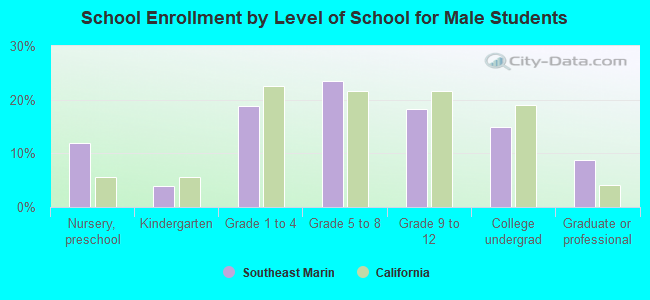
Education attainment for males 25 years and older:
No schooling: 10
Nursery to 4th grade: 10
5th and 6th grade: 44
7th and 8th grade: 121
9th grade: 65
10th grade: 67
11th grade: 32
12th grade, no diploma: 119
High school graduate (or equivalency): 1,143
Less than 1 year of college: 550
Some college more than 1 year, no degree: 2,068
Associate degree: 748
Bachelor's degree: 7,041
Master's degree: 3,324
Professional school degree: 2,645
Doctorate degree: 730
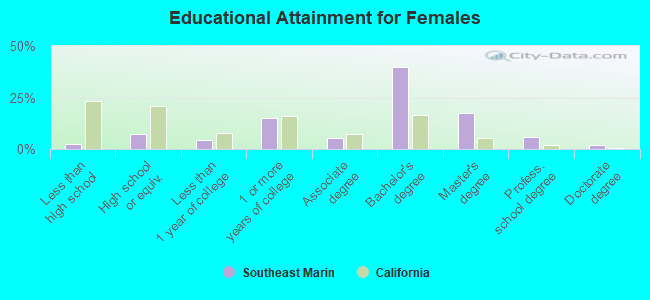
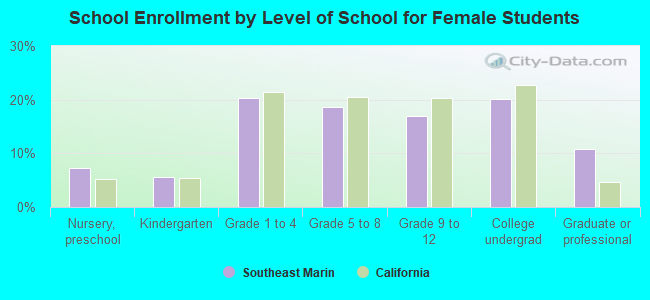
Education attainment for females 25 years and older:
No schooling: 26
Nursery to 4th grade: 35
5th and 6th grade: 44
7th and 8th grade: 68
9th grade: 17
10th grade: 79
11th grade: 79
12th grade, no diploma: 138
High school graduate (or equivalency): 1,631
Less than 1 year of college: 951
Some college more than 1 year, no degree: 3,327
Associate degree: 1,213
Bachelor's degree: 8,708
Master's degree: 3,821
Professional school degree: 1,312
Doctorate degree: 434
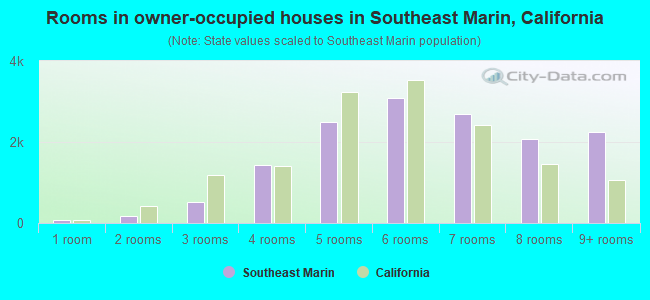
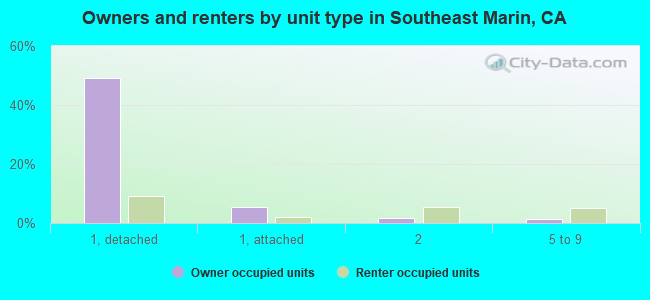
Housing units in structures:
One, detached: 14,490
One, attached: 1,916
Two: 1,769
3 or 4: 1,511
5 to 9: 1,739
10 to 19: 1,351
20 to 49: 1,028
50 or more: 916
Mobile homes: 24
Boats, RVs, vans, etc.: 363
Median worth of mobile homes: $387,625
Housing units lacking complete plumbing facilities: 0.5%
Housing units lacking complete kitchen facilities: 1.0%