Southfield, MI (Michigan) Houses and Residents
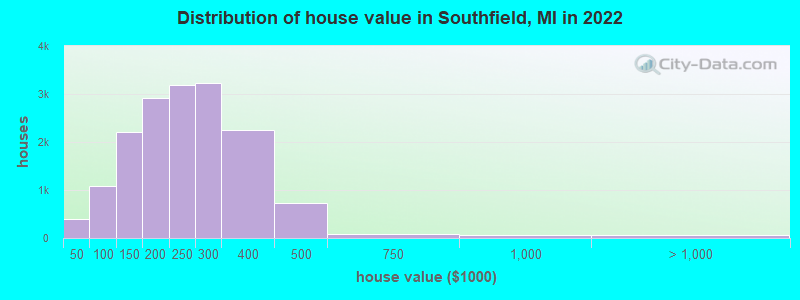
Estimated median house or condo value in 2022: $245,200 (it was $151,200 in 2000 )
Southfield:
$245,200Michigan:
$224,400
Lower value quartile - upper value quartile: $168,800 - $305,900Mean price in 2022: Detached houses: $244,072 Here:
$244,072State:
$280,038
Townhouses or other attached units: $152,132 Here:
$152,132State:
$239,520
In 3-to-4-unit structures: $77,187 Here:
$77,187State:
$207,067
In 5-or-more-unit structures: $141,220 Here:
$141,220State:
$192,733
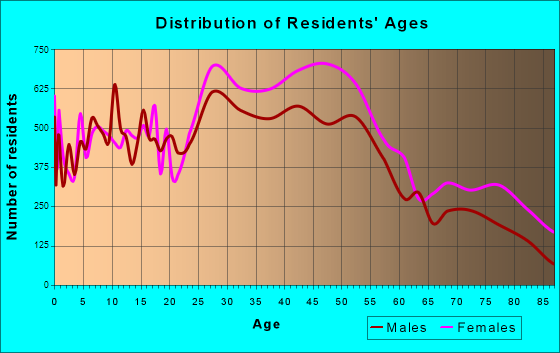
Total population: 73,002 (All urban)
Houses: 39,550 (35,291 occupied: 19,135 owner occupied, 16,156 renter occupied )
% of renters here:
46%State:
27%
Housing density: 1,508 houses/condos per square mile
Median price asked for vacant for-sale houses and condos in 2022: $1,442,720.
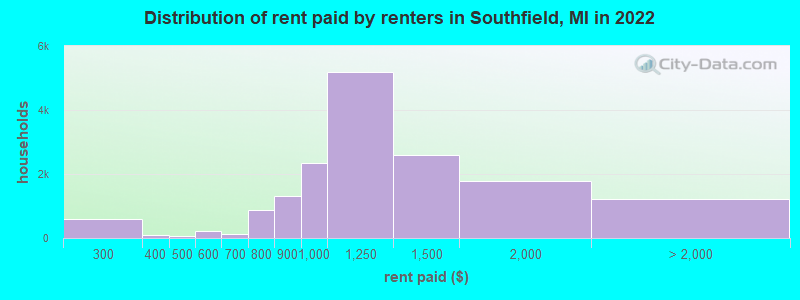
Median contract rent in 2022: $1,034 (lower quartile is $875, upper quartile is $1,322)
Median rent asked for vacant for-rent units in 2022: $1,663
Median gross rent in Southfield, MI in 2022: $1,183
Housing units in Southfield with a mortgage: 12,278 (992 second mortgage, 69 home equity loan, 742 both second mortgage and home equity loan )Houses without a mortgage: 561
Median household income for houses/condos with a mortgage: $81,245
Median household income for apartments without a mortgage: $85,611
Median monthly housing costs: $1,215
Data:
Median house or condo value ($)
Median house or condo value ($ change since 2000)
Median house or condo value ($) - White
Median house or condo value ($) - Black or African American
Median house or condo value ($) - Asian
Median house or condo value ($) - Hispanic or Latino
Median house or condo value ($) - American Indian and Alaska Native
Median house or condo value ($) - Multirace
Median house or condo value ($) - Other Race
Median price asked for mobile homes ($)
Household density (households per square mile)
Mean house or condo value by units in structure - 1, detached ($)
Mean house or condo value by units in structure - 1, attached ($)
Mean house or condo value by units in structure - 2 ($)
Mean house or condo value by units in structure by units in structure - 3 or 4 ($)
Mean house or condo value by units in structure - 5 or more ($)
Mean house or condo value by units in structure - Boat, RV, van, etc. ($)
Mean house or condo value by units in structure - Mobile home ($)
Median contract rent ($)
Median contract rent - Lower quartile ($)
Median contract rent - Upper quartile ($)
Median gross rent ($)
Urban houses (%)
Rural houses (%)
Houses occupied (%)
Houses occupied (% change since 2000)
Houses owner occupied (%)
Houses owner occupied (% change since 2000)
Houses renter occupied (%)
Houses renter occupied (% change since 2000)
Vacant housing units - For rent (%)
Vacant housing units - For rent (% change since 2000)
Vacant housing units - For sale only (%)
Vacant housing units - For sale only (% change since 2000)
Vacant housing units - Rented or sold, not occupied (%)
Vacant housing units - Rented or sold, not occupied (% change since 2000)
Vacant housing units - For seasonal, recreational, or occasional use (%)
Vacant housing units - For seasonal, recreational, or occasional use (% change since 2000)
Vacant housing units - For migrant workers (%)
Vacant housing units - For migrant workers (% change since 2000)
Vacant housing units - Other vacant (%)
Vacant housing units - Other vacant (% change since 2000)
Median monthly housing costs ($)
Median household income for houses/condos with a mortgage ($)
Median household income for houses/condos without a mortgage ($)
Median household income ($)
Median household income ($) - White
Median household income ($) - Black or African American
Median household income ($) - Asian
Median household income ($) - Hispanic or Latino
Median household income ($) - American Indian and Alaska Native
Median household income ($) - Multirace
Median household income ($) - Other Race
Mortgage status - with mortgage (%)
Mortgage status - with second mortgage (%)
Mortgage status - with home equity loan (%)
Mortgage status - with both second mortgage and home equity loan (%)
Mortgage status - without a mortgage (%)
Median year house/condo built
Median year apartment built
Household type by relationship - Male householder living alone (%)
Household type by relationship - Male householder not living alone (%)
Household type by relationship - Female householder living alone (%)
Household type by relationship - Female householder not living alone (%)
Household type by relationship - Opposite-Sex spouse (%)
Household type by relationship - Same-Sex spouse (%)
Household type by relationship - Opposite-Sex unmarried partner (%)
Household type by relationship - Same-Sex unmarried partner (%)
Household type by relationship - In group quarters (%)
Size of family households - 2-person household (%)
Size of family households - 3-person household (%)
Size of family households - 4-person household (%)
Size of family households - 5-person household (%)
Size of family households - 6-person household (%)
Size of family households - 7-or-more-person household (%)
Size of nonfamily households - 1-person household (%)
Size of nonfamily households - 2-person household (%)
Size of nonfamily households - 3-person household (%)
Size of nonfamily households - 4-person household (%)
Size of nonfamily households - 5-person household (%)
Size of nonfamily households - 6-person household (%)
Size of nonfamily households - 7-or-moreperson household (%)
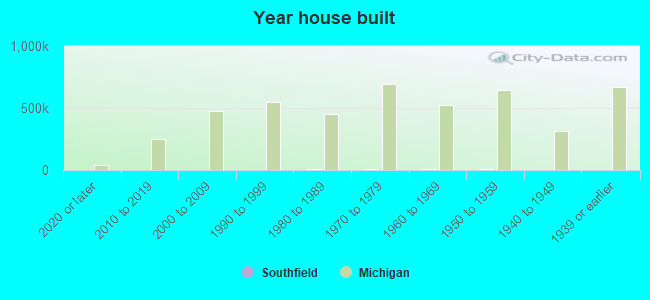
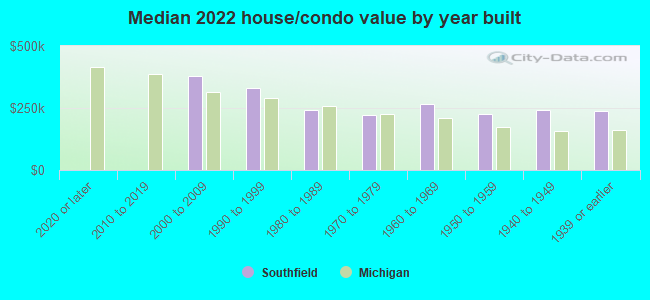
Year house built - Built 2010 or later (%)
Year house built - Built 2000 to 2009 (%)
Year house built - Built 1990 to 1999 (%)
Year house built - Built 1980 to 1989 (%)
Year house built - Built 1970 to 1979 (%)
Year house built - Built 1960 to 1969 (%)
Year house built - Built 1950 to 1959 (%)
Year house built - Built 1940 to 1949 (%)
Year house built - Built 1939 or earlier (%)
Median number of rooms in houses and condos
Median number of rooms in apartments
Median number of bedrooms in owner occupied houses
Mean number of bedrooms in owner occupied houses
Median number of bedrooms in renter occupied houses
Mean number of bedrooms in renter occupied houses
Median number of vehichles in owner occupied houses
Mean number of vehichles in owner occupied houses
Median number of vehichles in renter occupied houses
Mean number of vehichles in renter occupied houses
Rooms in owner-occupied houses - 1 room (%)
Rooms in owner-occupied houses - 2 rooms (%)
Rooms in owner-occupied houses - 3 rooms (%)
Rooms in owner-occupied houses - 4 rooms (%)
Rooms in owner-occupied houses - 5 rooms (%)
Rooms in owner-occupied houses - 6 rooms (%)
Rooms in owner-occupied houses - 7 rooms (%)
Rooms in owner-occupied houses - 8 rooms (%)
Rooms in owner-occupied houses - 9+ rooms (%)
Rooms in renter-occupied houses - 1 room (%)
Rooms in renter-occupied houses - 2 rooms (%)
Rooms in renter-occupied houses - 3 rooms (%)
Rooms in renter-occupied houses - 4 rooms (%)
Rooms in renter-occupied houses - 5 rooms (%)
Rooms in renter-occupied houses - 6 rooms (%)
Rooms in renter-occupied houses - 7 rooms (%)
Rooms in renter-occupied houses - 8 rooms (%)
Rooms in renter-occupied houses - 9+ rooms (%)
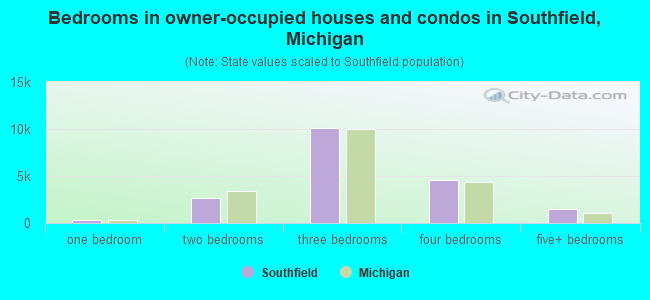
Bedrooms in owner-occupied houses - no bedrooms (%)
Bedrooms in owner-occupied houses - 1 bedroom (%)
Bedrooms in owner-occupied houses - 2 bedrooms (%)
Bedrooms in owner-occupied houses - 3 bedrooms (%)
Bedrooms in owner-occupied houses - 4 bedrooms (%)
Bedrooms in owner-occupied houses - 5+ bedrooms (%)
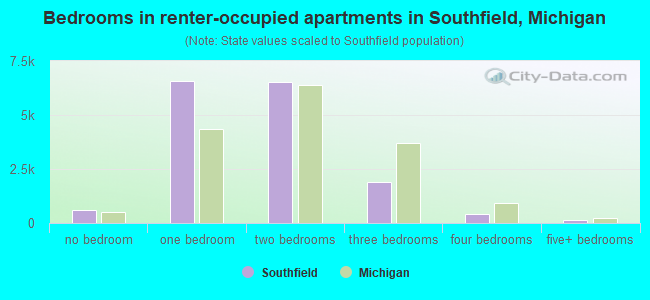
Bedrooms in renter-occupied houses - no bedrooms (%)
Bedrooms in renter-occupied houses - 1 bedroom (%)
Bedrooms in renter-occupied houses - 2 bedrooms (%)
Bedrooms in renter-occupied houses - 3 bedrooms (%)
Bedrooms in renter-occupied houses - 4 bedrooms (%)
Bedrooms in renter-occupied houses - 5+ bedrooms (%)
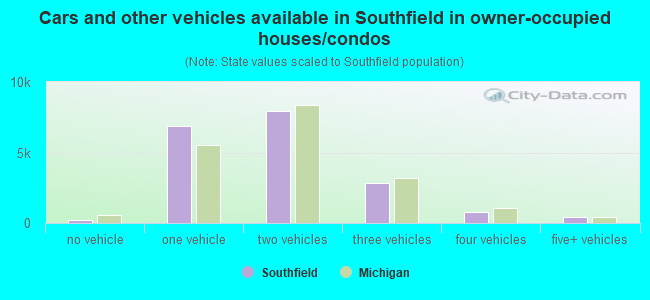
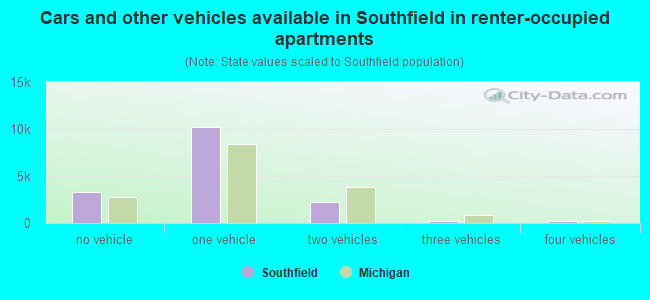
Vehicles available in owner-occupied houses - no vehicle available (%)
Vehicles available in owner-occupied houses - 1 vehicle available(%)
Vehicles available in owner-occupied houses - 2 Vehicles available (%)
Vehicles available in owner-occupied houses - 3 Vehicles available (%)
Vehicles available in owner-occupied houses - 4 Vehicles available (%)
Vehicles available in owner-occupied houses - 5+ Vehicles available (%)
Vehicles available in renter-occupied houses - no vehicle available (%)
Vehicles available in renter-occupied houses - 1 vehicle available (%)
Vehicles available in renter-occupied houses - 2 Vehicles available (%)
Vehicles available in renter-occupied houses - 3 Vehicles available (%)
Vehicles available in renter-occupied houses - 4 Vehicles available (%)
Vehicles available in renter-occupied houses - 5+ Vehicles available (%)
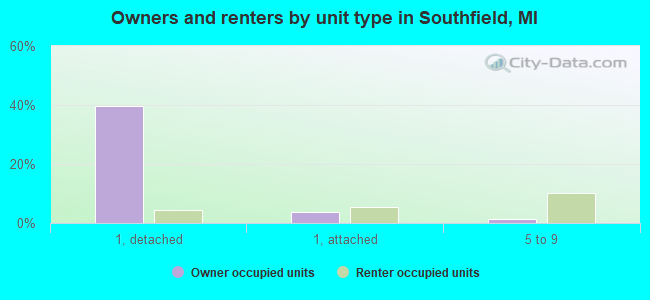
Housing units in structures - 1, detached (%)
Housing units in structures - 1, attached (%)
Housing units in structures - 2 (%)
Housing units in structures - 3 or 4 (%)
Housing units in structures - 5 to 9 (%)
Housing units in structures - 10 to 19 (%)
Housing units in structures - 20 to 49 (%)
Housing units in structures - 50 or more (%)
Housing units in structures - Mobile home (%)
Housing units in structures - Boat, RV, van, etc. (%)
Housing units in structures - Owners - 1, detached (%)
Housing units in structures - Owners - 1, attached (%)
Housing units in structures - Owners - 2 (%)
Housing units in structures - Owners - 3 or 4 (%)
Housing units in structures - Owners - 5 to 9 (%)
Housing units in structures - Owners - 10 to 19 (%)
Housing units in structures - Owners - 20 to 49 (%)
Housing units in structures - Owners - 50 or more (%)
Housing units in structures - Owners - Mobile home (%)
Housing units in structures - Owners - Boat, RV, van, etc. (%)
Housing units in structures - Renters - 1, detached (%)
Housing units in structures - Renters - 1, attached (%)
Housing units in structures - Renters - 2 (%)
Housing units in structures - Renters - 3 or 4 (%)
Housing units in structures - Renters - 5 to 9 (%)
Housing units in structures - Renters - 10 to 19 (%)
Housing units in structures - Renters - 20 to 49 (%)
Housing units in structures - Renters - 50 or more (%)
Housing units in structures - Renters - Mobile home (%)
Housing units in structures - Renters - Boat, RV, van, etc. (%)
House/condo owner moved in on average (years ago)
Renter moved in on average (years ago)
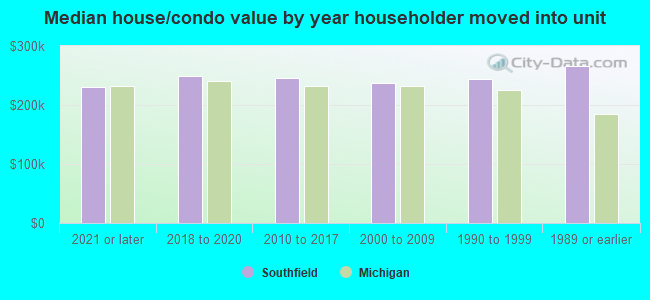
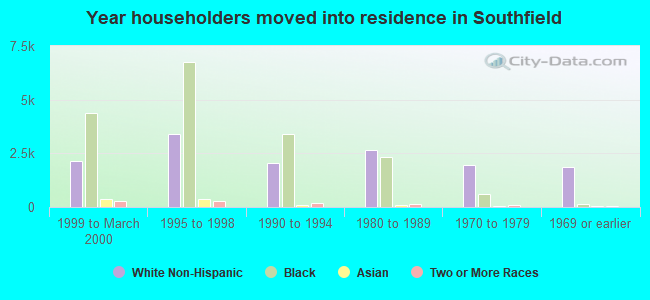
Year householder moved into unit - Moved in 1999 to March 2000 (%)
Year householder moved into unit - Moved in 1999 to March 2000 (%) - White
Year householder moved into unit - Moved in 1999 to March 2000 (%) - Black or African American
Year householder moved into unit - Moved in 1999 to March 2000 (%) - Asian
Year householder moved into unit - Moved in 1999 to March 2000 (%) - Hispanic or Latino
Year householder moved into unit - Moved in 1999 to March 2000 (%) - American Indian and Alaska Native
Year householder moved into unit - Moved in 1999 to March 2000 (%) - Multirace
Year householder moved into unit - Moved in 1999 to March 2000 (%) - Other Race
Year householder moved into unit - Moved in 1995 to 1998 (%)
Year householder moved into unit - Moved in 1995 to 1998 (%) - White
Year householder moved into unit - Moved in 1995 to 1998 (%) - Black or African American
Year householder moved into unit - Moved in 1995 to 1998 (%) - Asian
Year householder moved into unit - Moved in 1995 to 1998 (%) - Hispanic or Latino
Year householder moved into unit - Moved in 1995 to 1998 (%) - American Indian and Alaska Native
Year householder moved into unit - Moved in 1995 to 1998 (%) - Multirace
Year householder moved into unit - Moved in 1995 to 1998 (%) - Other Race
Year householder moved into unit - Moved in 1990 to 1994 (%)
Year householder moved into unit - Moved in 1990 to 1994 (%) - White
Year householder moved into unit - Moved in 1990 to 1994 (%) - Black or African American
Year householder moved into unit - Moved in 1990 to 1994 (%) - Asian
Year householder moved into unit - Moved in 1990 to 1994 (%) - Hispanic or Latino
Year householder moved into unit - Moved in 1990 to 1994 (%) - American Indian and Alaska Native
Year householder moved into unit - Moved in 1990 to 1994 (%) - Multirace
Year householder moved into unit - Moved in 1990 to 1994 (%) - Other Race
Year householder moved into unit - Moved in 1980 to 1989 (%)
Year householder moved into unit - Moved in 1980 to 1989 (%) - White
Year householder moved into unit - Moved in 1980 to 1989 (%) - Black or African American
Year householder moved into unit - Moved in 1980 to 1989 (%) - Asian
Year householder moved into unit - Moved in 1980 to 1989 (%) - Hispanic or Latino
Year householder moved into unit - Moved in 1980 to 1989 (%) - American Indian and Alaska Native
Year householder moved into unit - Moved in 1980 to 1989 (%) - Multirace
Year householder moved into unit - Moved in 1980 to 1989 (%) - Other Race
Year householder moved into unit - Moved in 1970 to 1979 (%)
Year householder moved into unit - Moved in 1970 to 1979 (%) - White
Year householder moved into unit - Moved in 1970 to 1979 (%) - Black or African American
Year householder moved into unit - Moved in 1970 to 1979 (%) - Asian
Year householder moved into unit - Moved in 1970 to 1979 (%) - Hispanic or Latino
Year householder moved into unit - Moved in 1970 to 1979 (%) - American Indian and Alaska Native
Year householder moved into unit - Moved in 1970 to 1979 (%) - Multirace
Year householder moved into unit - Moved in 1970 to 1979 (%) - Other Race
Year householder moved into unit - Moved in 1969 or earlier (%)
Year householder moved into unit - Moved in 1969 or earlier (%) - White
Year householder moved into unit - Moved in 1969 or earlier (%) - Black or African American
Year householder moved into unit - Moved in 1969 or earlier (%) - Asian
Year householder moved into unit - Moved in 1969 or earlier (%) - Hispanic or Latino
Year householder moved into unit - Moved in 1969 or earlier (%) - American Indian and Alaska Native
Year householder moved into unit - Moved in 1969 or earlier (%) - Multirace
Year householder moved into unit - Moved in 1969 or earlier (%) - Other Race
Housing units lacking complete plumbing facilities (%)
Housing units lacking complete kitchen facilities (%)
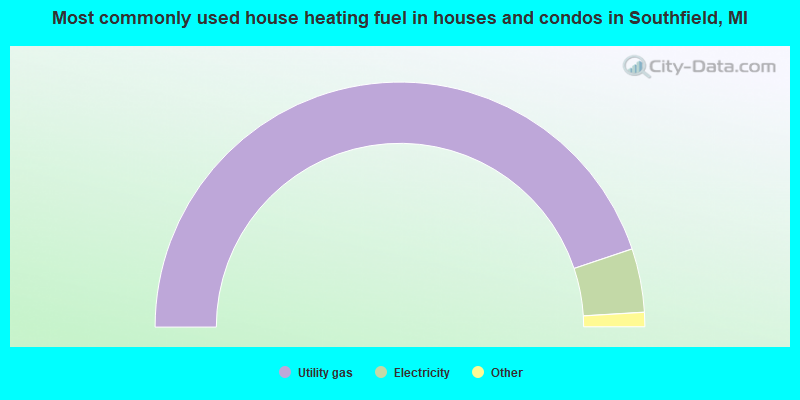
House heating fuel used in houses and condos - Utility gas (%)
House heating fuel used in houses and condos - Bottled, tank, or LP gas (%)
House heating fuel used in houses and condos - Electricity (%)
House heating fuel used in houses and condos - Fuel oil, kerosene, etc. (%)
House heating fuel used in houses and condos - Coal or coke (%)
House heating fuel used in houses and condos - Wood (%)
House heating fuel used in houses and condos - Solar energy (%)
House heating fuel used in houses and condos - Other fuel (%)
House heating fuel used in houses and condos - No fuel used (%)
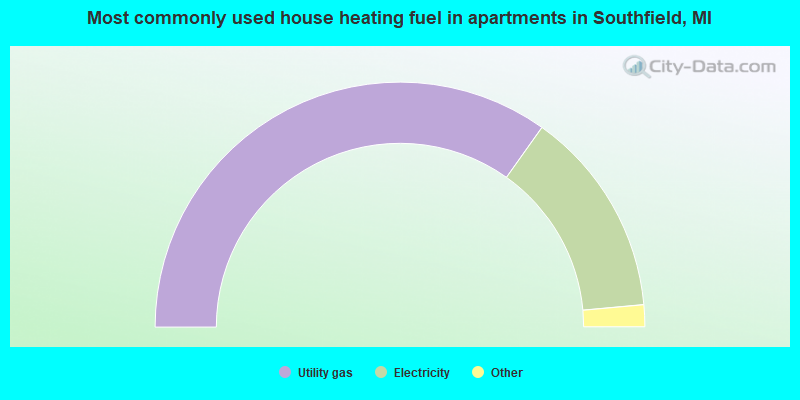
House heating fuel used in apartments - Utility gas (%)
House heating fuel used in apartments - Bottled, tank, or LP gas (%)
House heating fuel used in apartments - Electricity (%)
House heating fuel used in apartments - Fuel oil, kerosene, etc. (%)
House heating fuel used in apartments - Coal or coke (%)
House heating fuel used in apartments - Wood (%)
House heating fuel used in apartments - Solar energy (%)
House heating fuel used in apartments - Other fuel (%)
House heating fuel used in apartments - No fuel used (%)
Latest news about housing in Southfield, MI collected exclusively by city-data.com from local newspapers, TV, and radio stations
Median year house/condo built: 1965Median year apartment built: 1976Household type by relationship:
Households: 75,454
Male householders: 14,299 (6,444 living alone ), Female householders: 20,992 (9,700 living alone )10,822 spouses (10,524 opposite-sex spouses ), 1,961 unmarried partners , (1,882 opposite-sex unmarried partners ), 20,991 children (19,777 natural , 331 adopted , 883 stepchildren ), 1,777 grandchildren , 946 brothers or sisters , 585 parents , 0 foster children , 656 other relatives , 748 non-relatives In group quarters: 1,677
Size of family households: 8,689 2-persons , 4,724 3-persons , 2,379 4-persons , 1,154 5-persons , 589 6-persons , 191 7-or-more-persons .
Size of nonfamily households: 16,144 1-person , 1,421 2-persons .
7,016 married couples with children. single-parent households (252 men , 5,573 women ).
90.1% of residents of Southfield speak English at home. of residents speak Spanish at home (59% speak English very well , 14% speak English well , 27% speak English not well ).of residents speak other Indo-European language at home (67% speak English very well , 17% speak English well , 10% speak English not well , 6% don't speak English at all ).of residents speak Asian or Pacific Island language at home (77% speak English very well , 19% speak English well , 3% speak English not well , 1% don't speak English at all ).of residents speak other language at home (71% speak English very well , 15% speak English well , 8% speak English not well , 6% don't speak English at all ).
Foreign born population: 5,069 (6.7%)of them are naturalized citizens )
Median number of rooms in houses and condos:
Median number of rooms in apartments
Owner-occupied Renter-occupied
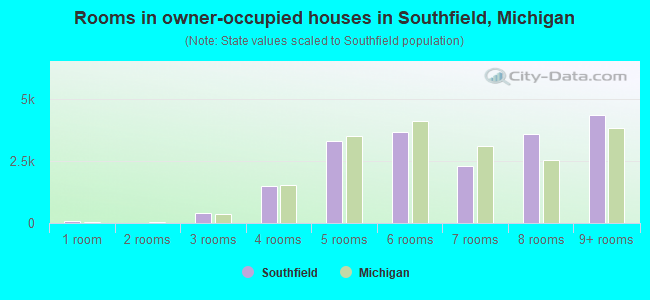
Rooms in owner-occupied houses in Southfield, Michigan
84 1 room 0 2 rooms 388 3 rooms 1,480 4 rooms 3,307 5 rooms 3,663 6 rooms 2,284 7 rooms 3,574 8 rooms 4,355 9+ rooms
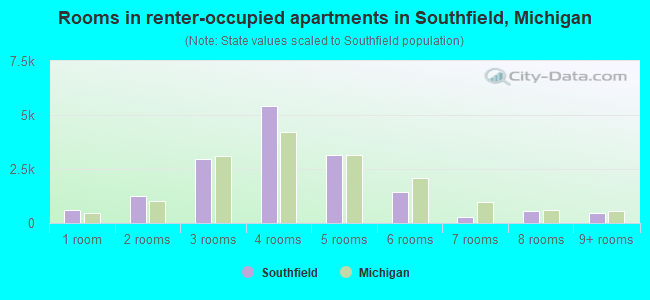
Rooms in renter-occupied apartments in Southfield, Michigan
581 1 room 1,264 2 rooms 2,961 3 rooms 5,438 4 rooms 3,150 5 rooms 1,436 6 rooms 295 7 rooms 566 8 rooms 465 9+ rooms
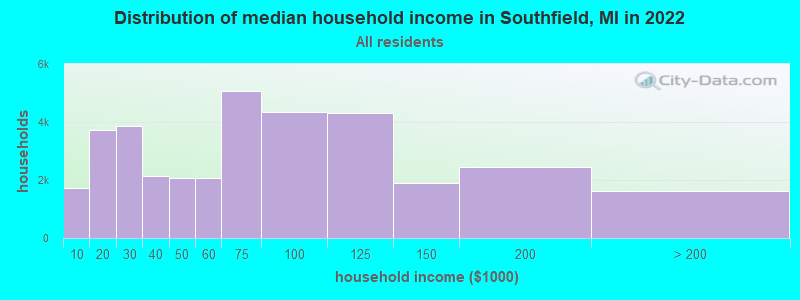
Southfield, MI household income distribution 1,735 Less than $10,0003,735 $10,000 to $19,9993,857 $20,000 to $29,9992,128 $30,000 to $39,9992,058 $40,000 to $49,9992,073 $50,000 to $59,9995,066 $60,000 to $74,9994,348 $75,000 to $99,9994,319 $100,000 to $124,9991,896 $125,000 to $149,9992,454 $150,000 to $199,9991,622 $200,000 or more
Home value of owner - occupied houses in 2022 in Southfield, MI 103 Less than $10,00038 $10,000 to $14,99946 $15,000 to $19,99952 $20,000 to $24,99960 $25,000 to $29,99956 $30,000 to $34,99911 $35,000 to $39,99937 $40,000 to $49,999223 $50,000 to $59,999226 $60,000 to $69,999126 $70,000 to $79,999250 $80,000 to $89,999221 $90,000 to $99,9991,305 $100,000 to $124,999894 $125,000 to $149,9991,671 $150,000 to $174,9991,241 $175,000 to $199,9993,193 $200,000 to $249,9993,239 $250,000 to $299,9992,252 $300,000 to $399,999736 $400,000 to $499,99976 $500,000 to $749,99953 $750,000 to $999,99927 $1,000,000 to $1,499,99942 $2,000,000 or moreRent paid by renters in 2022 in Southfield, MI 20 Less than $10035 $100 to $149510 $200 to $24983 $250 to $29928 $300 to $34951 $350 to $39917 $400 to $44937 $450 to $49976 $500 to $549155 $550 to $59980 $600 to $64941 $650 to $699285 $700 to $749575 $750 to $7991,314 $800 to $8992,334 $900 to $9995,203 $1,000 to $1,2492,591 $1,250 to $1,4991,787 $1,500 to $1,999553 $2,000 to $2,49966 $2,500 to $2,999612 No cash rent
Percentage of workers working in this county: 63.8%Number of people working at home: 6,515 (18.1% of all workers )
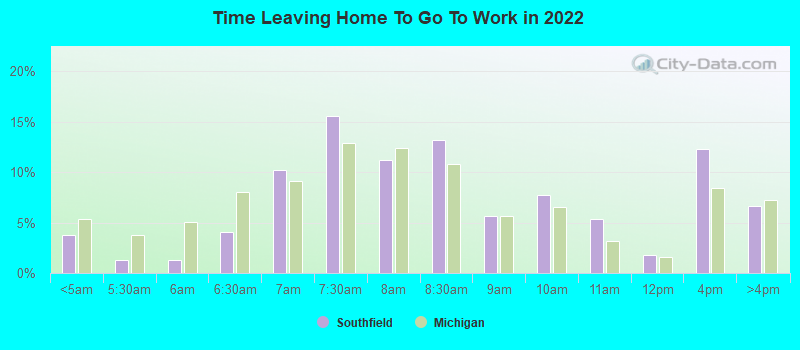
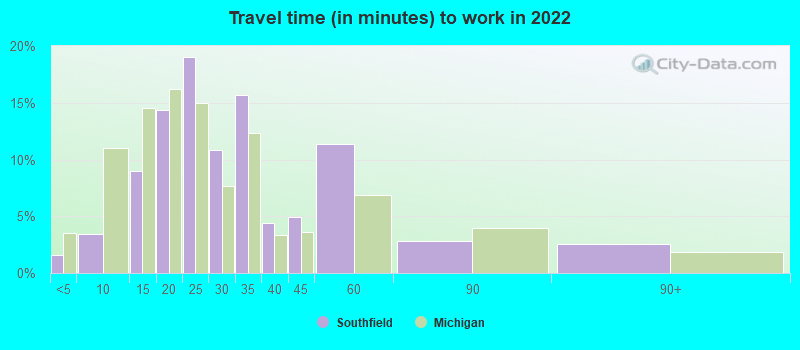
Travel time to work (commute)
Less than 5 minutes: 5675 to 9 minutes: 2,07510 to 14 minutes: 4,23815 to 19 minutes: 4,85320 to 24 minutes: 4,72125 to 29 minutes: 3,88030 to 34 minutes: 6,16435 to 39 minutes: 60340 to 44 minutes: 67745 to 59 minutes: 1,40460 to 89 minutes: 22790 or more minutes: 977
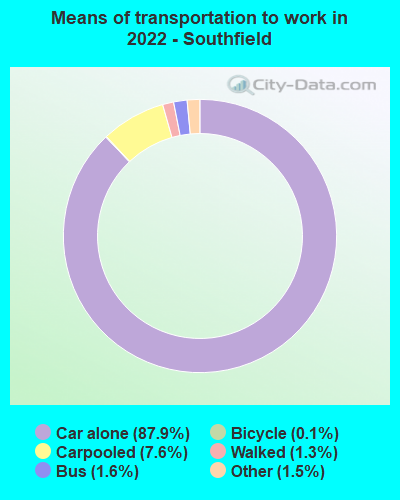
Means of transportation to work:
Drove a car alone: 51,762 (76.6%)Carpooled: 4,304 (6.4%)Bus : 563 (0.8%)Long-distance train or commuter rail : 2 (0.0%)Taxi: 1,141 (1.7%)Bicycle: 136 (0.2%)Walked: 878 (1.3%)Worked at home: 6,515 (9.6%)
Unemployment by race in 2022
Unemployment rate for White non-Hispanic residents 9.0% FemalesUnemployment rate for Black residents 7.4% Males3.4% FemalesUnemployment rate for American Indian and Alaska Native residents 6.7% MalesUnemployment rate for Asian residents 0.7% MalesUnemployment rate for other race residents 1.9% MalesUnemployment rate for two or more race residents 14.1% Males0.7% FemalesUnemployment rate for Hispanic or Latino residents 0.4% Males1.5% Females
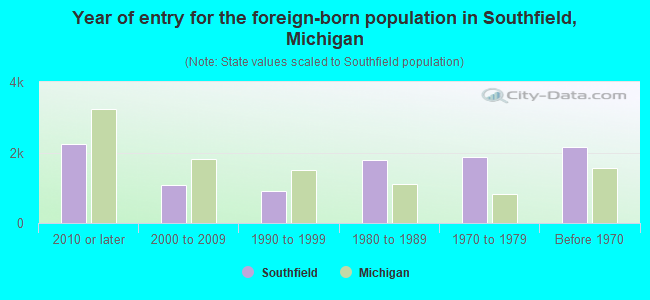
Year of entry for the foreign-born population in Southfield, Michigan
2,240 2010 or later 1,086 2000 to 2009 907 1990 to 1999 1,794 1980 to 1989 1,866 1970 to 1979 2,165 Before 1970
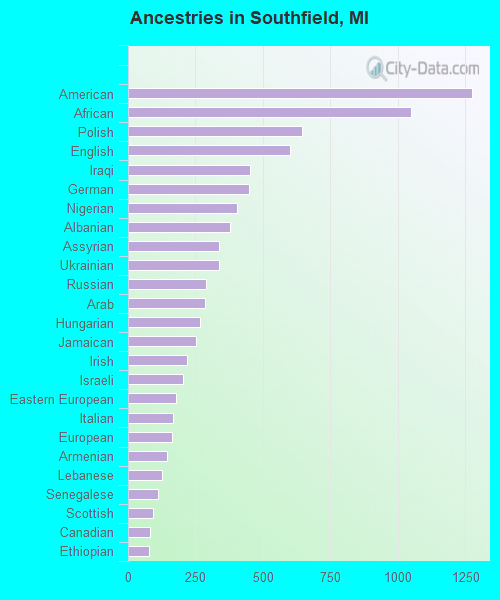
First ancestries reported:
American: 1,274 (2.7%)
African: 1,048 (2.2%)
Polish: 644 (1.4%)
English: 601 (1.3%)
Iraqi: 452 (1.0%)
German: 449 (1.0%)
Nigerian: 405 (0.9%)
Albanian: 379 (0.8%)
Assyrian: 336 (0.7%)
Ukrainian: 336 (0.7%)
Russian: 289 (0.6%)
Arab: 287 (0.6%)
Hungarian: 268 (0.6%)
Jamaican: 251 (0.5%)
Irish: 220 (0.5%)
Israeli: 204 (0.4%)
Eastern European: 178 (0.4%)
Italian: 168 (0.4%)
European: 163 (0.3%)
Armenian: 145 (0.3%)
Lebanese: 127 (0.3%)
Senegalese: 110 (0.2%)
Scottish: 94 (0.2%)
Canadian: 83 (0.2%)
Ethiopian: 78 (0.2%)
Dutch: 63 (0.1%)
Estonian: 60 (0.1%)
Danish: 59 (0.1%)
Haitian: 58 (0.1%)
Palestinian: 57 (0.1%)
British: 54 (0.1%)
French: 50 (0.1%)
Macedonian: 40 (0.09%)
French Canadian: 34 (0.07%)
Welsh: 34 (0.07%)
South African: 33 (0.07%)
Syrian: 28 (0.06%)
Scotch-Irish: 28 (0.06%)
Lithuanian: 27 (0.06%)
Norwegian: 22 (0.05%)
Finnish: 22 (0.05%)
Carpatho Rusyn: 22 (0.05%)
Belgian: 19 (0.04%)
Romanian: 17 (0.04%)
Portuguese: 16 (0.03%)
Bulgarian: 15 (0.03%)
Slovak: 14 (0.03%)
Barbadian: 11 (0.02%)
Austrian: 9 (0.02%)
Slovene: 8 (0.02%)
Scandinavian: 8 (0.02%)
Moroccan: 8 (0.02%)
Czech: 5 (0.01%)
Czechoslovakian: 5 (0.01%)
Trinidadian and Tobagonian: 4 (0.01%)
Latvian: 3 (0.01%)
Most common places of birth for foreign-born residents (%): Iraq Southfield:
14.0% (820)Michigan:
8.1% (55,954)
India Southfield:
14.0% (818)Michigan:
11.1% (77,240)
Nigeria Southfield:
6.7% (394)Michigan:
0.9% (5,964)
Canada Southfield:
6.7% (392)Michigan:
5.0% (35,052)
Ukraine Southfield:
4.6% (271)Michigan:
1.0% (6,829)
Jamaica Southfield:
4.4% (260)Michigan:
0.7% (4,645)
Philippines Southfield:
4.0% (235)Michigan:
2.8% (19,112)
Ghana Southfield:
4.0% (234)Michigan:
0.3% (1,811)
Other Eastern Europe Southfield:
3.8% (222)Michigan:
1.0% (6,730)
Georgia Southfield:
3.7% (216)Michigan:
0.1% (383)
Russia Southfield:
3.0% (177)Michigan:
0.9% (6,326)
Mexico Southfield:
2.2% (129)Michigan:
10.9% (75,965)
Armenia Southfield:
2.2% (127)Michigan:
0.1% (517)
China, excluding Hong Kong and Taiwan Southfield:
2.1% (125)Michigan:
4.9% (34,295)
Senegal Southfield:
1.8% (107)Michigan:
0.1% (757)
Venezuela Southfield:
1.8% (103)Michigan:
0.3% (1,871)
Place of birth for U.S.-born residents:
This state: 53,321Other state: 16,331Northeast: 2,682Midwest: 3,427South: 9,530West: 692 89.1% of Southfield residents lived in the same house 1 years ago.
Out of people who lived in different houses, 34.6% lived in this county.
Out of people who lived in different counties, 86.0% lived in Michigan.
Southfield:
89.1%State average:
88.4%
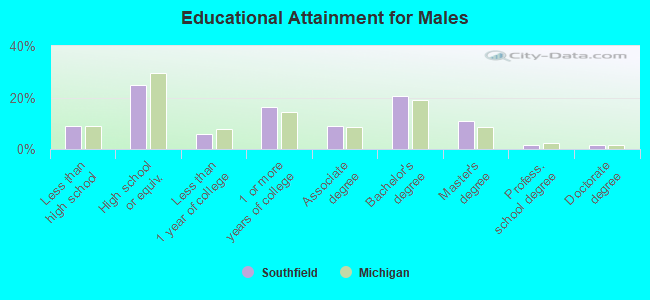
Education attainment for males 25 years and older:
No schooling: 965Nursery to 4th grade: 05th and 6th grade: 07th and 8th grade: 2409th grade: 11410th grade: 40011th grade: 012th grade, no diploma: 527High school graduate (or equivalency): 6,113Less than 1 year of college: 1,478Some college more than 1 year, no degree: 4,062Associate degree: 2,239Bachelor's degree: 5,105Master's degree: 2,705Professional school degree: 405Doctorate degree: 337
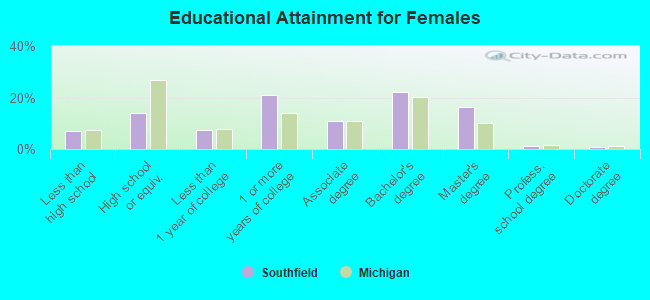
Education attainment for females 25 years and older:
No schooling: 971Nursery to 4th grade: 525th and 6th grade: 07th and 8th grade: 259th grade: 7010th grade: 35411th grade: 012th grade, no diploma: 538High school graduate (or equivalency): 4,149Less than 1 year of college: 2,122Some college more than 1 year, no degree: 6,206Associate degree: 3,206Bachelor's degree: 6,494Master's degree: 4,832Professional school degree: 288Doctorate degree: 183
Housing units in structures:
One, detached: 18,584One, attached: 2,761Two: 1093 or 4: 2,1835 to 9: 4,35910 to 19: 1,87520 to 49: 2,10250 or more: 7,577Housing units lacking complete plumbing facilities in 2022: 1.1%Housing units lacking complete kitchen facilities in 2022: 2.3%House/condo owner moved in on average 11 years ago
Renter moved in on average 3 years ago
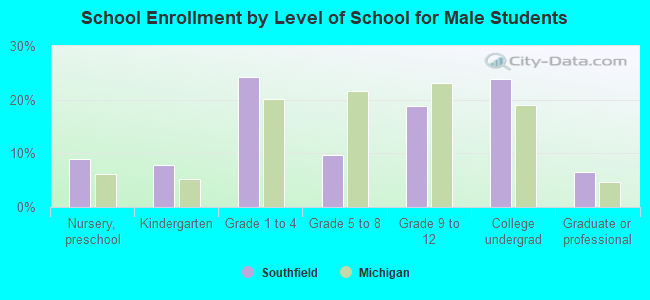
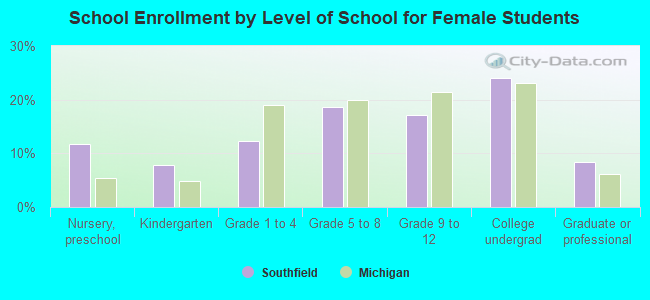
Private vs. public school enrollment:
Students in private schools in grades 1 to 8 (elementary and middle school): 1,052 Students in private schools in grades 9 to 12 (high school): 243 Students in private undergraduate colleges: 1,320