Spillertown, IL (Illinois) Houses and Residents
| Spillertown: | $131,529 |
| Illinois: | $251,600 |
Mean price in 2022:
Detached houses: $140,343
Here: $140,343 State: $310,164 Mobile homes: $245,030
Here: $245,030 State: $78,855
Total population: 202 (All urban)
Houses: 181 (145 occupied: 124 owner occupied, 22 renter occupied)
| % of renters here: | 15% |
| State: | 33% |
Housing density: 582 houses/condos per square mile
Median price asked for vacant for-sale houses and condos in 2022 in this county: $118,112.
Median contract rent in 2022: $707 (lower quartile is $480, upper quartile is $1,518)
Median rent asked for vacant for-rent units in 2022: $530
Median gross rent in Spillertown, IL in 2022: $1,031
Housing units in Spillertown with a mortgage: 79 (0 second mortgage, 0 home equity loan, 0 both second mortgage and home equity loan)
Houses without a mortgage: 0
Median household income for houses/condos with a mortgage: $76,482
Median household income for apartments without a mortgage: $69,313
Median monthly housing costs: $799
Compare current foreclosures near Spillertown, IL:
| Photo | Address | Area | Beds / Baths | Price | Details |
|---|---|---|---|---|---|

|
#1
S Midway St
Herrin, IL 62948
|
1,772 sq. feet
|
2 baths 3 beds |
$174,900
|
show details |

|
#2
S Gardner St
West Frankfort, IL 62896
|
1,196 sq. feet
|
1 baths 3 beds |
$105,000
|
show details |

|
#3
E Grand Ave
Carbondale, IL 62902
|
1,550 sq. feet
|
1 baths 3 beds |
$164,900
|
show details |

|
#4
S Virginia Ave
Marion, IL 62959
|
1,320 sq. feet
|
1 baths 3 beds |
show details | |

|
#5
N Pierce St
Carbondale, IL 62901
|
996 sq. feet
|
1 baths 3 beds |
show details | |

|
#6
Napolean Rd
Marion, IL 62959
|
920 sq. feet
|
2 baths 3 beds |
show details | |

|
#7
N Manering St
Royalton, IL 62983
|
- sq. feet
|
1 baths 3 beds |
show details | |

|
#8
E Creekwood Dr
Carbondale, IL 62902
|
1,588 sq. feet
|
3 baths 3 beds |
show details | |

|
#9
E Saint Louis St
West Frankfort, IL 62896
|
1,705 sq. feet
|
2 baths 4 beds |
show details | |

|
#10
N Division St
Carterville, IL 62918
|
- sq. feet
|
- baths - beds |
$14,900
|
show details |
| Photo | Address | Area | Beds / Baths | Price | Details |
|---|---|---|---|---|---|

|
#11
Court H
Herrin, IL 62948
|
1,024 sq. feet
|
1 baths 3 beds |
show details | |

|
#12
N Division St
Carterville, IL 62918
|
1,442 sq. feet
|
1 baths 3 beds |
show details | |

|
#13
W Rigdon St
Carbondale, IL 62901
|
1,215 sq. feet
|
2 baths 3 beds |
show details | |

|
#14
E 7th St
West Frankfort, IL 62896
|
- sq. feet
|
2 baths 3 beds |
show details | |

|
#15
N Emma St
Christopher, IL 62822
|
- sq. feet
|
- baths - beds |
$19,900
|
show details |

|
#16
N Buchanan St
Benton, IL 62812
|
2,304 sq. feet
|
2 baths 3 beds |
show details | |

|
#17
W Tyler St
Herrin, IL 62948
|
1,120 sq. feet
|
1 baths 2 beds |
show details | |

|
#18
Joplin St
Benton, IL 62812
|
1 sq. feet
|
1 baths 3 beds |
show details | |

|
#19
Roberts Rd
Marion, IL 62959
|
- sq. feet
|
2 baths 3 beds |
show details | |

|
#20
N Adams St
West Frankfort, IL 62896
|
- sq. feet
|
- baths - beds |
$3,400
|
show details |
| Photo | Address | Area | Beds / Baths | Price | Details |
|---|---|---|---|---|---|

|
#21
N Horn St
West Frankfort, IL 62896
|
- sq. feet
|
- baths - beds |
$19,900
|
show details |

|
#22
W Ray Ave
Christopher, IL 62822
|
- sq. feet
|
1 baths 2 beds |
show details | |

|
#23
Fawn Dr
Marion, IL 62959
|
1,671 sq. feet
|
- baths - beds |
show details | |

|
#24
State Highway 149
West Frankfort, IL 62896
|
- sq. feet
|
- baths - beds |
show details | |

|
#25
S Pine Tree Dr
Carterville, IL 62918
|
- sq. feet
|
- baths - beds |
show details | |

|
#26
Sycamore Rd
Carterville, IL 62918
|
- sq. feet
|
- baths - beds |
show details | |

|
#27
Whitecotton Dr
Carterville, IL 62918
|
- sq. feet
|
- baths - beds |
show details | |

|
#28
Taylor Ave
Carterville, IL 62918
|
- sq. feet
|
- baths - beds |
show details | |

|
#29
Strawberry Dr
West Frankfort, IL 62896
|
- sq. feet
|
- baths - beds |
show details | |

|
#30
Scout Cabin Rd
Carterville, IL 62918
|
- sq. feet
|
- baths - beds |
show details |
| Photo | Address | Area | Beds / Baths | Price | Details |
|---|---|---|---|---|---|

|
#31
E Main St Apt 710
West Frankfort, IL 62896
|
- sq. feet
|
- baths - beds |
show details | |

|
#32
Cottonwood Ln
Carterville, IL 62918
|
- sq. feet
|
- baths - beds |
show details | |

|
#33
W Saint Louis St # 218
West Frankfort, IL 62896
|
- sq. feet
|
- baths - beds |
show details | |

|
#34
N Emma St # 2
West Frankfort, IL 62896
|
- sq. feet
|
- baths - beds |
show details | |

|
#35
Zachary Dr
Marion, IL 62959
|
- sq. feet
|
- baths - beds |
show details | |

|
#36
S Division St
Carterville, IL 62918
|
- sq. feet
|
- baths - beds |
show details | |

|
#37
Charles Ave
Carterville, IL 62918
|
- sq. feet
|
- baths - beds |
show details | |

|
#38
N 19th St
Herrin, IL 62948
|
- sq. feet
|
- baths - beds |
show details | |

|
#39
N 17th St
Hurst, IL 62949
|
- sq. feet
|
- baths - beds |
show details | |

|
#40
Paulton Rd
Pittsburg, IL 62974
|
- sq. feet
|
- baths - beds |
show details |
| Photo | Address | Area | Beds / Baths | Price | Details |
|---|---|---|---|---|---|

|
#41
Pierce Sq
Herrin, IL 62948
|
- sq. feet
|
- baths - beds |
show details | |

|
#42
Rae Ln
Carterville, IL 62918
|
- sq. feet
|
- baths - beds |
show details | |

|
#43
Marion St
Carterville, IL 62918
|
- sq. feet
|
- baths - beds |
show details | |

|
#44
W Cherry St
Herrin, IL 62948
|
- sq. feet
|
- baths - beds |
show details | |

|
#45
Arctic Fox Dr
Carterville, IL 62918
|
- sq. feet
|
- baths - beds |
show details | |

|
#46
N 35th St
Herrin, IL 62948
|
- sq. feet
|
- baths - beds |
show details | |

|
#47
S Pennsylvania Ave
Carterville, IL 62918
|
- sq. feet
|
- baths - beds |
show details | |

|
#48
Rock Creek Rd
Pittsburg, IL 62974
|
- sq. feet
|
- baths - beds |
show details | |

|
#49
Gass St
West Frankfort, IL 62896
|
- sq. feet
|
- baths - beds |
show details | |

|
Check over 1 million property listings on Foreclosure.com!
|
browse all offers | |||

Latest news about housing in Spillertown, IL collected exclusively by city-data.com from local newspapers, TV, and radio stations


Median year apartment built: 1950
Household type by relationship:
Households: 313- Male householders: 35 (8 living alone), Female householders: 107 (45 living alone)
57 spouses (57 opposite-sex spouses), 10 unmarried partners, (10 opposite-sex unmarried partners), 94 children (91 natural, 0 adopted, 2 stepchildren), 5 grandchildren, 0 brothers or sisters, 0 parents, 0 foster children, 0 other relatives, 0 non-relatives
Size of family households: 45 2-persons, 12 3-persons, 5 4-persons, 18 5-persons.
Size of nonfamily households: 57 1-person, 7 2-persons.
73 married couples with children.
11 single-parent households (6 men, 5 women).
90.8% of residents of Spillertown speak English at home.
7.8% of residents speak Spanish at home (100% speak English very well).
0.7% of residents speak other Indo-European language at home (50% speak English very well, 50% speak English well).
Foreign born population: 34 (10.9%)
(50.0% of them are naturalized citizens)
| Here: | 5.6 |
| State: | 6.4 |
| Here: | 6.9 |
| State: | 4.1 |

- Bedrooms in owner-occupied houses and condos in Spillertown, Illinois
- 0no bedroom
- 31 bedroom
- 332 bedrooms
- 813 bedrooms
- 84 bedrooms
- 05+ bedrooms

- Bedrooms in renter-occupied apartments in Spillertown, Illinois
- 0no bedroom
- 71 bedroom
- 72 bedrooms
- 83 bedrooms
- 04 bedrooms
- 05+ bedrooms

- Cars and other vehicles available in Spillertown in owner-occupied houses/condos
- 2no vehicle
- 581 vehicle
- 492 vehicles
- 103 vehicles
- 54 vehicles
- 05+ vehicles

- Cars and other vehicles available in Spillertown in renter-occupied apartments
- 8no vehicle
- 101 vehicle
- 32 vehicles
- 13 vehicles
- 04 vehicles
- 05+ vehicles

- Rooms in owner-occupied houses in Spillertown, Illinois
- 01 room
- 02 rooms
- 33 rooms
- 254 rooms
- 395 rooms
- 276 rooms
- 267 rooms
- 18 rooms
- 59+ rooms

- Rooms in renter-occupied apartments in Spillertown, Illinois
- 01 room
- 42 rooms
- 33 rooms
- 14 rooms
- 05 rooms
- 26 rooms
- 127 rooms
- 08 rooms
- 09+ rooms


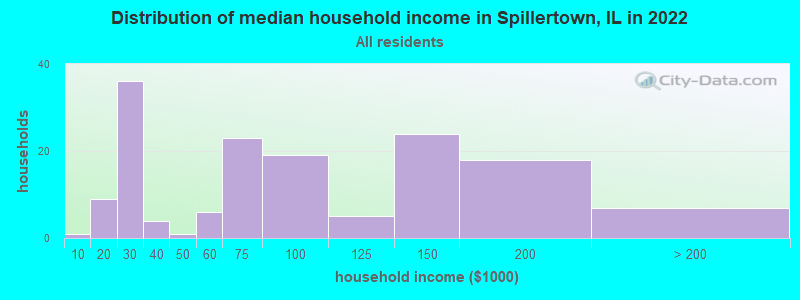
Spillertown, IL household income distribution

- 1Less than $10,000
- 9$10,000 to $19,999
- 36$20,000 to $29,999
- 4$30,000 to $39,999
- 1$40,000 to $49,999
- 6$50,000 to $59,999
- 23$60,000 to $74,999
- 19$75,000 to $99,999
- 5$100,000 to $124,999
- 24$125,000 to $149,999
- 18$150,000 to $199,999
- 7$200,000 or more
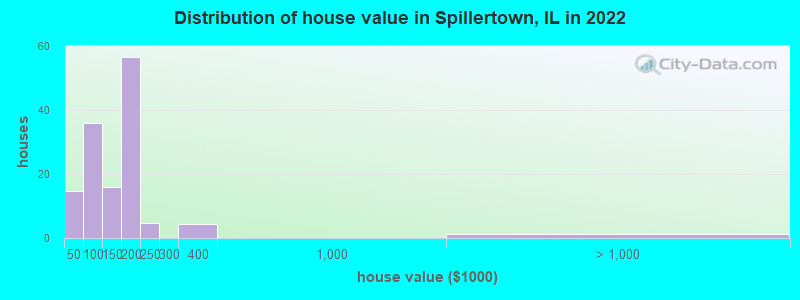
Home value of owner - occupied houses in 2022 in Spillertown, IL
-
- 2$25,000 to $29,999
- 7$30,000 to $34,999
- 5$40,000 to $49,999
- 19$50,000 to $59,999
- 6$70,000 to $79,999
- 1$80,000 to $89,999
- 2$90,000 to $99,999
- 14$100,000 to $124,999
- 1$125,000 to $149,999
- 50$150,000 to $174,999
- 6$175,000 to $199,999
- 4$200,000 to $249,999
- 4$300,000 to $399,999
- 1$2,000,000 or more
Rent paid by renters in 2022 in Spillertown, IL
-
- 4$400 to $449
- 1$450 to $499
- 3$550 to $599
- 7$750 to $799
- 6$1,500 to $1,999

Percentage of workers working in this county: 89.7%
Number of people working at home: 41 (27.5% of all workers)
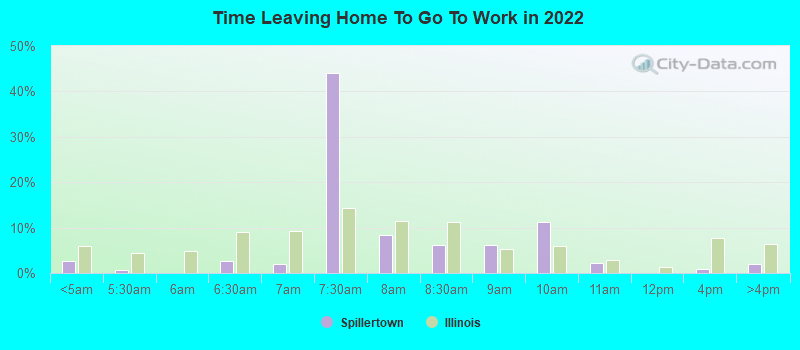
Travel time to work (commute)
- Less than 5 minutes: 0
- 5 to 9 minutes: 7
- 10 to 14 minutes: 37
- 15 to 19 minutes: 38
- 20 to 24 minutes: 11
- 25 to 29 minutes: 8
- 30 to 34 minutes: 9
- 35 to 39 minutes: 2
- 40 to 44 minutes: 0
- 45 to 59 minutes: 4
- 60 to 89 minutes: 3
- 90 or more minutes: 0
Means of transportation to work:
- Drove a car alone: 91 (91.0%)
- Other means: 7 (7.0%)
- Worked at home: 2 (2.0%)
- Unemployment by race in 2022
- Unemployment rate for White non-Hispanic residents
- 4.3%Males
- 5.9%Females

- Year of entry for the foreign-born population in Spillertown, Illinois
- 12010 or later
- 82000 to 2009
- 01990 to 1999
- 21980 to 1989
- 01970 to 1979
- 0Before 1970
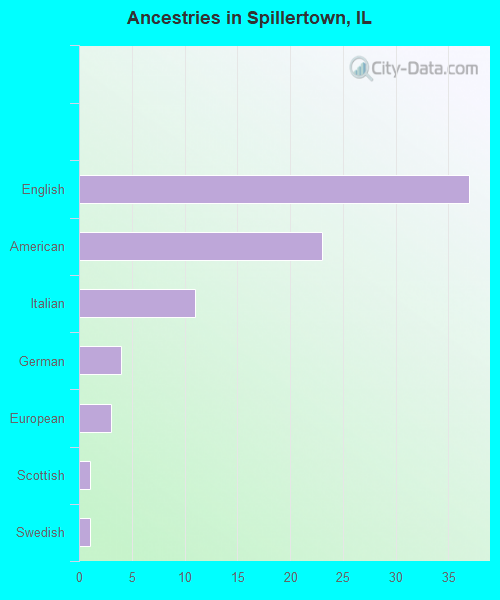
First ancestries reported:
- English: 37 (24.1%)
- American: 23 (15.0%)
- Italian: 11 (7.2%)
- German: 4 (2.6%)
- European: 3 (2.0%)
- Scottish: 1 (0.7%)
- Swedish: 1 (0.7%)
Most common places of birth for foreign-born residents (%):
| Spillertown: | 54.3% (19) |
| Illinois: | 5.2% (93,003) |
| Spillertown: | 31.4% (11) |
| Illinois: | 0.6% (10,762) |
| Spillertown: | 8.6% (3) |
| Illinois: | 0.1% (1,305) |
Place of birth for U.S.-born residents:
- This state: 187
- Other state: 96
- Northeast: 0
- Midwest: 56
- South: 27
- West: 6
74.1% of Spillertown residents lived in the same house 1 years ago.
Out of people who lived in different houses, 11.9% lived in this county.
Out of people who lived in different counties, 15.3% lived in Illinois.
| Spillertown: | 74.1% |
| State average: | 88.3% |
Education attainment for males 25 years and older:
- No schooling: 0
- Nursery to 4th grade: 9
- 5th and 6th grade: 0
- 7th and 8th grade: 1
- 9th grade: 0
- 10th grade: 2
- 11th grade: 0
- 12th grade, no diploma: 0
- High school graduate (or equivalency): 15
- Less than 1 year of college: 10
- Some college more than 1 year, no degree: 19
- Associate degree: 17
- Bachelor's degree: 8
- Master's degree: 3
- Professional school degree: 0
- Doctorate degree: 0

Education attainment for females 25 years and older:
- No schooling: 0
- Nursery to 4th grade: 2
- 5th and 6th grade: 0
- 7th and 8th grade: 4
- 9th grade: 0
- 10th grade: 0
- 11th grade: 1
- 12th grade, no diploma: 0
- High school graduate (or equivalency): 14
- Less than 1 year of college: 9
- Some college more than 1 year, no degree: 44
- Associate degree: 1
- Bachelor's degree: 14
- Master's degree: 10
- Professional school degree: 31
- Doctorate degree: 0


Housing units in structures:
- One, detached: 135
- One, attached: 7
- Two: 4
- 3 or 4: 3
- Mobile homes: 32
Median worth of mobile homes: $60,585
Housing units lacking complete kitchen facilities in 2022: 6.7%
House/condo owner moved in on average 8 years ago
Renter moved in on average 7 years ago

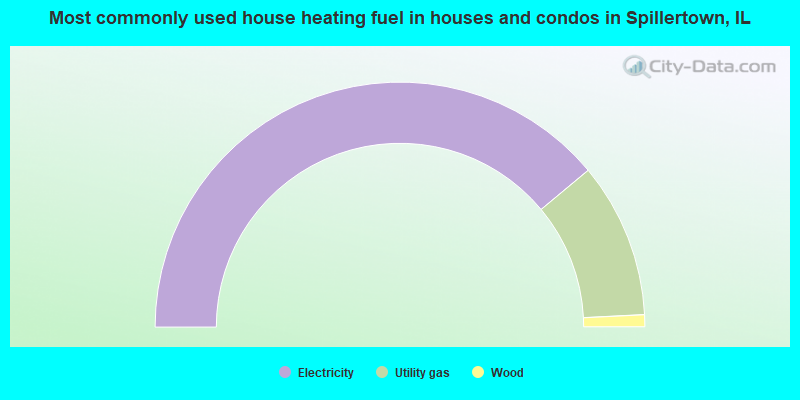
- 77.9%Electricity
- 20.5%Utility gas
- 1.6%Wood
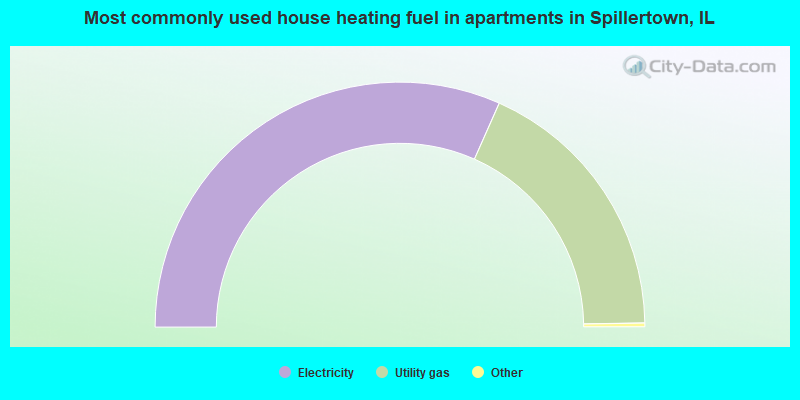
- 63.6%Electricity
- 36.4%Utility gas
Private vs. public school enrollment:
| Here: | 12.0% |
| Illinois: | 13.3% |
| Here: | 0.0% |
| Illinois: | 9.9% |
| Here: | 0.0% |
| Illinois: | 27.4% |


