Springfield, IL (Illinois) Houses and Residents
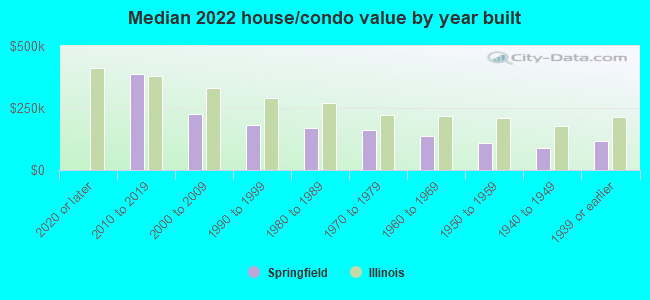
| Springfield: | $147,800 |
| Illinois: | $251,600 |
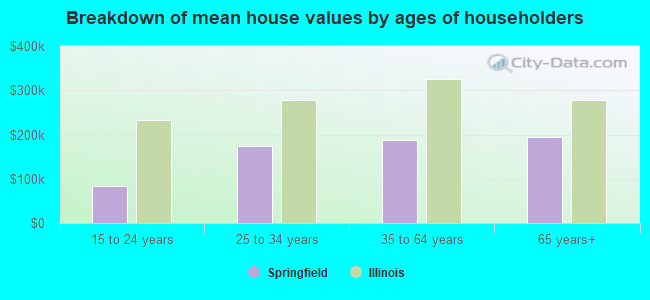
Mean price in 2022:
Detached houses: $196,766
Here: $196,766 State: $310,164 Townhouses or other attached units: $216,708
Here: $216,708 State: $286,230 In 2-unit structures: $114,756
Here: $114,756 State: $299,638 In 3-to-4-unit structures: $88,286
Here: $88,286 State: $330,907 In 5-or-more-unit structures: $131,164
Here: $131,164 State: $318,887 Mobile homes: $45,398
Here: $45,398 State: $78,855
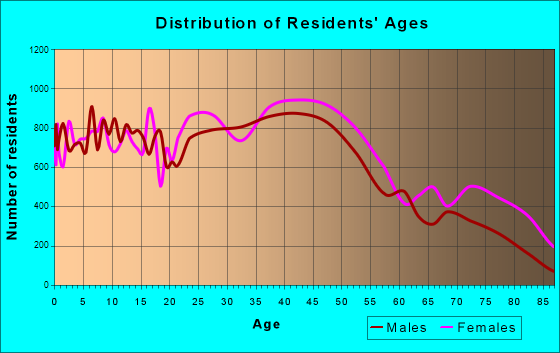
Total population: 116,809 (Urban population: 111,955, Rural population: 246 (32 farm, 214 nonfarm))
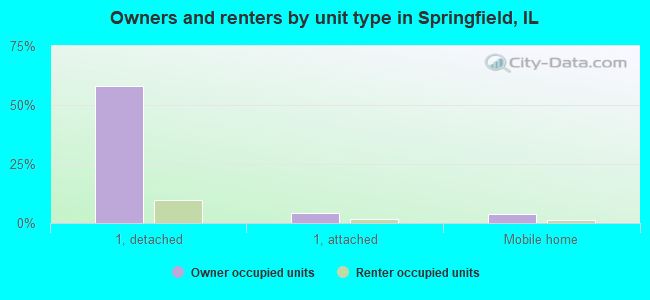
Houses: 58,310 (50,528 occupied: 34,129 owner occupied, 16,399 renter occupied)
| % of renters here: | 32% |
| State: | 33% |
Housing density: 1,080 houses/condos per square mile
Median price asked for vacant for-sale houses and condos in 2022: $209,019.
Median contract rent in 2022: $698 (lower quartile is $547, upper quartile is $887)
Median rent asked for vacant for-rent units in 2022: $1,747
Median gross rent in Springfield, IL in 2022: $849
Housing units in Springfield with a mortgage: 19,565 (1,554 second mortgage, 73 home equity loan, 1,028 both second mortgage and home equity loan)
Houses without a mortgage: 737
Median household income for houses/condos with a mortgage: $83,319
Median household income for apartments without a mortgage: $73,331
Median monthly housing costs: $896
Compare current foreclosures in Springfield, IL:
| Photo | Address | Area | Beds / Baths | Price | Details |
|---|---|---|---|---|---|

|
#1
W Monroe St
Springfield, IL 62704
|
910 sq. feet
|
1 baths 2 beds |
$63,000
|
show details |

|
#2
E Black Ave
Springfield, IL 62702
|
1,104 sq. feet
|
1 baths 3 beds |
show details | |

|
#3
S 16th St
Springfield, IL 62703
|
- sq. feet
|
- baths - beds |
$1,200
|
show details |

|
#4
N Wesley St
Springfield, IL 62702
|
1,756 sq. feet
|
2 baths 3 beds |
show details | |

|
#5
Walnut Valley Dr
Springfield, IL 62707
|
960 sq. feet
|
1 baths 3 beds |
show details | |

|
#6
Cronin Dr
Springfield, IL 62711
|
1,672 sq. feet
|
3 baths 2 beds |
show details | |

|
#7
Monica Ln
Springfield, IL 62702
|
1,100 sq. feet
|
1 baths 2 beds |
show details | |

|
#8
S 13th St
Springfield, IL 62703
|
610 sq. feet
|
1 baths 1 beds |
show details | |

|
#9
Dial Ct
Springfield, IL 62704
|
2,168 sq. feet
|
2 baths 3 beds |
show details | |

|
#10
N Patton Ave
Springfield, IL 62702
|
978 sq. feet
|
1 baths 3 beds |
show details |
| Photo | Address | Area | Beds / Baths | Price | Details |
|---|---|---|---|---|---|

|
#11
Leonard St
Springfield, IL 62704
|
1,801 sq. feet
|
2 baths 3 beds |
show details | |

|
#12
E Carpenter St
Springfield, IL 62702
|
- sq. feet
|
- baths - beds |
$5,300
|
show details |

|
#13
S Wesley St
Springfield, IL 62703
|
720 sq. feet
|
1 baths 2 beds |
show details | |

|
#14
S State St
Springfield, IL 62704
|
2,279 sq. feet
|
2 baths 4 beds |
show details | |

|
#15
W Edwards St
Springfield, IL 62704
|
- sq. feet
|
2 baths 4 beds |
show details | |

|
#16
Neptune Villa
Springfield, IL 62703
|
1,232 sq. feet
|
2 baths 3 beds |
show details | |

|
#17
N 3rd St
Springfield, IL 62702
|
- sq. feet
|
- baths - beds |
$21,900
|
show details |

|
#18
E Carpenter St
Springfield, IL 62702
|
- sq. feet
|
- baths - beds |
$25,900
|
show details |

|
#19
N Osburn Ave
Springfield, IL 62702
|
820 sq. feet
|
1 baths 2 beds |
show details | |

|
#20
N Wesley St
Springfield, IL 62702
|
1,134 sq. feet
|
2 baths 2 beds |
show details |
| Photo | Address | Area | Beds / Baths | Price | Details |
|---|---|---|---|---|---|

|
#21
S Renfro St
Springfield, IL 62703
|
- sq. feet
|
1 baths 3 beds |
show details | |

|
#22
E Hooker St
Springfield, IL 62703
|
- sq. feet
|
1 baths 3 beds |
show details | |

|
#23
N 20th St
Springfield, IL 62702
|
- sq. feet
|
1 baths 1 beds |
show details | |

|
#24
N 5th St Apt A
Springfield, IL 62702
|
- sq. feet
|
- baths - beds |
show details | |

|
#25
N Dirksen Pkwy Lot 241
Springfield, IL 62702
|
- sq. feet
|
- baths - beds |
show details | |

|
#26
E Adams St
Springfield, IL 62701
|
- sq. feet
|
- baths - beds |
show details | |

|
#27
S Grand Ave E
Springfield, IL 62703
|
- sq. feet
|
- baths - beds |
show details | |

|
#28
S 6th Street Rd
Springfield, IL 62703
|
- sq. feet
|
- baths - beds |
show details | |

|
#29
S 4th St
Springfield, IL 62701
|
- sq. feet
|
- baths - beds |
show details | |

|
#30
N Dirksen Pkwy Lot 60
Springfield, IL 62702
|
- sq. feet
|
- baths - beds |
show details |
| Photo | Address | Area | Beds / Baths | Price | Details |
|---|---|---|---|---|---|

|
#31
W Edwards St
Springfield, IL 62704
|
- sq. feet
|
- baths - beds |
show details | |

|
#32
W Edwards St
Springfield, IL 62704
|
- sq. feet
|
- baths - beds |
show details | |

|
#33
N Wolfe St
Springfield, IL 62702
|
- sq. feet
|
- baths - beds |
show details | |

|
#34
S Durkin Dr Apt 304
Springfield, IL 62704
|
- sq. feet
|
- baths - beds |
show details | |

|
#35
White City Blvd
Springfield, IL 62703
|
- sq. feet
|
- baths - beds |
show details | |

|
#36
S New St Apt 2
Springfield, IL 62704
|
- sq. feet
|
- baths - beds |
show details | |

|
#37
S 6th St
Springfield, IL 62703
|
- sq. feet
|
- baths - beds |
show details | |

|
#38
S 1st St
Springfield, IL 62704
|
- sq. feet
|
- baths - beds |
show details | |

|
#39
Arrowhead Dr
Springfield, IL 62702
|
- sq. feet
|
- baths - beds |
show details | |

|
#40
W Monroe St Apt C
Springfield, IL 62704
|
- sq. feet
|
- baths - beds |
show details |
| Photo | Address | Area | Beds / Baths | Price | Details |
|---|---|---|---|---|---|

|
#41
E Edwards St
Springfield, IL 62703
|
- sq. feet
|
- baths - beds |
show details | |

|
#42
E Cedar St
Springfield, IL 62703
|
- sq. feet
|
- baths - beds |
show details | |

|
#43
S Paul St
Springfield, IL 62703
|
- sq. feet
|
- baths - beds |
show details | |

|
#44
Gettysburg Dr
Springfield, IL 62702
|
- sq. feet
|
- baths - beds |
show details | |

|
#45
N Daniel Ave
Springfield, IL 62702
|
- sq. feet
|
- baths - beds |
show details | |

|
#46
Sandhill Rd
Springfield, IL 62702
|
- sq. feet
|
- baths - beds |
show details | |

|
#47
Grand Valley Dr
Springfield, IL 62702
|
- sq. feet
|
- baths - beds |
show details | |

|
#48
E Enos Ave
Springfield, IL 62702
|
- sq. feet
|
- baths - beds |
show details | |

|
#49
E Converse St
Springfield, IL 62702
|
- sq. feet
|
- baths - beds |
show details | |

|
Check over 1 million property listings on Foreclosure.com!
|
browse all offers | |||

Latest news about housing in Springfield, IL collected exclusively by city-data.com from local newspapers, TV, and radio stations


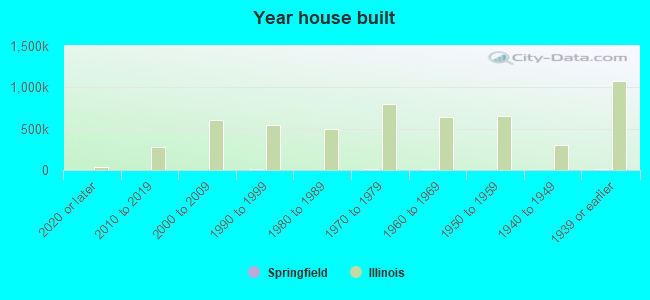
Median year apartment built: 1972
Household type by relationship:
Households: 113,331- Male householders: 22,901 (7,480 living alone), Female householders: 27,627 (13,255 living alone)
19,903 spouses (19,615 opposite-sex spouses), 2,327 unmarried partners, (2,151 opposite-sex unmarried partners), 28,319 children (25,929 natural, 1,295 adopted, 1,095 stepchildren), 2,277 grandchildren, 1,750 brothers or sisters, 871 parents, 211 foster children, 1,235 other relatives, 2,271 non-relatives
- In group quarters: 3,639
Size of family households: 16,345 2-persons, 5,064 3-persons, 3,066 4-persons, 1,696 5-persons, 618 6-persons, 573 7-or-more-persons.
Size of nonfamily households: 20,735 1-person, 2,227 2-persons, 47 3-persons, 157 4-persons.
11,204 married couples with children.
9,180 single-parent households (1,855 men, 7,325 women).
93.6% of residents of Springfield speak English at home.
2.1% of residents speak Spanish at home (70% speak English very well, 19% speak English well, 10% speak English not well, 2% don't speak English at all).
2.0% of residents speak other Indo-European language at home (70% speak English very well, 15% speak English well, 13% speak English not well, 2% don't speak English at all).
1.4% of residents speak Asian or Pacific Island language at home (67% speak English very well, 27% speak English well, 5% speak English not well, 1% don't speak English at all).
0.5% of residents speak other language at home (85% speak English very well, 12% speak English well, 3% speak English not well).
Foreign born population: 5,872 (5.2%)
(56.2% of them are naturalized citizens)
| Here: | 6.2 |
| State: | 6.4 |
| Here: | 4.1 |
| State: | 4.1 |
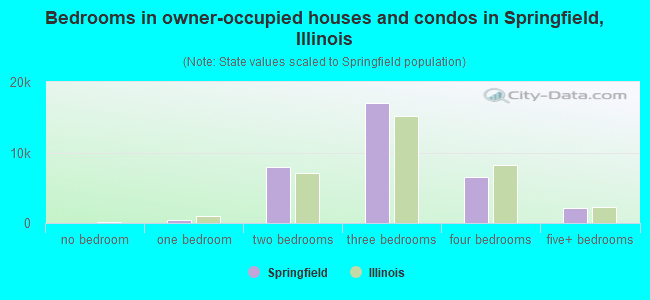
- Bedrooms in owner-occupied houses and condos in Springfield, Illinois
- 0no bedroom
- 4511 bedroom
- 7,9322 bedrooms
- 16,9653 bedrooms
- 6,5844 bedrooms
- 2,1975+ bedrooms
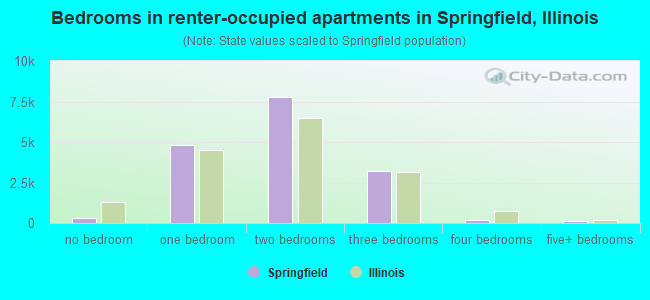
- Bedrooms in renter-occupied apartments in Springfield, Illinois
- 295no bedroom
- 4,8431 bedroom
- 7,7782 bedrooms
- 3,2213 bedrooms
- 1604 bedrooms
- 1025+ bedrooms
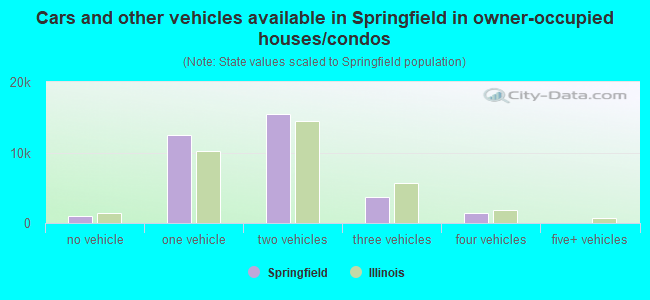
- Cars and other vehicles available in Springfield in owner-occupied houses/condos
- 933no vehicle
- 12,4361 vehicle
- 15,4882 vehicles
- 3,7393 vehicles
- 1,4804 vehicles
- 535+ vehicles
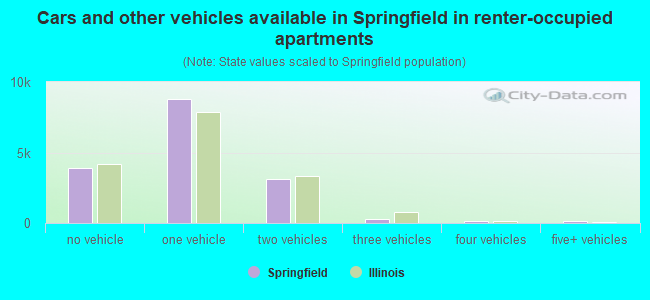
- Cars and other vehicles available in Springfield in renter-occupied apartments
- 3,927no vehicle
- 8,7841 vehicle
- 3,1052 vehicles
- 2793 vehicles
- 1574 vehicles
- 1475+ vehicles
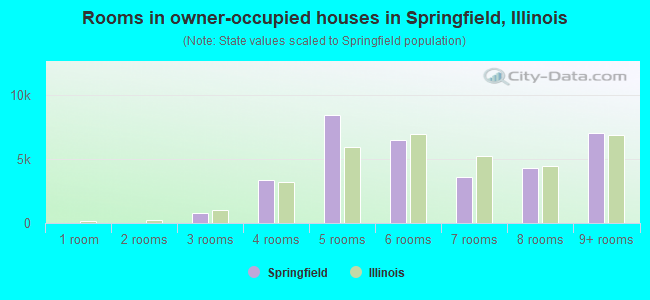
- Rooms in owner-occupied houses in Springfield, Illinois
- 01 room
- 02 rooms
- 7743 rooms
- 3,3484 rooms
- 8,4695 rooms
- 6,5186 rooms
- 3,6167 rooms
- 4,3108 rooms
- 7,0949+ rooms
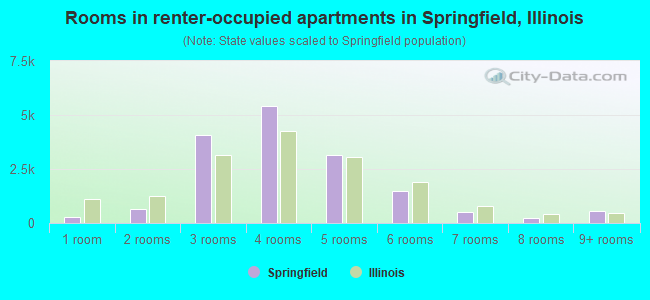
- Rooms in renter-occupied apartments in Springfield, Illinois
- 2951 room
- 6322 rooms
- 4,0653 rooms
- 5,4374 rooms
- 3,1705 rooms
- 1,4846 rooms
- 5167 rooms
- 2258 rooms
- 5759+ rooms
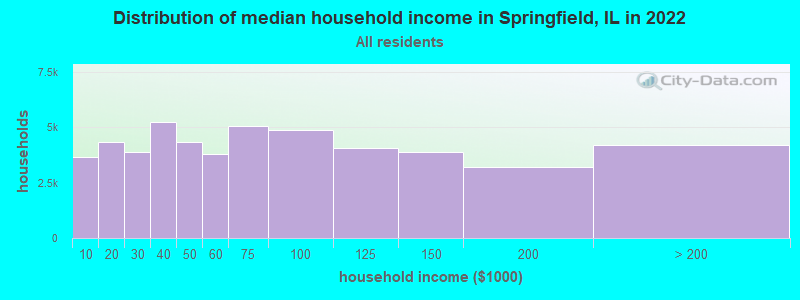
Springfield, IL household income distribution

- 3,649Less than $10,000
- 4,330$10,000 to $19,999
- 3,896$20,000 to $29,999
- 5,227$30,000 to $39,999
- 4,326$40,000 to $49,999
- 3,807$50,000 to $59,999
- 5,069$60,000 to $74,999
- 4,880$75,000 to $99,999
- 4,055$100,000 to $124,999
- 3,888$125,000 to $149,999
- 3,196$150,000 to $199,999
- 4,205$200,000 or more
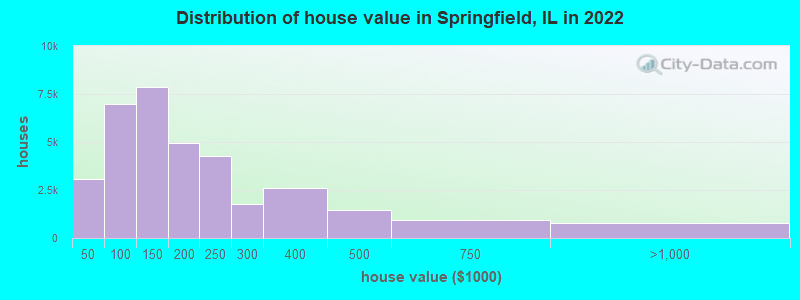
Home value of owner - occupied houses in 2022 in Springfield, IL
-
- 410Less than $10,000
- 546$10,000 to $14,999
- 326$15,000 to $19,999
- 188$20,000 to $24,999
- 696$25,000 to $29,999
- 253$30,000 to $34,999
- 115$35,000 to $39,999
- 518$40,000 to $49,999
- 1,111$50,000 to $59,999
- 842$60,000 to $69,999
- 764$70,000 to $79,999
- 2,233$80,000 to $89,999
- 1,537$90,000 to $99,999
- 4,062$100,000 to $124,999
- 3,791$125,000 to $149,999
- 3,108$150,000 to $174,999
- 1,852$175,000 to $199,999
- 4,269$200,000 to $249,999
- 1,778$250,000 to $299,999
- 2,581$300,000 to $399,999
- 1,449$400,000 to $499,999
- 928$500,000 to $749,999
- 693$750,000 to $999,999
- 79$2,000,000 or more
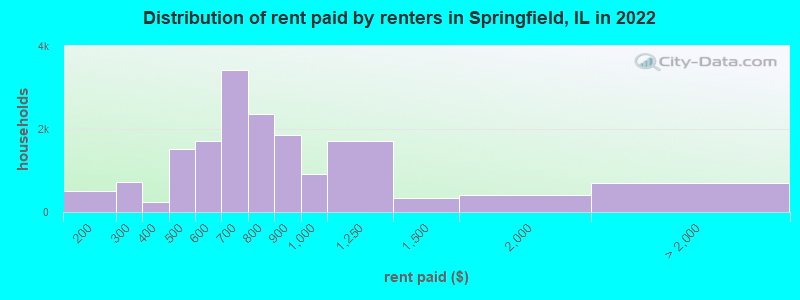
Rent paid by renters in 2022 in Springfield, IL
-
- 244$100 to $149
- 270$150 to $199
- 340$200 to $249
- 394$250 to $299
- 247$300 to $349
- 715$400 to $449
- 812$450 to $499
- 1,080$500 to $549
- 622$550 to $599
- 1,575$600 to $649
- 1,851$650 to $699
- 1,429$700 to $749
- 921$750 to $799
- 1,865$800 to $899
- 905$900 to $999
- 1,708$1,000 to $1,249
- 329$1,250 to $1,499
- 400$1,500 to $1,999
- 210$2,000 to $2,499
- 73$2,500 to $2,999
- 163$3,500 or more
- 246No cash rent
Percentage of workers working in this county: 95.1%
Number of people working at home: 6,922 (13.4% of all workers)
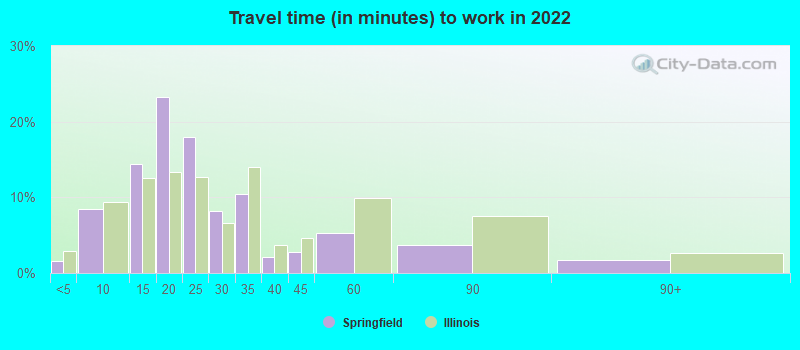
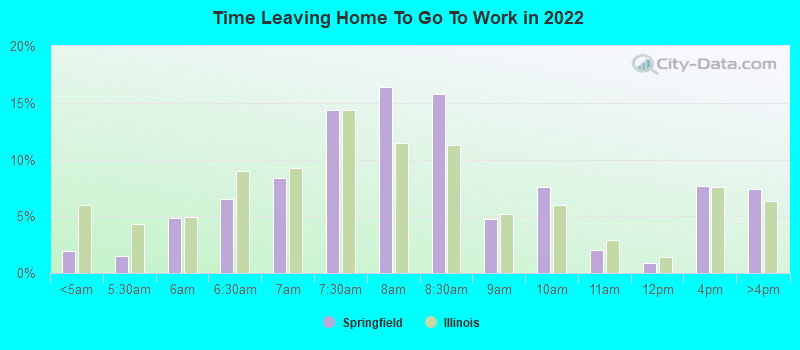
Travel time to work (commute)
- Less than 5 minutes: 1,059
- 5 to 9 minutes: 4,773
- 10 to 14 minutes: 7,785
- 15 to 19 minutes: 12,080
- 20 to 24 minutes: 9,948
- 25 to 29 minutes: 2,160
- 30 to 34 minutes: 1,220
- 35 to 39 minutes: 107
- 40 to 44 minutes: 500
- 45 to 59 minutes: 894
- 60 to 89 minutes: 880
- 90 or more minutes: 461
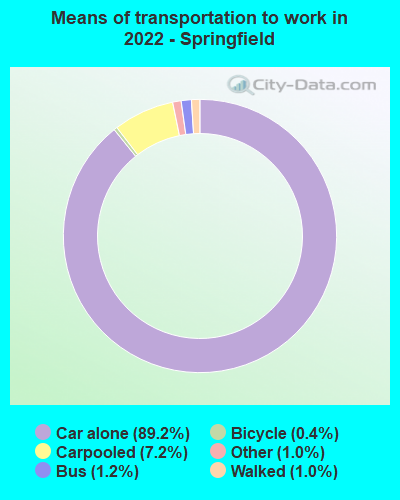
Means of transportation to work:
- Drove a car alone: 65,059 (80.9%)
- Carpooled: 5,128 (6.4%)
- Bus: 992 (1.2%)
- Subway or elevated rail: 13 (0.0%)
- Ferryboat: 2 (0.0%)
- Taxi: 849 (1.1%)
- Bicycle: 287 (0.4%)
- Walked: 654 (0.8%)
- Worked at home: 7,193 (8.9%)
- Unemployment by race in 2022
- Unemployment rate for White non-Hispanic residents
- 7.4%Males
- 4.4%Females
- Unemployment rate for Black residents
- 10.1%Males
- 10.5%Females
- Unemployment rate for Asian residents
- 1.3%Males
- Unemployment rate for other race residents
- 10.8%Males
- 31.5%Females
- Unemployment rate for two or more race residents
- 10.6%Males
- 15.8%Females
- Unemployment rate for Hispanic or Latino residents
- 5.5%Males
- 7.9%Females
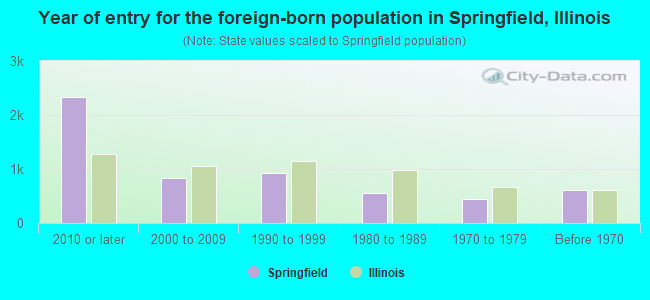
- Year of entry for the foreign-born population in Springfield, Illinois
- 2,3322010 or later
- 8412000 to 2009
- 9241990 to 1999
- 5631980 to 1989
- 4521970 to 1979
- 614Before 1970
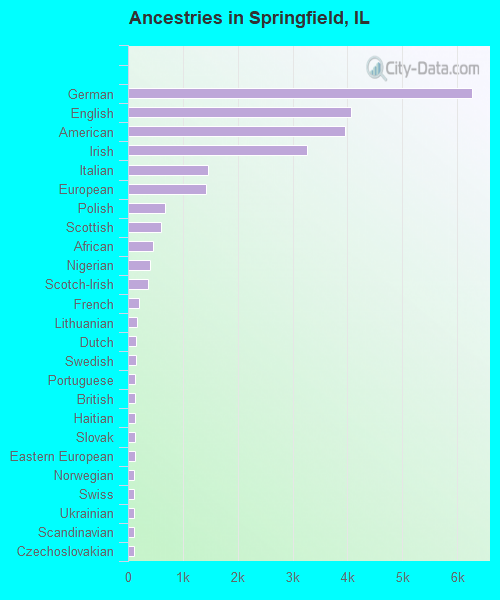
First ancestries reported:
- German: 6,268 (12.0%)
- English: 4,058 (7.8%)
- American: 3,955 (7.6%)
- Irish: 3,266 (6.3%)
- Italian: 1,461 (2.8%)
- European: 1,419 (2.7%)
- Polish: 682 (1.3%)
- Scottish: 593 (1.1%)
- African: 447 (0.9%)
- Nigerian: 394 (0.8%)
- Scotch-Irish: 370 (0.7%)
- French: 205 (0.4%)
- Lithuanian: 171 (0.3%)
- Dutch: 142 (0.3%)
- Swedish: 137 (0.3%)
- Portuguese: 130 (0.2%)
- British: 128 (0.2%)
- Haitian: 125 (0.2%)
- Slovak: 123 (0.2%)
- Eastern European: 121 (0.2%)
- Norwegian: 118 (0.2%)
- Swiss: 117 (0.2%)
- Ukrainian: 115 (0.2%)
- Scandinavian: 111 (0.2%)
- Czechoslovakian: 110 (0.2%)
- Czech: 108 (0.2%)
- Welsh: 73 (0.1%)
- Danish: 66 (0.1%)
- Hungarian: 60 (0.1%)
- Russian: 56 (0.1%)
- Syrian: 44 (0.08%)
- Northern European: 41 (0.08%)
- French Canadian: 38 (0.07%)
- Croatian: 33 (0.06%)
- Iranian: 31 (0.06%)
- Palestinian: 31 (0.06%)
- Belizean: 30 (0.06%)
- Greek: 25 (0.05%)
- Pennsylvania German: 22 (0.04%)
- Austrian: 22 (0.04%)
- Icelander: 19 (0.04%)
- Canadian: 19 (0.04%)
- Romanian: 18 (0.03%)
- Turkish: 18 (0.03%)
- Slovene: 14 (0.03%)
- Bulgarian: 14 (0.03%)
- Ghanaian: 12 (0.02%)
- Egyptian: 11 (0.02%)
- Jordanian: 10 (0.02%)
- Somali: 10 (0.02%)
- Moroccan: 10 (0.02%)
- Iraqi: 8 (0.02%)
- Jamaican: 8 (0.02%)
- Lebanese: 8 (0.02%)
- Serbian: 7 (0.01%)
- Cajun: 6 (0.01%)
Most common places of birth for foreign-born residents (%):
| Springfield: | 14.1% (682) |
| Illinois: | 9.2% (166,409) |
| Springfield: | 8.6% (415) |
| Illinois: | 5.2% (93,003) |
| Springfield: | 7.6% (368) |
| Illinois: | 4.1% (74,364) |
| Springfield: | 7.2% (347) |
| Illinois: | 1.2% (21,186) |
| Springfield: | 6.8% (329) |
| Illinois: | 34.7% (626,958) |
| Springfield: | 3.6% (173) |
| Illinois: | 0.1% (1,856) |
| Springfield: | 3.4% (166) |
| Illinois: | 0.2% (3,231) |
| Springfield: | 3.0% (144) |
| Illinois: | 1.6% (29,519) |
| Springfield: | 2.8% (137) |
| Illinois: | 0.5% (8,235) |
| Springfield: | 2.8% (136) |
| Illinois: | 0.9% (16,553) |
| Springfield: | 2.5% (122) |
| Illinois: | 0.2% (2,988) |
| Springfield: | 2.4% (118) |
| Illinois: | 0.5% (8,551) |
| Springfield: | 2.4% (116) |
| Illinois: | 2.2% (40,393) |
| Springfield: | 2.1% (102) |
| Illinois: | 0.2% (3,363) |
| Springfield: | 1.9% (90) |
| Illinois: | 0.5% (9,688) |
| Springfield: | 1.8% (85) |
| Illinois: | 0.5% (9,671) |
| Springfield: | 1.7% (80) |
| Illinois: | 1.6% (29,316) |
| Springfield: | 1.5% (73) |
| Illinois: | 1.0% (18,753) |
Place of birth for U.S.-born residents:
- This state: 90,529
- Other state: 16,089
- Northeast: 1,456
- Midwest: 8,995
- South: 3,702
- West: 1,936
86.3% of Springfield residents lived in the same house 1 years ago.
Out of people who lived in different houses, 43.5% lived in this county.
Out of people who lived in different counties, 82.0% lived in Illinois.
| Springfield: | 86.3% |
| State average: | 88.3% |
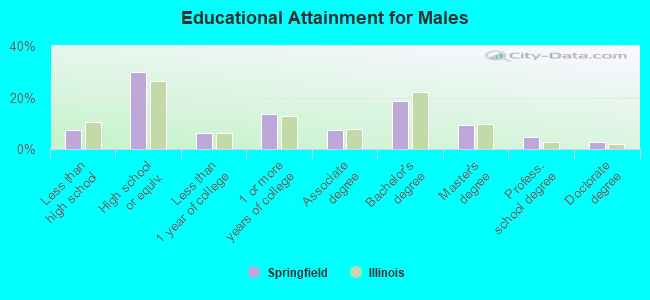
Education attainment for males 25 years and older:
- No schooling: 583
- Nursery to 4th grade: 35
- 5th and 6th grade: 98
- 7th and 8th grade: 588
- 9th grade: 523
- 10th grade: 298
- 11th grade: 270
- 12th grade, no diploma: 394
- High school graduate (or equivalency): 11,139
- Less than 1 year of college: 2,238
- Some college more than 1 year, no degree: 5,044
- Associate degree: 2,760
- Bachelor's degree: 6,898
- Master's degree: 3,503
- Professional school degree: 1,736
- Doctorate degree: 992
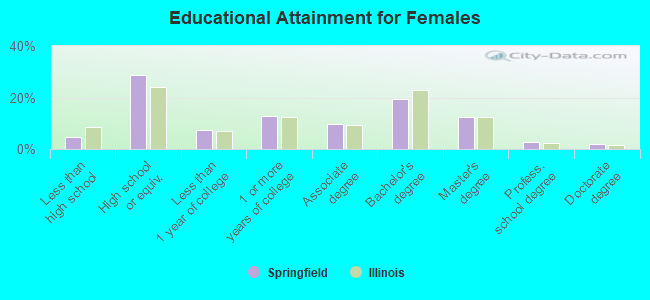
Education attainment for females 25 years and older:
- No schooling: 170
- Nursery to 4th grade: 44
- 5th and 6th grade: 201
- 7th and 8th grade: 178
- 9th grade: 220
- 10th grade: 223
- 11th grade: 647
- 12th grade, no diploma: 425
- High school graduate (or equivalency): 12,903
- Less than 1 year of college: 3,356
- Some college more than 1 year, no degree: 5,719
- Associate degree: 4,293
- Bachelor's degree: 8,752
- Master's degree: 5,571
- Professional school degree: 1,132
- Doctorate degree: 927
Housing units in structures:
- One, detached: 38,216
- One, attached: 3,327
- Two: 1,843
- 3 or 4: 1,479
- 5 to 9: 3,684
- 10 to 19: 2,555
- 20 to 49: 1,206
- 50 or more: 3,251
- Mobile homes: 2,749
Median worth of mobile homes: $28,500
Housing units lacking complete kitchen facilities in 2022: 0.5%
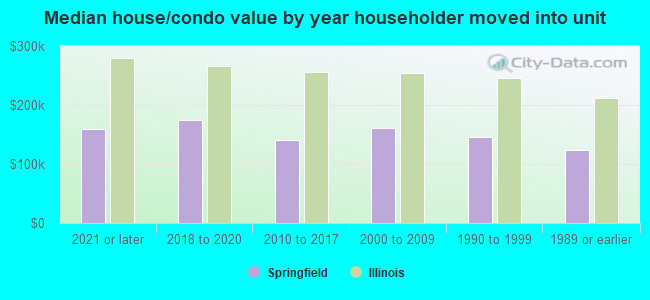
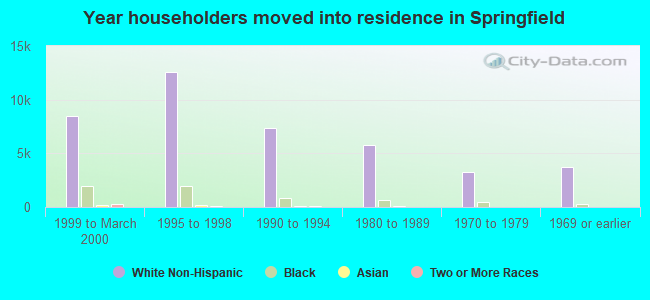
House/condo owner moved in on average 10 years ago
Renter moved in on average 3 years ago
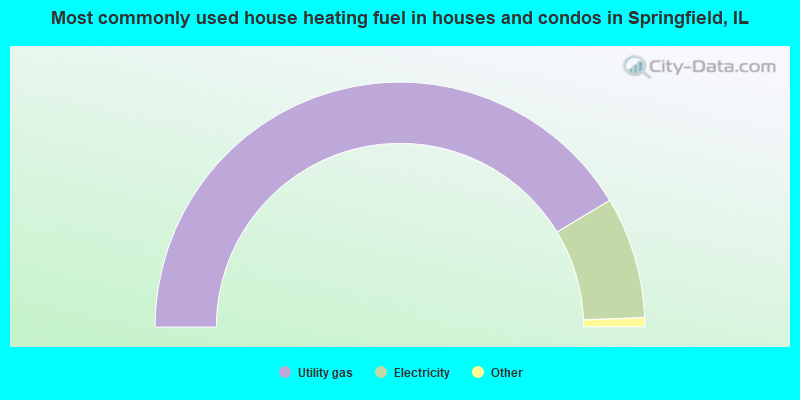
- 82.7%Utility gas
- 16.1%Electricity
- 0.7%Bottled, tank, or LP gas
- 0.2%No fuel used
- 0.1%Other fuel
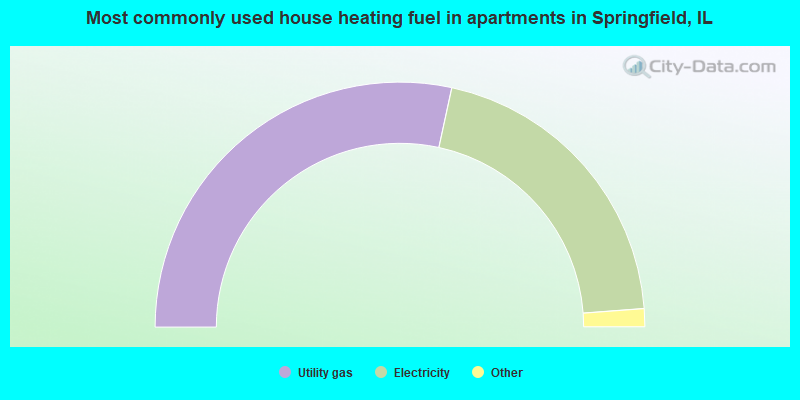
- 56.8%Utility gas
- 40.8%Electricity
- 1.1%No fuel used
- 0.8%Bottled, tank, or LP gas
- 0.2%Other fuel
- 0.1%Solar energy
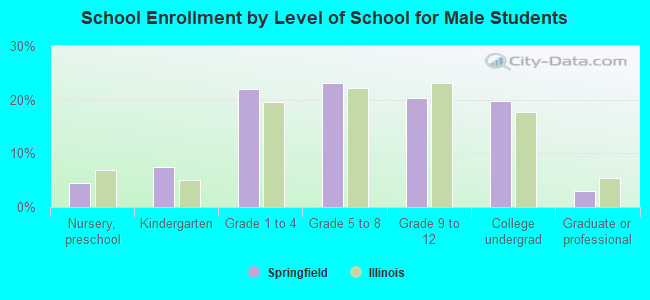
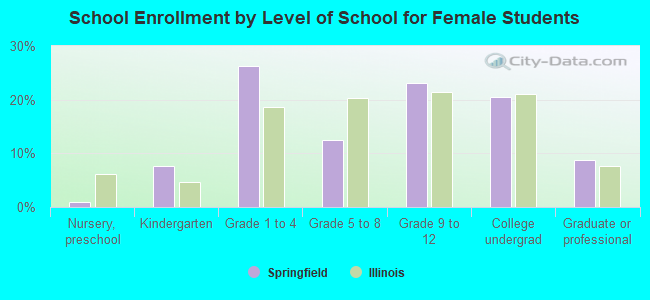
Private vs. public school enrollment:
| Here: | 19.3% |
| Illinois: | 13.3% |
| Here: | 4.6% |
| Illinois: | 9.9% |
| Here: | 19.7% |
| Illinois: | 27.4% |