St. James, NY (New York) Houses and Residents
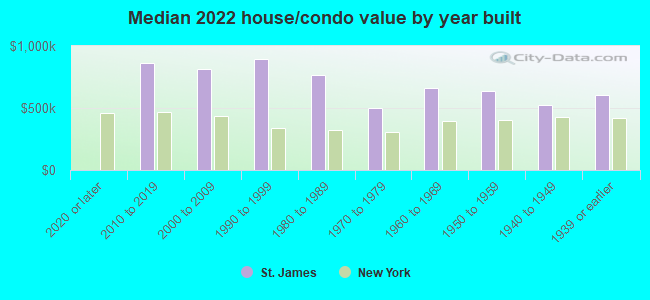
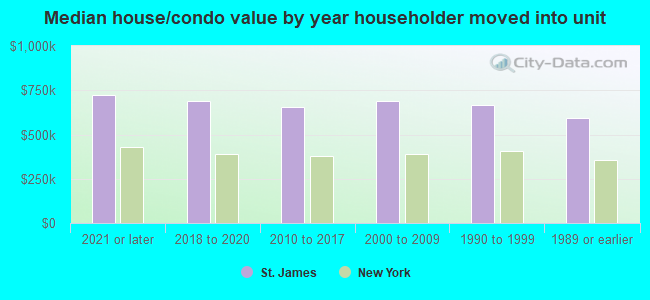
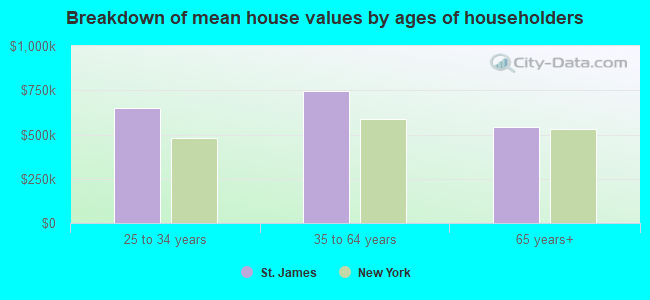
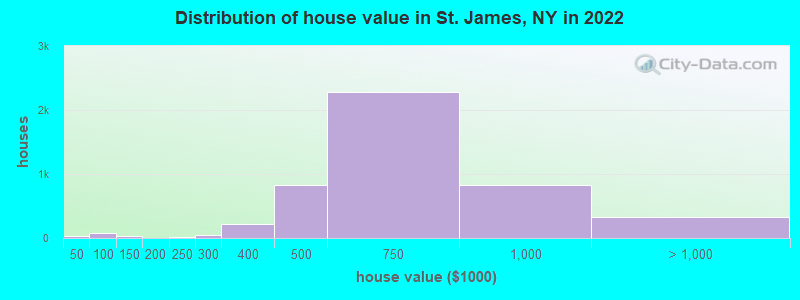
Estimated median house or condo value in 2022: $663,891 (it was $225,600 in 2000 )
St. James:
$663,891New York:
$400,400
Lower value quartile - upper value quartile: $504,383 - $771,688Mean price in 2022: Detached houses: $700,465 Here:
$700,465State:
$476,719
Townhouses or other attached units: $447,483 Here:
$447,483State:
$699,270
In 2-unit structures: $398,608 Here:
$398,608State:
$713,077
In 3-to-4-unit structures: $293,860 Here:
$293,860State:
$764,568
In 5-or-more-unit structures: $334,235 Here:
$334,235State:
$912,009
Total population: 13,338 (Urban population: 13,268, Rural population: 0)
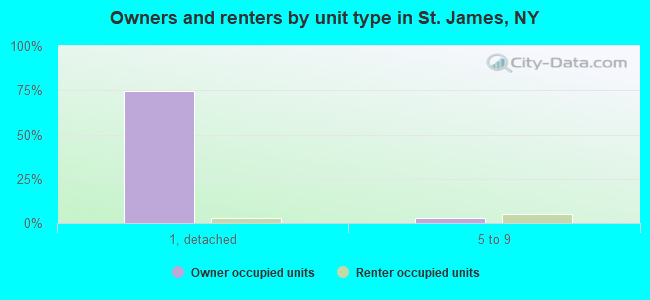
Houses: 5,010 (4,840 occupied: 4,326 owner occupied, 511 renter occupied )
% of renters here:
11%State:
46%
Housing density: 1,104 houses/condos per square mile
Median price asked for vacant for-sale houses and condos in 2022: $920,397.
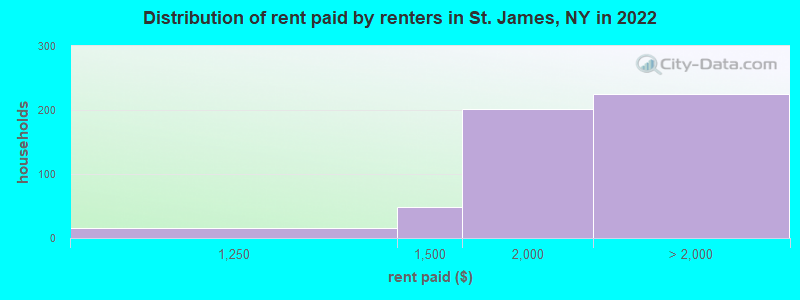
Median contract rent in 2022: $1,931 (lower quartile is $1,530, upper quartile is over $2,000)
Median rent asked for vacant for-rent units in 2022: $4,867
Median gross rent in St. James, NY in 2022: over $2,000
Housing units in St. James with a mortgage: 2,564 (419 second mortgage, 15 home equity loan, 387 both second mortgage and home equity loan )Houses without a mortgage: 118
Median household income for houses/condos with a mortgage: $175,814
Median household income for apartments without a mortgage: $93,745
Median monthly housing costs: $2,593
Data:
Median house or condo value ($)
Median house or condo value ($ change since 2000)
Median house or condo value ($) - White
Median house or condo value ($) - Black or African American
Median house or condo value ($) - Asian
Median house or condo value ($) - Hispanic or Latino
Median house or condo value ($) - American Indian and Alaska Native
Median house or condo value ($) - Multirace
Median house or condo value ($) - Other Race
Median price asked for mobile homes ($)
Household density (households per square mile)
Mean house or condo value by units in structure - 1, detached ($)
Mean house or condo value by units in structure - 1, attached ($)
Mean house or condo value by units in structure - 2 ($)
Mean house or condo value by units in structure by units in structure - 3 or 4 ($)
Mean house or condo value by units in structure - 5 or more ($)
Mean house or condo value by units in structure - Boat, RV, van, etc. ($)
Mean house or condo value by units in structure - Mobile home ($)
Median contract rent ($)
Median contract rent - Lower quartile ($)
Median contract rent - Upper quartile ($)
Median gross rent ($)
Urban houses (%)
Rural houses (%)
Houses occupied (%)
Houses occupied (% change since 2000)
Houses owner occupied (%)
Houses owner occupied (% change since 2000)
Houses renter occupied (%)
Houses renter occupied (% change since 2000)
Vacant housing units - For rent (%)
Vacant housing units - For rent (% change since 2000)
Vacant housing units - For sale only (%)
Vacant housing units - For sale only (% change since 2000)
Vacant housing units - Rented or sold, not occupied (%)
Vacant housing units - Rented or sold, not occupied (% change since 2000)
Vacant housing units - For seasonal, recreational, or occasional use (%)
Vacant housing units - For seasonal, recreational, or occasional use (% change since 2000)
Vacant housing units - For migrant workers (%)
Vacant housing units - For migrant workers (% change since 2000)
Vacant housing units - Other vacant (%)
Vacant housing units - Other vacant (% change since 2000)
Median monthly housing costs ($)
Median household income for houses/condos with a mortgage ($)
Median household income for houses/condos without a mortgage ($)
Median household income ($)
Median household income ($) - White
Median household income ($) - Black or African American
Median household income ($) - Asian
Median household income ($) - Hispanic or Latino
Median household income ($) - American Indian and Alaska Native
Median household income ($) - Multirace
Median household income ($) - Other Race
Mortgage status - with mortgage (%)
Mortgage status - with second mortgage (%)
Mortgage status - with home equity loan (%)
Mortgage status - with both second mortgage and home equity loan (%)
Mortgage status - without a mortgage (%)
Median year house/condo built
Median year apartment built
Household type by relationship - Male householder living alone (%)
Household type by relationship - Male householder not living alone (%)
Household type by relationship - Female householder living alone (%)
Household type by relationship - Female householder not living alone (%)
Household type by relationship - Opposite-Sex spouse (%)
Household type by relationship - Same-Sex spouse (%)
Household type by relationship - Opposite-Sex unmarried partner (%)
Household type by relationship - Same-Sex unmarried partner (%)
Household type by relationship - In group quarters (%)
Size of family households - 2-person household (%)
Size of family households - 3-person household (%)
Size of family households - 4-person household (%)
Size of family households - 5-person household (%)
Size of family households - 6-person household (%)
Size of family households - 7-or-more-person household (%)
Size of nonfamily households - 1-person household (%)
Size of nonfamily households - 2-person household (%)
Size of nonfamily households - 3-person household (%)
Size of nonfamily households - 4-person household (%)
Size of nonfamily households - 5-person household (%)
Size of nonfamily households - 6-person household (%)
Size of nonfamily households - 7-or-moreperson household (%)
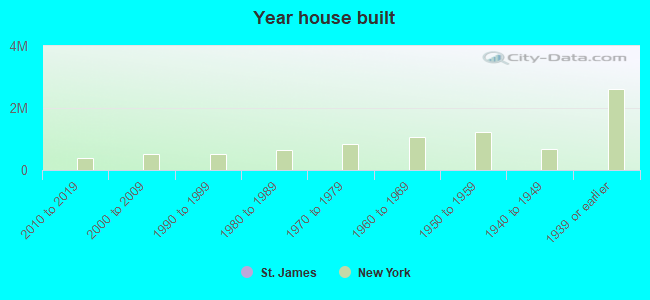
Year house built - Built 2010 or later (%)
Year house built - Built 2000 to 2009 (%)
Year house built - Built 1990 to 1999 (%)
Year house built - Built 1980 to 1989 (%)
Year house built - Built 1970 to 1979 (%)
Year house built - Built 1960 to 1969 (%)
Year house built - Built 1950 to 1959 (%)
Year house built - Built 1940 to 1949 (%)
Year house built - Built 1939 or earlier (%)
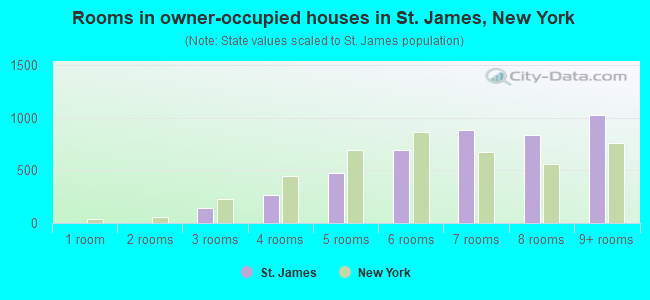
Median number of rooms in houses and condos
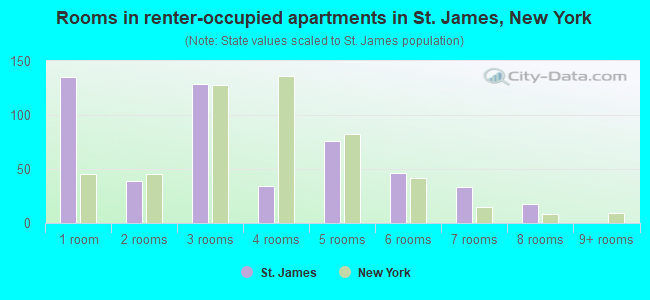
Median number of rooms in apartments
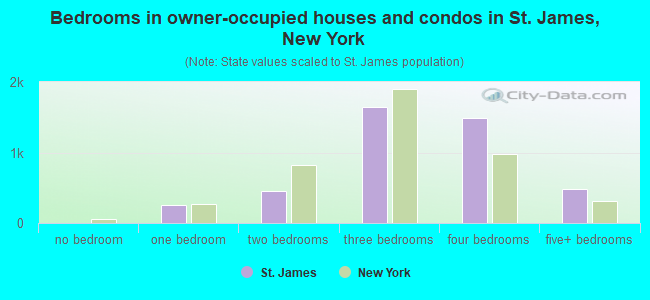
Median number of bedrooms in owner occupied houses
Mean number of bedrooms in owner occupied houses
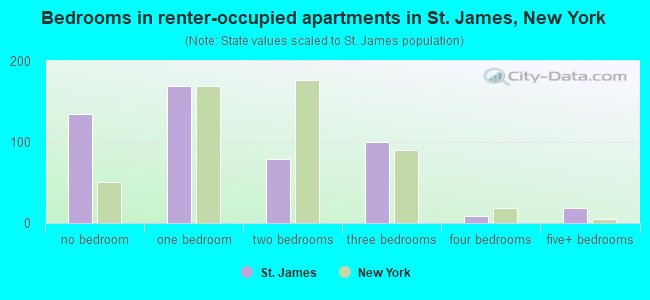
Median number of bedrooms in renter occupied houses
Mean number of bedrooms in renter occupied houses
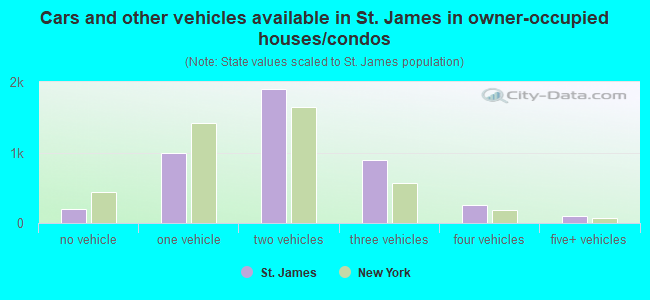
Median number of vehichles in owner occupied houses
Mean number of vehichles in owner occupied houses
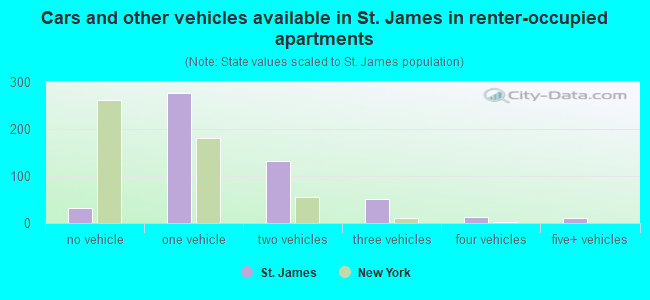
Median number of vehichles in renter occupied houses
Mean number of vehichles in renter occupied houses
Rooms in owner-occupied houses - 1 room (%)
Rooms in owner-occupied houses - 2 rooms (%)
Rooms in owner-occupied houses - 3 rooms (%)
Rooms in owner-occupied houses - 4 rooms (%)
Rooms in owner-occupied houses - 5 rooms (%)
Rooms in owner-occupied houses - 6 rooms (%)
Rooms in owner-occupied houses - 7 rooms (%)
Rooms in owner-occupied houses - 8 rooms (%)
Rooms in owner-occupied houses - 9+ rooms (%)
Rooms in renter-occupied houses - 1 room (%)
Rooms in renter-occupied houses - 2 rooms (%)
Rooms in renter-occupied houses - 3 rooms (%)
Rooms in renter-occupied houses - 4 rooms (%)
Rooms in renter-occupied houses - 5 rooms (%)
Rooms in renter-occupied houses - 6 rooms (%)
Rooms in renter-occupied houses - 7 rooms (%)
Rooms in renter-occupied houses - 8 rooms (%)
Rooms in renter-occupied houses - 9+ rooms (%)
Bedrooms in owner-occupied houses - no bedrooms (%)
Bedrooms in owner-occupied houses - 1 bedroom (%)
Bedrooms in owner-occupied houses - 2 bedrooms (%)
Bedrooms in owner-occupied houses - 3 bedrooms (%)
Bedrooms in owner-occupied houses - 4 bedrooms (%)
Bedrooms in owner-occupied houses - 5+ bedrooms (%)
Bedrooms in renter-occupied houses - no bedrooms (%)
Bedrooms in renter-occupied houses - 1 bedroom (%)
Bedrooms in renter-occupied houses - 2 bedrooms (%)
Bedrooms in renter-occupied houses - 3 bedrooms (%)
Bedrooms in renter-occupied houses - 4 bedrooms (%)
Bedrooms in renter-occupied houses - 5+ bedrooms (%)
Vehicles available in owner-occupied houses - no vehicle available (%)
Vehicles available in owner-occupied houses - 1 vehicle available(%)
Vehicles available in owner-occupied houses - 2 Vehicles available (%)
Vehicles available in owner-occupied houses - 3 Vehicles available (%)
Vehicles available in owner-occupied houses - 4 Vehicles available (%)
Vehicles available in owner-occupied houses - 5+ Vehicles available (%)
Vehicles available in renter-occupied houses - no vehicle available (%)
Vehicles available in renter-occupied houses - 1 vehicle available (%)
Vehicles available in renter-occupied houses - 2 Vehicles available (%)
Vehicles available in renter-occupied houses - 3 Vehicles available (%)
Vehicles available in renter-occupied houses - 4 Vehicles available (%)
Vehicles available in renter-occupied houses - 5+ Vehicles available (%)
Housing units in structures - 1, detached (%)
Housing units in structures - 1, attached (%)
Housing units in structures - 2 (%)
Housing units in structures - 3 or 4 (%)
Housing units in structures - 5 to 9 (%)
Housing units in structures - 10 to 19 (%)
Housing units in structures - 20 to 49 (%)
Housing units in structures - 50 or more (%)
Housing units in structures - Mobile home (%)
Housing units in structures - Boat, RV, van, etc. (%)
Housing units in structures - Owners - 1, detached (%)
Housing units in structures - Owners - 1, attached (%)
Housing units in structures - Owners - 2 (%)
Housing units in structures - Owners - 3 or 4 (%)
Housing units in structures - Owners - 5 to 9 (%)
Housing units in structures - Owners - 10 to 19 (%)
Housing units in structures - Owners - 20 to 49 (%)
Housing units in structures - Owners - 50 or more (%)
Housing units in structures - Owners - Mobile home (%)
Housing units in structures - Owners - Boat, RV, van, etc. (%)
Housing units in structures - Renters - 1, detached (%)
Housing units in structures - Renters - 1, attached (%)
Housing units in structures - Renters - 2 (%)
Housing units in structures - Renters - 3 or 4 (%)
Housing units in structures - Renters - 5 to 9 (%)
Housing units in structures - Renters - 10 to 19 (%)
Housing units in structures - Renters - 20 to 49 (%)
Housing units in structures - Renters - 50 or more (%)
Housing units in structures - Renters - Mobile home (%)
Housing units in structures - Renters - Boat, RV, van, etc. (%)
House/condo owner moved in on average (years ago)
Renter moved in on average (years ago)
Year householder moved into unit - Moved in 1999 to March 2000 (%)
Year householder moved into unit - Moved in 1999 to March 2000 (%) - White
Year householder moved into unit - Moved in 1999 to March 2000 (%) - Black or African American
Year householder moved into unit - Moved in 1999 to March 2000 (%) - Asian
Year householder moved into unit - Moved in 1999 to March 2000 (%) - Hispanic or Latino
Year householder moved into unit - Moved in 1999 to March 2000 (%) - American Indian and Alaska Native
Year householder moved into unit - Moved in 1999 to March 2000 (%) - Multirace
Year householder moved into unit - Moved in 1999 to March 2000 (%) - Other Race
Year householder moved into unit - Moved in 1995 to 1998 (%)
Year householder moved into unit - Moved in 1995 to 1998 (%) - White
Year householder moved into unit - Moved in 1995 to 1998 (%) - Black or African American
Year householder moved into unit - Moved in 1995 to 1998 (%) - Asian
Year householder moved into unit - Moved in 1995 to 1998 (%) - Hispanic or Latino
Year householder moved into unit - Moved in 1995 to 1998 (%) - American Indian and Alaska Native
Year householder moved into unit - Moved in 1995 to 1998 (%) - Multirace
Year householder moved into unit - Moved in 1995 to 1998 (%) - Other Race
Year householder moved into unit - Moved in 1990 to 1994 (%)
Year householder moved into unit - Moved in 1990 to 1994 (%) - White
Year householder moved into unit - Moved in 1990 to 1994 (%) - Black or African American
Year householder moved into unit - Moved in 1990 to 1994 (%) - Asian
Year householder moved into unit - Moved in 1990 to 1994 (%) - Hispanic or Latino
Year householder moved into unit - Moved in 1990 to 1994 (%) - American Indian and Alaska Native
Year householder moved into unit - Moved in 1990 to 1994 (%) - Multirace
Year householder moved into unit - Moved in 1990 to 1994 (%) - Other Race
Year householder moved into unit - Moved in 1980 to 1989 (%)
Year householder moved into unit - Moved in 1980 to 1989 (%) - White
Year householder moved into unit - Moved in 1980 to 1989 (%) - Black or African American
Year householder moved into unit - Moved in 1980 to 1989 (%) - Asian
Year householder moved into unit - Moved in 1980 to 1989 (%) - Hispanic or Latino
Year householder moved into unit - Moved in 1980 to 1989 (%) - American Indian and Alaska Native
Year householder moved into unit - Moved in 1980 to 1989 (%) - Multirace
Year householder moved into unit - Moved in 1980 to 1989 (%) - Other Race
Year householder moved into unit - Moved in 1970 to 1979 (%)
Year householder moved into unit - Moved in 1970 to 1979 (%) - White
Year householder moved into unit - Moved in 1970 to 1979 (%) - Black or African American
Year householder moved into unit - Moved in 1970 to 1979 (%) - Asian
Year householder moved into unit - Moved in 1970 to 1979 (%) - Hispanic or Latino
Year householder moved into unit - Moved in 1970 to 1979 (%) - American Indian and Alaska Native
Year householder moved into unit - Moved in 1970 to 1979 (%) - Multirace
Year householder moved into unit - Moved in 1970 to 1979 (%) - Other Race
Year householder moved into unit - Moved in 1969 or earlier (%)
Year householder moved into unit - Moved in 1969 or earlier (%) - White
Year householder moved into unit - Moved in 1969 or earlier (%) - Black or African American
Year householder moved into unit - Moved in 1969 or earlier (%) - Asian
Year householder moved into unit - Moved in 1969 or earlier (%) - Hispanic or Latino
Year householder moved into unit - Moved in 1969 or earlier (%) - American Indian and Alaska Native
Year householder moved into unit - Moved in 1969 or earlier (%) - Multirace
Year householder moved into unit - Moved in 1969 or earlier (%) - Other Race
Housing units lacking complete plumbing facilities (%)
Housing units lacking complete kitchen facilities (%)
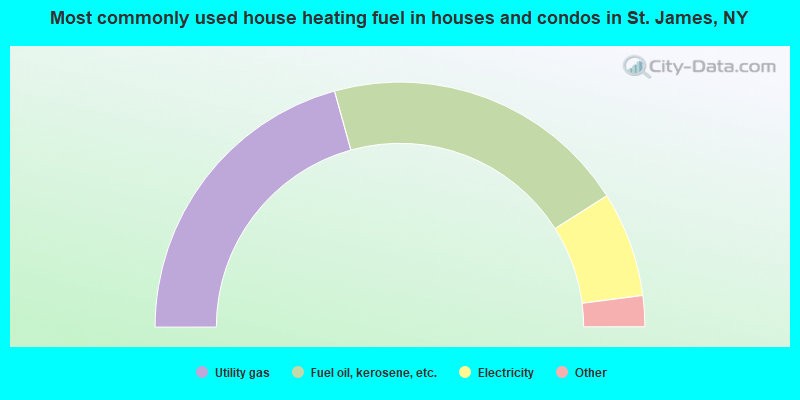
House heating fuel used in houses and condos - Utility gas (%)
House heating fuel used in houses and condos - Bottled, tank, or LP gas (%)
House heating fuel used in houses and condos - Electricity (%)
House heating fuel used in houses and condos - Fuel oil, kerosene, etc. (%)
House heating fuel used in houses and condos - Coal or coke (%)
House heating fuel used in houses and condos - Wood (%)
House heating fuel used in houses and condos - Solar energy (%)
House heating fuel used in houses and condos - Other fuel (%)
House heating fuel used in houses and condos - No fuel used (%)
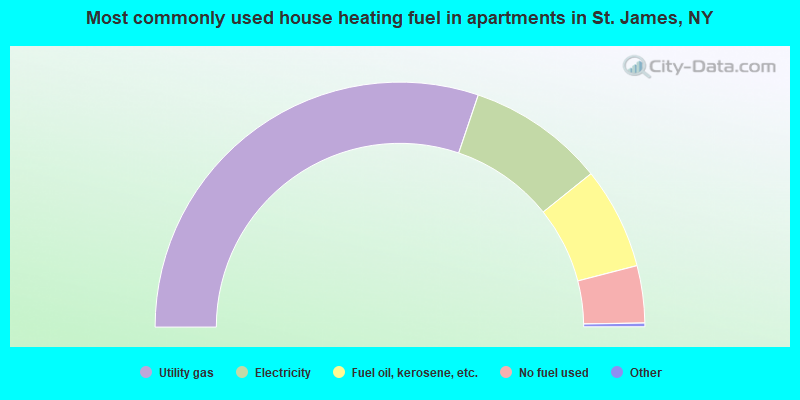
House heating fuel used in apartments - Utility gas (%)
House heating fuel used in apartments - Bottled, tank, or LP gas (%)
House heating fuel used in apartments - Electricity (%)
House heating fuel used in apartments - Fuel oil, kerosene, etc. (%)
House heating fuel used in apartments - Coal or coke (%)
House heating fuel used in apartments - Wood (%)
House heating fuel used in apartments - Solar energy (%)
House heating fuel used in apartments - Other fuel (%)
House heating fuel used in apartments - No fuel used (%)
Median year house/condo built: 1968Median year apartment built: 1982Household type by relationship:
Households: 13,741
Male householders: 2,214 (251 living alone ), Female householders: 2,614 (856 living alone )3,011 spouses (3,011 opposite-sex spouses ), 220 unmarried partners , (197 opposite-sex unmarried partners ), 4,602 children (4,429 natural , 82 adopted , 91 stepchildren ), 136 grandchildren , 116 brothers or sisters , 136 parents , 0 foster children , 158 other relatives , 134 non-relatives In group quarters: 397
Size of family households: 1,586 2-persons , 638 3-persons , 919 4-persons , 288 5-persons , 110 6-persons , 32 7-or-more-persons .
Size of nonfamily households: 1,116 1-person , 157 2-persons , 8 3-persons .
2,040 married couples with children. single-parent households (157 men , 296 women ).
87.9% of residents of St. James speak English at home. of residents speak Spanish at home (71% speak English very well , 19% speak English well , 9% speak English not well ).of residents speak other Indo-European language at home (83% speak English very well , 12% speak English well , 6% speak English not well ).of residents speak Asian or Pacific Island language at home (76% speak English very well , 16% speak English well , 8% don't speak English at all ).of residents speak other language at home (100% speak English very well ).
Foreign born population: 1,002 (7.3%)of them are naturalized citizens )
Median number of rooms in houses and condos:
Median number of rooms in apartments
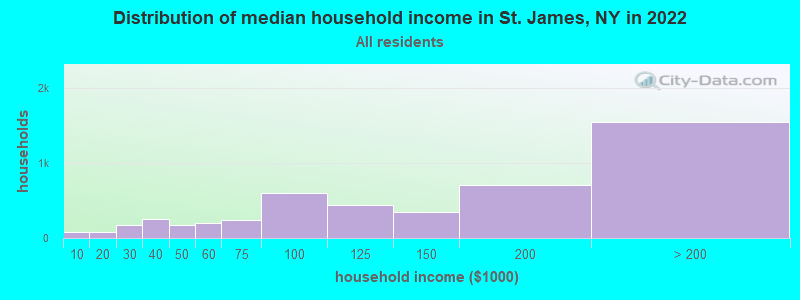
St. James, NY household income distribution 79 Less than $10,00076 $10,000 to $19,999172 $20,000 to $29,999253 $30,000 to $39,999175 $40,000 to $49,999198 $50,000 to $59,999242 $60,000 to $74,999597 $75,000 to $99,999445 $100,000 to $124,999340 $125,000 to $149,999705 $150,000 to $199,9991,545 $200,000 or more
Home value of owner - occupied houses in 2022 in St. James, NY 6 $35,000 to $39,99932 $40,000 to $49,99913 $50,000 to $59,99936 $60,000 to $69,99923 $100,000 to $124,9997 $175,000 to $199,99913 $200,000 to $249,99941 $250,000 to $299,999216 $300,000 to $399,999833 $400,000 to $499,9992,289 $500,000 to $749,999835 $750,000 to $999,999269 $1,000,000 to $1,499,99924 $1,500,000 to $1,999,99939 $2,000,000 or moreRent paid by renters in 2022 in St. James, NY 14 $1,000 to $1,24949 $1,250 to $1,499200 $1,500 to $1,99976 $2,000 to $2,499140 $2,500 to $2,9997 No cash rent
Percentage of workers working in this county: 81.1%Number of people working at home: 793 (11.9% of all workers )
Travel time to work (commute)
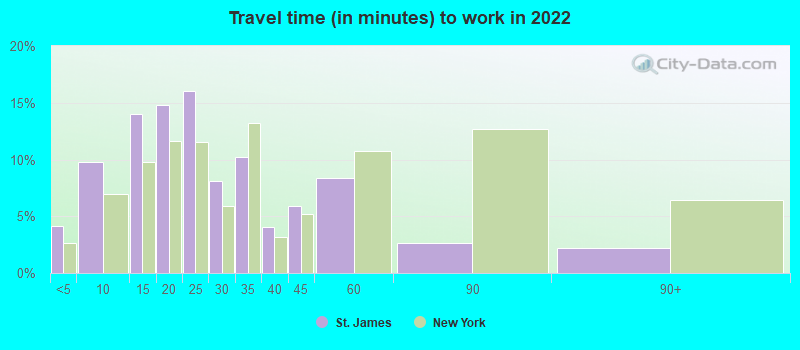
Less than 5 minutes: 3055 to 9 minutes: 43010 to 14 minutes: 84315 to 19 minutes: 47120 to 24 minutes: 66125 to 29 minutes: 46930 to 34 minutes: 82435 to 39 minutes: 14840 to 44 minutes: 27845 to 59 minutes: 51960 to 89 minutes: 53890 or more minutes: 403
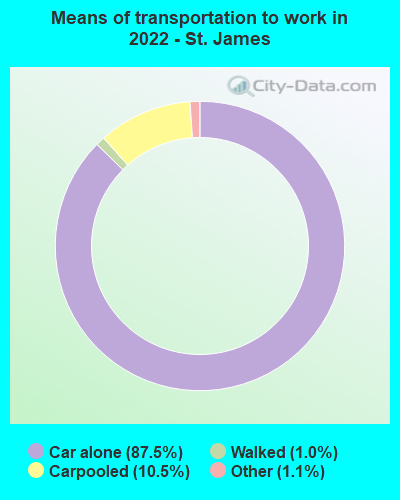
Means of transportation to work:
Drove a car alone: 3,355 (72.1%)Carpooled: 460 (9.9%)Taxi: 52 (1.1%)Walked: 39 (0.8%)Worked at home: 793 (17.0%)
Unemployment by race in 2022
Unemployment rate for White non-Hispanic residents 2.2% Males4.8% FemalesUnemployment rate for Hispanic or Latino residents 9.8% Males
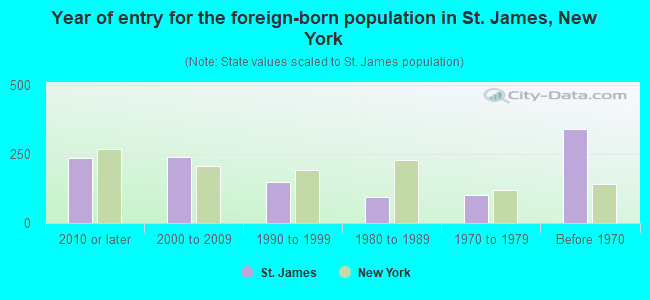
Year of entry for the foreign-born population in St. James, New York
234 2010 or later 239 2000 to 2009 150 1990 to 1999 94 1980 to 1989 100 1970 to 1979 341 Before 1970
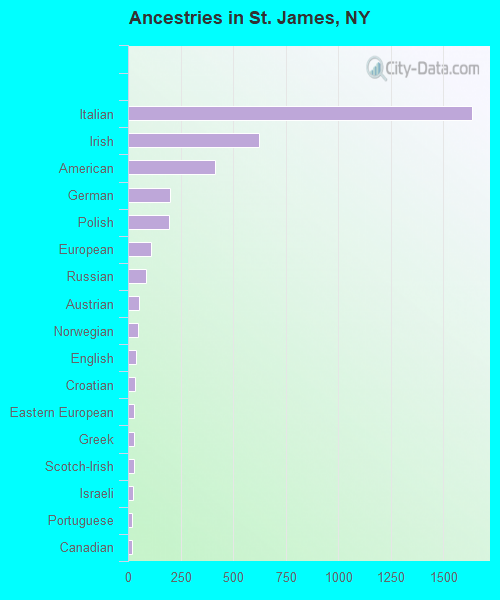
First ancestries reported:
Italian: 1,636 (30.8%)
Irish: 621 (11.7%)
American: 416 (7.8%)
German: 202 (3.8%)
Polish: 197 (3.7%)
European: 108 (2.0%)
Russian: 85 (1.6%)
Austrian: 51 (1.0%)
Norwegian: 47 (0.9%)
English: 37 (0.7%)
Croatian: 32 (0.6%)
Eastern European: 30 (0.6%)
Greek: 29 (0.5%)
Scotch-Irish: 27 (0.5%)
Israeli: 22 (0.4%)
Portuguese: 19 (0.4%)
Canadian: 17 (0.3%)
Egyptian: 12 (0.2%)
Serbian: 10 (0.2%)
Swedish: 10 (0.2%)
Guyanese: 9 (0.2%)
Ukrainian: 9 (0.2%)
Scottish: 7 (0.1%)
French: 6 (0.1%)
Haitian: 6 (0.1%)
Yugoslavian: 6 (0.1%)
British: 5 (0.09%)
Moroccan: 4 (0.08%)
Nigerian: 1 (0.02%)
British West Indian: 1 (0.02%) Most common places of birth for foreign-born residents (%): El Salvador St. James:
16.8% (155)New York:
2.4% (108,067)
India St. James:
11.0% (102)New York:
3.5% (158,432)
Colombia St. James:
10.1% (93)New York:
2.5% (111,920)
China, excluding Hong Kong and Taiwan St. James:
8.2% (76)New York:
9.1% (410,910)
Other South America St. James:
7.0% (65)New York:
0.2% (8,613)
Canada St. James:
6.1% (56)New York:
1.3% (59,107)
Germany St. James:
4.9% (45)New York:
0.9% (38,713)
Russia St. James:
4.8% (44)New York:
1.7% (75,802)
Italy St. James:
2.9% (27)New York:
1.8% (81,374)
Korea St. James:
2.5% (23)New York:
1.8% (82,786)
Egypt St. James:
2.1% (19)New York:
0.6% (27,385)
Philippines St. James:
1.9% (18)New York:
2.0% (91,070)
Guyana St. James:
1.9% (18)New York:
3.8% (172,129)
Croatia St. James:
1.8% (17)New York:
0.1% (6,580)
Place of birth for U.S.-born residents:
This state: 11,548Other state: 940Northeast: 404Midwest: 169South: 206West: 168 93.2% of St. James residents lived in the same house 1 years ago.
Out of people who lived in different houses, 45.4% lived in this county.
Out of people who lived in different counties, 95.1% lived in New York.
St. James:
93.2%State average:
89.6%
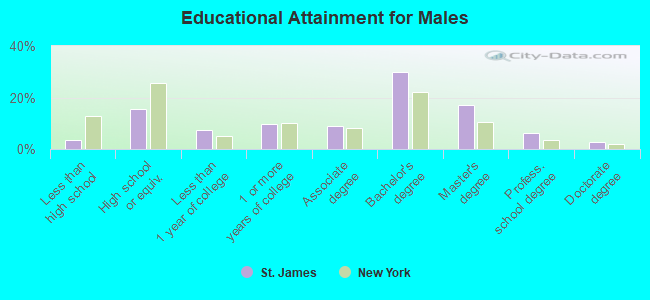
Education attainment for males 25 years and older:
No schooling: 42Nursery to 4th grade: 05th and 6th grade: 67th and 8th grade: 219th grade: 210th grade: 511th grade: 912th grade, no diploma: 66High school graduate (or equivalency): 676Less than 1 year of college: 315Some college more than 1 year, no degree: 423Associate degree: 384Bachelor's degree: 1,307Master's degree: 746Professional school degree: 265Doctorate degree: 113
Education attainment for females 25 years and older:
No schooling: 55Nursery to 4th grade: 85th and 6th grade: 347th and 8th grade: 39th grade: 410th grade: 1611th grade: 2912th grade, no diploma: 97High school graduate (or equivalency): 1,017Less than 1 year of college: 380Some college more than 1 year, no degree: 452Associate degree: 555Bachelor's degree: 1,237Master's degree: 1,205Professional school degree: 169Doctorate degree: 75
Housing units in structures:
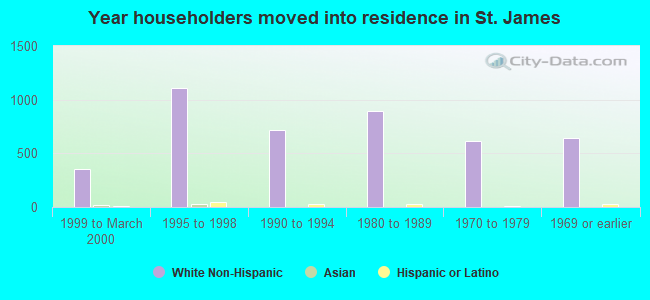
One, detached: 3,862One, attached: 465Two: 1073 or 4: 1175 to 9: 35210 to 19: 7250 or more: 34House/condo owner moved in on average 18 years ago
Renter moved in on average 1 years ago
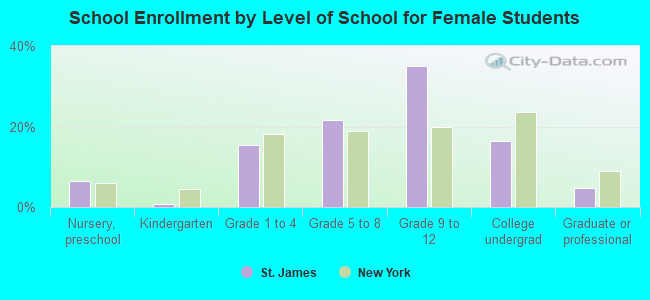
Private vs. public school enrollment:
Students in private schools in grades 1 to 8 (elementary and middle school): 105 Students in private schools in grades 9 to 12 (high school): 131 Students in private undergraduate colleges: 93