St. Lawrence, PA (Pennsylvania) Houses and Residents
| St. Lawrence: | $212,020 |
| Pennsylvania: | $245,500 |
Mean price in 2022:
Detached houses: $221,595
Here: $221,595 State: $317,202 Townhouses or other attached units: $175,525
Here: $175,525 State: $254,369 In 2-unit structures: $208,303
Here: $208,303 State: $249,182
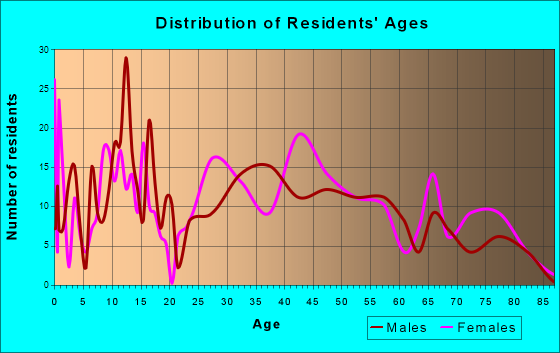
Total population: 1,810 (All urban)
Houses: 743 (722 occupied: 504 owner occupied, 218 renter occupied)
| % of renters here: | 30% |
| State: | 31% |
Housing density: 819 houses/condos per square mile
Median price asked for vacant for-sale houses and condos in 2022 in this county: $196,460.
Median contract rent in 2022: $979 (lower quartile is $734, upper quartile is $1,271)
Median rent asked for vacant for-rent units in 2022: $861
Median gross rent in St. Lawrence, PA in 2022: $1,112
Housing units in St. Lawrence with a mortgage: 370 (54 second mortgage, 0 home equity loan, 48 both second mortgage and home equity loan)
Houses without a mortgage: 3
Median household income for houses/condos with a mortgage: $92,414
Median household income for apartments without a mortgage: $70,848
Median monthly housing costs: $1,331
Compare current foreclosures near St. Lawrence, PA:
| Photo | Address | Area | Beds / Baths | Price | Details |
|---|---|---|---|---|---|

|
#1
E Main St
Birdsboro, PA 19508
|
1,207 sq. feet
|
1 baths 3 beds |
$85,456
|
show details |

|
#2
Mulberry St
Reading, PA 19604
|
1,064 sq. feet
|
1 baths 3 beds |
$7,746
|
show details |

|
#3
Grandview Blvd
Reading, PA 19609
|
2,394 sq. feet
|
2 baths 4 beds |
$329,679
|
show details |

|
#4
Cedar St
Reading, PA 19601
|
1,034 sq. feet
|
1 baths 3 beds |
$58,442
|
show details |

|
#5
Dale Rd
Barto, PA 19504
|
1,254 sq. feet
|
1 baths 3 beds |
$4,165
|
show details |

|
#6
Finney Rd
Glenmoore, PA 19343
|
1,392 sq. feet
|
1 baths 2 beds |
$81,747
|
show details |

|
#7
Pine St
Honey Brook, PA 19344
|
1,232 sq. feet
|
1 baths 3 beds |
$88,729
|
show details |

|
#8
Cupola Rd
Honey Brook, PA 19344
|
2,112 sq. feet
|
1 baths 4 beds |
$165,679
|
show details |

|
#9
N Penn St
Pottstown, PA 19464
|
1,872 sq. feet
|
2 baths 4 beds |
show details | |

|
#10
Linden St
Reading, PA 19604
|
1,164 sq. feet
|
1 baths 3 beds |
show details |
| Photo | Address | Area | Beds / Baths | Price | Details |
|---|---|---|---|---|---|

|
#11
West St
Pottstown, PA 19464
|
1,044 sq. feet
|
1 baths 2 beds |
show details | |

|
#12
Glen Tilt Ave
Wernersville, PA 19565
|
1,656 sq. feet
|
1 baths 3 beds |
show details | |

|
#13
Gregg Ave
Reading, PA 19607
|
1,040 sq. feet
|
1 baths 3 beds |
show details | |

|
#14
Muhlenberg St
Reading, PA 19602
|
1,558 sq. feet
|
1 baths 4 beds |
show details | |

|
#15
Reading Ave
Boyertown, PA 19512
|
1,634 sq. feet
|
1 baths 2 beds |
show details | |

|
#16
Dauphin Ave
Reading, PA 19610
|
2,072 sq. feet
|
1 baths 4 beds |
show details | |

|
#17
Chapel Hill Rd
Reading, PA 19608
|
1,356 sq. feet
|
1 baths 3 beds |
show details | |

|
#18
New Holland Rd
Reading, PA 19607
|
1,352 sq. feet
|
1 baths 3 beds |
show details | |

|
#19
Grant St
Pottstown, PA 19464
|
1,296 sq. feet
|
1 baths 3 beds |
show details | |

|
#20
Benjamin Franklin Hw
Douglassville, PA 19518
|
1,734 sq. feet
|
2 baths 4 beds |
show details |
| Photo | Address | Area | Beds / Baths | Price | Details |
|---|---|---|---|---|---|

|
#21
N Front St
Reading, PA 19601
|
1,897 sq. feet
|
2 baths 4 beds |
show details | |

|
#22
Hazel St
Reading, PA 19611
|
1,076 sq. feet
|
1 baths 3 beds |
show details | |

|
#23
Ringing Rocks Park
Pottstown, PA 19464
|
1,000 sq. feet
|
1 baths 3 beds |
show details | |

|
#24
W Broad St
Reading, PA 19607
|
1,620 sq. feet
|
1 baths 4 beds |
show details | |

|
#25
N 10th St
Reading, PA 19604
|
1,925 sq. feet
|
2 baths 5 beds |
show details | |

|
#26
Commonwealth Blvd
Reading, PA 19607
|
2,709 sq. feet
|
2 baths 4 beds |
show details | |

|
#27
Mount Vernon St
Temple, PA 19560
|
1,704 sq. feet
|
2 baths 3 beds |
show details | |

|
#28
Kindt Corner Rd
Leesport, PA 19533
|
1,190 sq. feet
|
2 baths 3 beds |
show details | |

|
#29
Willow Brook Ln
Pottstown, PA 19464
|
1,566 sq. feet
|
2 baths 3 beds |
show details | |

|
#30
Club Rd
Oley, PA 19547
|
3,437 sq. feet
|
2 baths 3 beds |
show details |
| Photo | Address | Area | Beds / Baths | Price | Details |
|---|---|---|---|---|---|

|
#31
Pear St
Reading, PA 19601
|
1,573 sq. feet
|
1 baths 3 beds |
show details | |

|
#32
Frush Valley Rd
Reading, PA 19605
|
1,040 sq. feet
|
1 baths 3 beds |
show details | |

|
#33
Sycamore Rd
Barto, PA 19504
|
2,534 sq. feet
|
2 baths 4 beds |
show details | |

|
#34
S Kelly Dr
Birdsboro, PA 19508
|
1,820 sq. feet
|
2 baths 4 beds |
show details | |

|
#35
Girard Ave
Reading, PA 19605
|
1,309 sq. feet
|
1 baths 3 beds |
show details | |

|
#36
Lawrence Dr
Gilbertsville, PA 19525
|
2,855 sq. feet
|
3 baths 4 beds |
show details | |

|
#37
Meadow Ln
Pottstown, PA 19465
|
3,115 sq. feet
|
2 baths 4 beds |
show details | |

|
#38
Curtis Rd
Reading, PA 19608
|
2,142 sq. feet
|
1 baths 4 beds |
show details | |

|
#39
Montgomery Ave
New Berlinville, PA 19545
|
1,768 sq. feet
|
2 baths 3 beds |
show details | |

|
#40
Fairview Ave
Reading, PA 19606
|
2,042 sq. feet
|
2 baths 4 beds |
show details |
| Photo | Address | Area | Beds / Baths | Price | Details |
|---|---|---|---|---|---|

|
#41
Penns Ln
Douglassville, PA 19518
|
2,018 sq. feet
|
2 baths 4 beds |
show details | |

|
#42
W 2nd St
Birdsboro, PA 19508
|
1,176 sq. feet
|
1 baths 3 beds |
show details | |

|
#43
Margaret St
Reading, PA 19611
|
1,332 sq. feet
|
1 baths 3 beds |
show details | |

|
#44
Penndale Ave
Reading, PA 19606
|
1,864 sq. feet
|
1 baths 4 beds |
show details | |

|
#45
Moselem Spring Rd
Hamburg, PA 19526
|
1,056 sq. feet
|
2 baths 3 beds |
show details | |

|
#46
Indian Manor Dr
Leesport, PA 19533
|
1,062 sq. feet
|
1 baths 3 beds |
show details | |

|
#47
Micklitz Dr
Pottstown, PA 19464
|
1,992 sq. feet
|
2 baths 4 beds |
show details | |

|
#48
Crestview Dr
Reading, PA 19608
|
3,516 sq. feet
|
2 baths 4 beds |
show details | |

|
#49
Schaeffer St
Boyertown, PA 19512
|
1,320 sq. feet
|
1 baths 3 beds |
show details | |

|
Check over 1 million property listings on Foreclosure.com!
|
browse all offers | |||


 | An Alarming Number Of Businesses Are Leaving East Liberty (559 replies) |
| Best towns in Berks County (Amity, Boyertown, etc.) (22 replies) |
| Cleveburgh (328 replies) |
| Looking for "on golden pond" vacation lake home (26 replies) |
| Possibly moving family to Reading area, need input (9 replies) |
| Old Pittsburgh (86 replies) |
Median year apartment built: 1966
Household type by relationship:
Households: 1,788- Male householders: 329 (67 living alone), Female householders: 391 (148 living alone)
337 spouses (337 opposite-sex spouses), 63 unmarried partners, (50 opposite-sex unmarried partners), 555 children (529 natural, 10 adopted, 16 stepchildren), 29 grandchildren, 7 brothers or sisters, 39 parents, 0 foster children, 12 other relatives, 23 non-relatives
Size of family households: 184 2-persons, 127 3-persons, 68 4-persons, 47 5-persons, 11 6-persons, 12 7-or-more-persons.
Size of nonfamily households: 215 1-person, 51 2-persons, 4 3-persons.
283 married couples with children.
140 single-parent households (34 men, 106 women).
90.1% of residents of St. Lawrence speak English at home.
5.2% of residents speak Spanish at home (56% speak English very well, 17% speak English well, 27% speak English not well).
0.5% of residents speak other Indo-European language at home (100% speak English very well).
2.1% of residents speak Asian or Pacific Island language at home (17% speak English very well, 20% speak English well, 63% speak English not well).
Foreign born population: 56 (3.1%)
(62.5% of them are naturalized citizens)
| Here: | 7.0 |
| State: | 6.8 |
| Here: | 4.7 |
| State: | 4.3 |

- Bedrooms in owner-occupied houses and condos in St. Lawrence, Pennsylvania
- 0no bedroom
- 51 bedroom
- 602 bedrooms
- 3453 bedrooms
- 734 bedrooms
- 205+ bedrooms

- Bedrooms in renter-occupied apartments in St. Lawrence, Pennsylvania
- 0no bedroom
- 851 bedroom
- 542 bedrooms
- 523 bedrooms
- 144 bedrooms
- 135+ bedrooms

- Cars and other vehicles available in St. Lawrence in owner-occupied houses/condos
- 16no vehicle
- 961 vehicle
- 2232 vehicles
- 1463 vehicles
- 154 vehicles
- 85+ vehicles

- Cars and other vehicles available in St. Lawrence in renter-occupied apartments
- 50no vehicle
- 1091 vehicle
- 472 vehicles
- 123 vehicles
- 04 vehicles
- 05+ vehicles

- Rooms in owner-occupied houses in St. Lawrence, Pennsylvania
- 01 room
- 02 rooms
- 183 rooms
- 264 rooms
- 345 rooms
- 1196 rooms
- 1507 rooms
- 488 rooms
- 1099+ rooms

- Rooms in renter-occupied apartments in St. Lawrence, Pennsylvania
- 01 room
- 132 rooms
- 423 rooms
- 474 rooms
- 415 rooms
- 316 rooms
- 167 rooms
- 118 rooms
- 169+ rooms


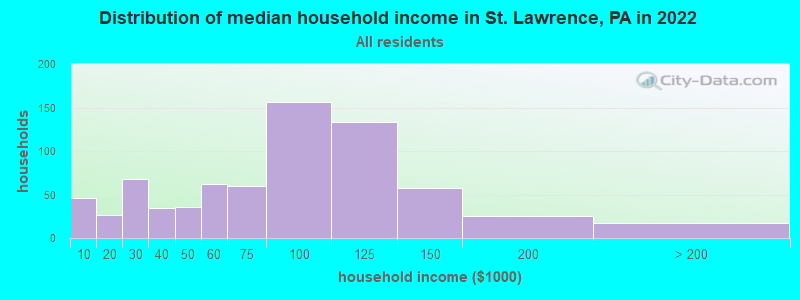
St. Lawrence, PA household income distribution

- 46Less than $10,000
- 27$10,000 to $19,999
- 68$20,000 to $29,999
- 35$30,000 to $39,999
- 36$40,000 to $49,999
- 62$50,000 to $59,999
- 60$60,000 to $74,999
- 156$75,000 to $99,999
- 133$100,000 to $124,999
- 57$125,000 to $149,999
- 25$150,000 to $199,999
- 17$200,000 or more
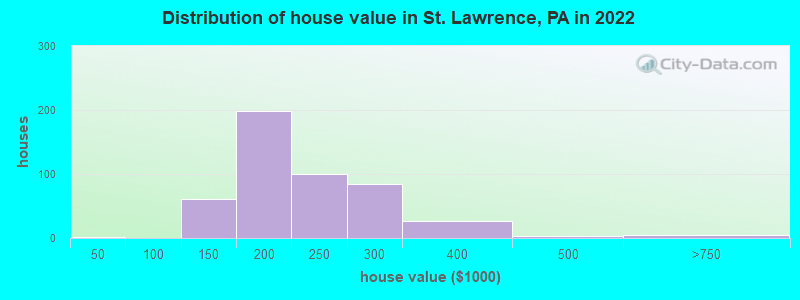
Home value of owner - occupied houses in 2022 in St. Lawrence, PA
-
- 2$20,000 to $24,999
- 48$100,000 to $124,999
- 12$125,000 to $149,999
- 140$150,000 to $174,999
- 58$175,000 to $199,999
- 100$200,000 to $249,999
- 84$250,000 to $299,999
- 26$300,000 to $399,999
- 3$400,000 to $499,999
- 4$500,000 to $749,999
Rent paid by renters in 2022 in St. Lawrence, PA
-
- 1$300 to $349
- 6$450 to $499
- 12$500 to $549
- 5$600 to $649
- 22$650 to $699
- 11$700 to $749
- 2$750 to $799
- 23$800 to $899
- 33$900 to $999
- 35$1,000 to $1,249
- 23$1,250 to $1,499
- 32$1,500 to $1,999
- 12No cash rent


Percentage of workers working in this county: 81.5%
Number of people working at home: 145 (16.2% of all workers)
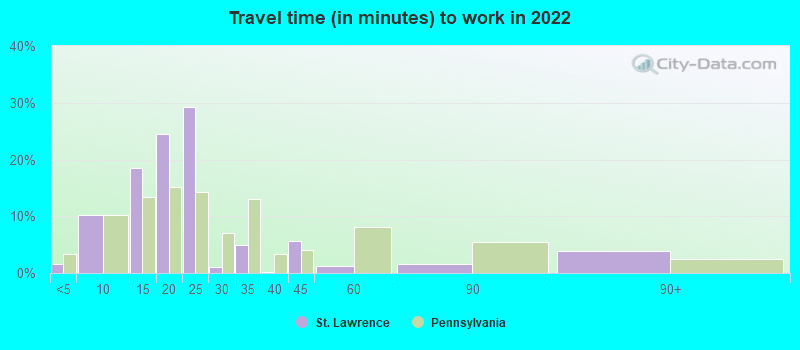
Travel time to work (commute)
- Less than 5 minutes: 29
- 5 to 9 minutes: 77
- 10 to 14 minutes: 65
- 15 to 19 minutes: 91
- 20 to 24 minutes: 142
- 25 to 29 minutes: 93
- 30 to 34 minutes: 97
- 35 to 39 minutes: 10
- 40 to 44 minutes: 29
- 45 to 59 minutes: 43
- 60 to 89 minutes: 39
- 90 or more minutes: 34
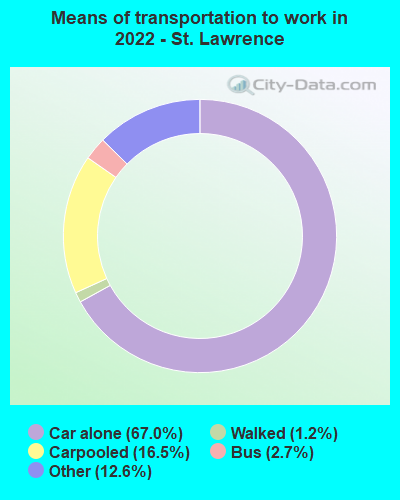
Means of transportation to work:
- Drove a car alone: 615 (58.0%)
- Carpooled: 184 (17.3%)
- Bus: 20 (1.9%)
- Taxi: 80 (7.5%)
- Walked: 7 (0.7%)
- Worked at home: 145 (13.7%)

- Unemployment by race in 2022
- Unemployment rate for White non-Hispanic residents
- 4.4%Males
- 1.5%Females
- Unemployment rate for two or more race residents
- 8.6%Females
- Unemployment rate for Hispanic or Latino residents
- 7.3%Males

- Year of entry for the foreign-born population in St. Lawrence, Pennsylvania
- 112010 or later
- 02000 to 2009
- 201990 to 1999
- 181980 to 1989
- 131970 to 1979
- 10Before 1970

First ancestries reported:
- German: 223 (31.0%)
- Italian: 114 (15.8%)
- Pennsylvania German: 39 (5.4%)
- Polish: 38 (5.3%)
- English: 37 (5.1%)
- Jamaican: 26 (3.6%)
- Irish: 24 (3.3%)
- Greek: 19 (2.6%)
- Scottish: 16 (2.2%)
- American: 14 (1.9%)
- French: 10 (1.4%)
- Dutch: 9 (1.3%)
- Russian: 5 (0.7%)
- Eastern European: 3 (0.4%)
- European: 3 (0.4%)
- Welsh: 3 (0.4%)
- Lithuanian: 2 (0.3%)
- Slovak: 2 (0.3%)
- Haitian: 2 (0.3%)
Most common places of birth for foreign-born residents (%):
| St. Lawrence: | 28.8% (15) |
| Pennsylvania: | 2.9% (27,433) |
| St. Lawrence: | 21.2% (11) |
| Pennsylvania: | 2.4% (22,612) |
| St. Lawrence: | 17.3% (9) |
| Pennsylvania: | 9.2% (86,544) |
| St. Lawrence: | 7.7% (4) |
| Pennsylvania: | 0.6% (5,438) |
| St. Lawrence: | 7.7% (4) |
| Pennsylvania: | 0.6% (6,036) |
| St. Lawrence: | 3.8% (2) |
| Pennsylvania: | 1.6% (15,224) |
| St. Lawrence: | 3.8% (2) |
| Pennsylvania: | 1.5% (13,823) |
| St. Lawrence: | 1.9% (1) |
| Pennsylvania: | 2.2% (21,039) |
Place of birth for U.S.-born residents:
- This state: 1,511
- Other state: 145
- Northeast: 69
- Midwest: 14
- South: 38
- West: 19
87.0% of St. Lawrence residents lived in the same house 1 years ago.
Out of people who lived in different houses, 41.5% lived in this county.
Out of people who lived in different counties, 43.8% lived in Pennsylvania.
| St. Lawrence: | 87.0% |
| State average: | 89.3% |
Education attainment for males 25 years and older:
- No schooling: 16
- Nursery to 4th grade: 0
- 5th and 6th grade: 0
- 7th and 8th grade: 3
- 9th grade: 0
- 10th grade: 0
- 11th grade: 0
- 12th grade, no diploma: 5
- High school graduate (or equivalency): 208
- Less than 1 year of college: 39
- Some college more than 1 year, no degree: 67
- Associate degree: 38
- Bachelor's degree: 171
- Master's degree: 15
- Professional school degree: 2
- Doctorate degree: 10

Education attainment for females 25 years and older:
- No schooling: 4
- Nursery to 4th grade: 0
- 5th and 6th grade: 4
- 7th and 8th grade: 0
- 9th grade: 3
- 10th grade: 3
- 11th grade: 7
- 12th grade, no diploma: 30
- High school graduate (or equivalency): 229
- Less than 1 year of college: 63
- Some college more than 1 year, no degree: 40
- Associate degree: 67
- Bachelor's degree: 192
- Master's degree: 49
- Professional school degree: 0
- Doctorate degree: 6

Housing units in structures:
- One, detached: 391
- One, attached: 178
- Two: 33
- 3 or 4: 10
- 5 to 9: 14
- 10 to 19: 47
- 20 to 49: 54
- 50 or more: 15
Housing units lacking complete kitchen facilities in 2022: 0.4%
House/condo owner moved in on average 13 years ago
Renter moved in on average 2 years ago

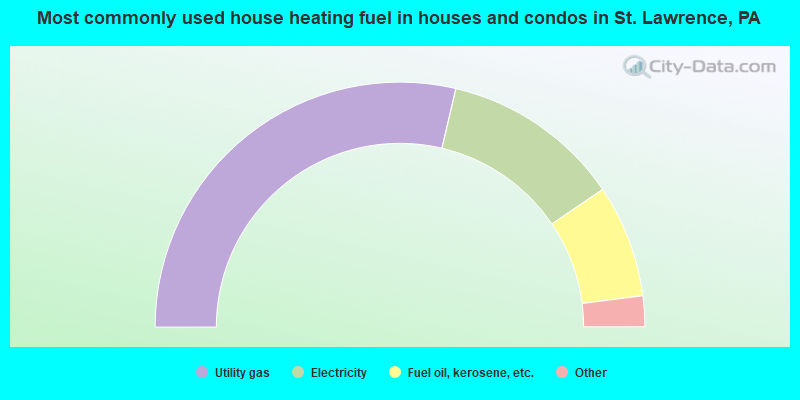
- 57.7%Utility gas
- 23.8%Electricity
- 15.0%Fuel oil, kerosene, etc.
- 2.0%Bottled, tank, or LP gas
- 1.0%Wood
- 0.6%No fuel used
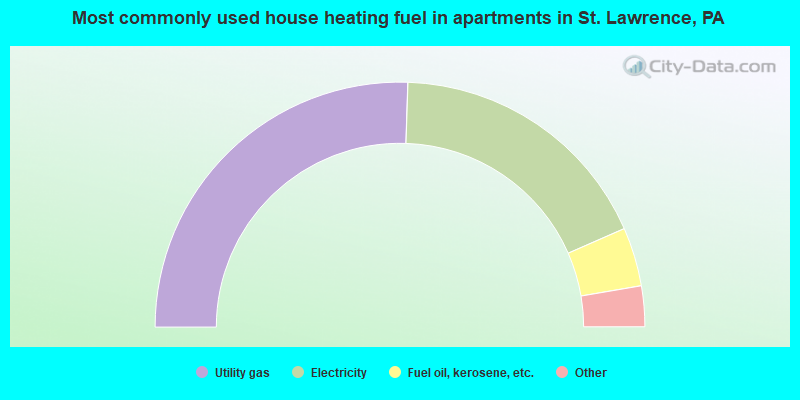
- 51.2%Utility gas
- 35.9%Electricity
- 7.8%Fuel oil, kerosene, etc.
- 3.2%Bottled, tank, or LP gas
- 1.8%No fuel used
Private vs. public school enrollment:
| Here: | 7.0% |
| Pennsylvania: | 15.7% |
| Here: | 2.8% |
| Pennsylvania: | 13.4% |
| Here: | 38.9% |
| Pennsylvania: | 39.8% |


